This was originally posted on our Voronoi app. Download the app for free on iOS or Android and discover incredible data-driven charts from a variety of trusted sources.
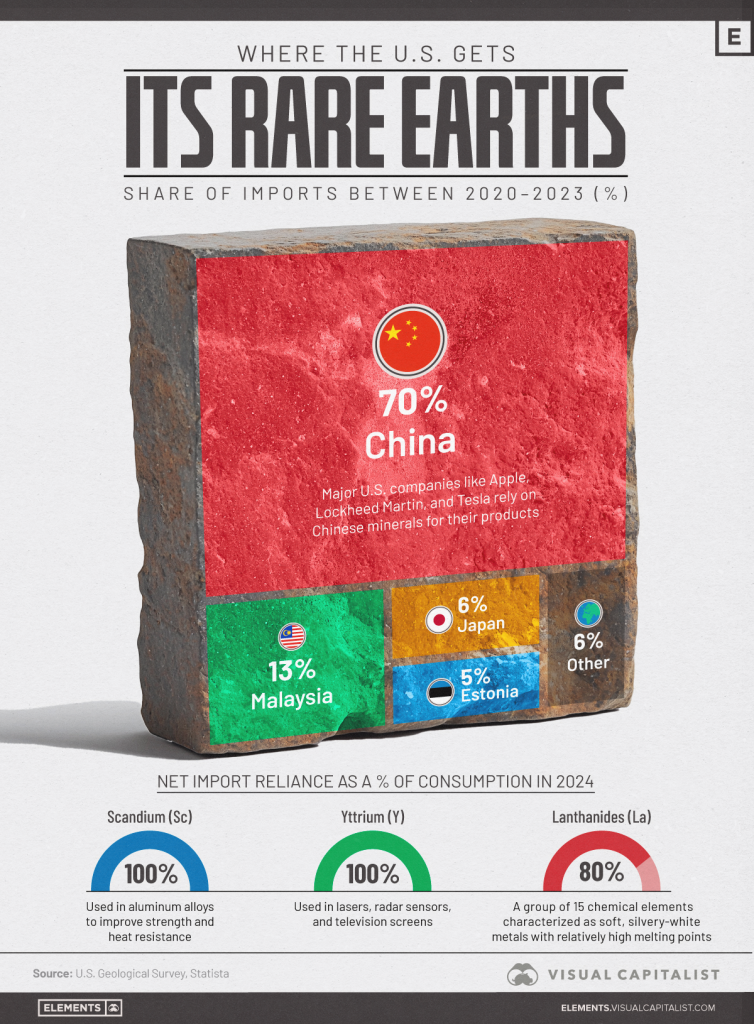
China dominates the global supply of rare earth elements (REEs)—a group of 17 minerals vital to everything from smartphones and electric vehicles to guided missiles and satellites.
Between 2020 and 2023, China accounted for 70% of U.S. rare earth imports, making it by far the country’s top supplier. Malaysia, Japan, and Estonia round out the top four.
Despite their name, rare earths are relatively abundant in the Earth’s crust. The challenge lies in finding them in high enough concentrations—and processing them economically and sustainably.
China produces around 90% of the world’s refined rare earths and is home to the largest capacity for separation and purification, giving it a chokehold on global supply chains.
Take yttrium, for example—used in radar systems, lasers, and television screens. Between 2020 and 2023, 93% of all yttrium compounds imported into the U.S. came from China.
Other critical rare earths affected by this supply concentration include:
Samarium
Gadolinium
Terbium
Dysprosium
Lutetium
Scandium
Many of these elements are essential in military applications, electric motors, and next-gen electronics. Companies like Lockheed Martin, Tesla, and Apple rely on these materials in their core products.
Tariffs, Tensions, and Export Controls
As part of its response to Donald Trump’s new tariffs on Chinese goods, China recently expanded export restrictions on seven rare earth elements, temporarily suspending overseas shipments of the minerals.
The U.S. currently has only one rare earth mine: the Mountain Pass mine in California. While it’s one of the richest rare earth deposits globally, nearly all of the ore extracted there is still shipped to China for final processing.
To diversify away from Chinese dependence, the U.S. has been actively seeking new supply partnerships. One potential opportunity is in Ukraine, which holds Europe’s largest recoverable rare earth reserves. Currently, the Trump administration is working to close a deal to secure access to these untapped resources.
The program for the next seminar on 23rd August 2025 is linked here.
This is a friendly reminder that seats for Friday dinner with Albert Lu are limited. Only the first eighty people who register will be invited. Of course, the price of the ticket will increase as the event date approaches.
If you are already registered, I will email you in two weeks to ask if you will be attending the Friday dinner with Albert Lu.
You may use coupon code PPC2025 for a 10% discount.
While I quite liked our usual room for the seminar, we had audio problems there. So, the new location will be a couple of blocks away. Please make a note of the seminar room location from the webpage.
The playlists of all the past Capitalism & Morality seminars are linked here.
(Bloomberg) — Platinum surged to its highest level since 2014 as supply concerns and a wave of speculative buying jolted the market.
The precious metal surged as much as 4.6%, while palladium was up more than 5% at one point. Gold edged higher as investors waited for clearer signs that Israel-Iran tensions won’t spill over again, and for more certainty on the Federal Reserve’s interest rate path.
“The recent surge in Chinese investment and jewelry replacement is shining a spotlight on platinum’s supply deficit,” said Justin Lin, an analyst at Global X ETFs. “Palladium and platinum are intrinsically linked as they can be substituted for one another for use in autocatalysts depending on relative prices, so we can expect some positive momentum in palladium off of platinum’s rally.”
The dominant platinum spot market in London and Zurich has shown signs of tightness for months, after approximately half a million ounces surged into US warehouses, spurred by a lucrative arbitrage and fear of tariffs.
Forward prices for platinum are now trading well below spot, a situation known as backwardation, which indicates tight market conditions. The implied cost of borrowing the metal is also still high, at an annualized rate of roughly 13% for a one-month lease, well above the usual rate of close to zero.
Platinum surged 3.4% to $1,400.75 an ounce as of 11:25 a.m. in London and palladium jumped 2.4% to $1,093.46. Gold rose 0.2% to $3,339.20 and silver added 1%. The Bloomberg Dollar Spot Index declined 0.5%.
The custodians of trillions of dollars of global central bank reserves are eyeing a move away from the greenback into gold, the euro and China’s yuan as the splintering of world trade and geopolitical upheaval spark a rethink of financial flows.
According to a report by the Official Monetary and Financial Institutions Forum (OMFIF) due to be published later on Tuesday, one in three central banks managing a combined $5 trillion plan to increase exposure to gold over the next one-to-two years after stripping out those planning to decrease, the highest in at least five years.
The survey of 75 central banks — carried out between March and May — gives a first snapshot of the repercussions of US President Donald Trump’s April 2 Liberation Day tariffs that sparked market turmoil and a slide in the safe-haven dollar and US Treasuries.
Gold, which central banks have already been adding at a record pace, was seen benefiting even further longer term, with a net 40% of central banks planning to increase gold holdings over the next decade.
“After years of record-high central bank gold purchases, reserve managers are doubling down on the precious metal,” OMFIF said.
The dollar, the most popular currency in last year’s survey, fell to seventh place this year, OMFIF said, with 70% of those surveyed saying the US political environment was discouraging them from investing in the dollar — more than twice the share a year ago.
In currencies, the euro and yuan stand to benefit the most from a diversification away from the dollar.
A net 16% of central banks surveyed by OMFIF said they plan to increase euro holdings over the next 12 to 24 months, making it the most in-demand currency, up from 7% a year ago, followed by the yuan.
But over the next decade, the yuan is more favoured, with a net 30% of central banks expecting to increase holdings and its share of global reserves seen tripling to 6%.
Net number of central banks looking to increase currency holdings over the next 12-24 months.
Separately, three sources who deal directly with reserve managers, told Reuters they saw the euro as now having the potential to recapture the share of currency reserves lost following the 2011 euro debt crisis by the end of this decade. They cited more positive sentiment among reserve managers towards the euro following Liberation Day.
That would mean a recovery to a roughly 25% share of currency reserves, from around 20% currently, representing a key moment in the bloc’s recovery from the debt crisis that threatened the euro’s existence.
Max Castelli, head of global sovereign markets strategy and advice at UBS Asset Management, told Reuters that reserve managers made many calls after Liberation Day to ask if the dollar’s safe-haven status was at risk.
“As far as I remember, this question has never been asked before, not even after the great financial crisis in 2008.”
The average expectation for the dollar’s share of global FX reserves in 2035 was 52%, the OMFIF survey showed, remaining the No.1 reserve currency but seen down from the current 58%.
Euro’s moment?
OMFIF survey respondents expected the euro to reach about a 22% share of global reserves in 10 years’ time.
“The euro’s share of global reserves will almost surely rise over the next few years, not so much because Europe is viewed so much more favorably, but because the dollar’s status is diminished,” said Kenneth Rogoff, Harvard professor and former IMF chief economist, told Reuters by e-mail ahead of OMFIF’s publication.
The dollar has been hurt by US policy uncertainty
But Europe could attract a higher share of reserves sooner if the bloc is able to boost its pile of bonds that are currently dwarfed by the $29 trillion US Treasury market, while integrating its capital markets, the sources that speak directly to reserve managers, told Reuters.
ECB President Christine Lagarde has also urged action to bolster the euro as a viable dollar alternative.
The euro is the “only real alternative currency for the moment to make a significant change in the level of reserves,” said Bernard Altschuler, global head of central bank coverage at HSBC, adding he saw it as “realistic” for the euro to reach a 25% share of global reserves in 2-3 years if those issues are addressed.
The European Union is the world’s largest trading bloc. Its economy is far bigger than the dollar’s other rivals. Capital controls limit the appeal of the yuan.
Momentum for change has gathered pace, with Europe signalling willingness to curb its dependence on the US by boosting defence spending, including through more joint EU borrowing. Germany is ramping up spending, while the EU is trying to revive efforts to integrate its capital markets.
Public pension and sovereign wealth funds, also surveyed by OMFIF, saw Germany as the most attractive developed market.
UBS Asset Management’s Castelli said he was receiving many more questions about the euro, estimating the euro could recover to a 25% share of reserves by the end of the 2020s.
At the most bullish end, Francesco Papadia, who managed the ECB’s market operations during the debt crisis, estimated the euro could recover to 25% in as soon as two years.
Reserve managers he holds discussions with were more willing to look at the euro than before, Papadia, senior fellow at think-tank Bruegel, said.
Zhou Xiaochuan, China’s central bank chief from 2002 to 2018, agreed the euro’s role as a reserve currency could grow. However, there’s “homework to do,” he told Reuters on the sidelines of a recent conference.
(By Yoruk Bahceli, Dhara Ranasinghe, Jiaxing Li, Leika Kihara and Emily Green; Editing by Elisa Martinuzzi and Anna Driver)
Vancouver, British Columbia–(Newsfile Corp. – June 24, 2025) – Questcorp Mining Inc. (CSE: QQQ) (OTCQB: QQCMF) (FSE: D910) (the “Company” or “Questcorp“) is pleased to announce the commencement of the first phase work program at its La Union carbonate replacement deposit (CRD) project, located in Sonora, Mexico. Questcorp is earning a 100% interest from Riverside Resources Inc. in the 2,520 ha (25 km sq) property by making a series of cash payments and share issuance and completing a series of exploration expenditures.
The initial stages of phase one will concentrate on finalizing the location of drill targets and drill pads for the upcoming drill program. Field activities are underway and include:
Establishment of 5 to 6 one kilometre picket lines for IP surveying which commenced on Monday. The IP lines are being run over the heart of some of the past mining areas which continue to be known expansive target areas to help evaluate further potential, possible most favorable zones and assist to model the larger context for the upcoming drill holes. This work further de-risks the up-coming first pass drill holes.
Sampling of limestone and dolomite host rocks across the mineralization from country rock through to the heart of mineralization for Black Light analysis and alteration vector modeling. The objective is to use the changes or variance in fluorescence to map alteration patterns to vector into the heart of the manto and chimney plumbing systems.
Geological mapping of drill collar sites and section lines particularly along the surface of the IP lines to help develop the most accurate interpretations of the IP data for drill hole planning.
Rock and soil sampling of peripheral areas to identify additional targets including study of the stratigraphy for understanding and context with the many mineralization showings on the large district holding.
“We are extremely pleased to initiate the fully funded first phase work program at La Union,” commented Questcorp President & CEO Saf Dhillon. “We are first concentrating on de-risking the upcoming 1,500 metre drill program scheduled for mid to late Q3 through alteration mapping and IP geophysics,” he continued. “Under the technical expertise of John-Mark Staude and the Riverside team we are confident we are maximizing every exploration dollar being invested at La Union,” he concluded.
Riverside Resources Inc. President & CEO John-Mark Staude stated “The work program is going well, I have been in the field this past week with the exploration team and pleased to see the safe, high quality focus of good work and diving into careful review of the planned drill sites and now the IP program is underway. It is great to work with Saf, Tim and the entire Questcorp organization.”
The La Union Project
The La Union Project is a carbonate replacement deposit (“CRD“) project hosted by Neoproterozoic sedimentary rocks (limestones, dolomites, and siliciclastic sediments) overlying crystalline Paleoproterozoic rocks of the Caborca Terrane. The structural setting features high-angle normal faults and low-to-medium-angle thrust faults that sometimes served as mineralization conduits. Mineralization occurs as polymetallic veins, replacement zones (mantos, chimneys), and shear zones with high-grade metal content, as shown in highlight grades of 59.4 grams per metric tonne (g/t) gold, 833 g/t silver, 11% zinc, 5.5% lead, 2.2% copper, along with significant hematite and manganese oxides, consistent with a CRD model (see the technical report entitled “NI 43-101 Technical Report on the Union Project, State of Sonora, Mexico” dated effective May 6, 2025 available under Questcorp’s SEDAR+ profile). These targets also demonstrate intriguing potential for large gold discoveries potentially above an even larger porphyry Cu district potential as the Company’s target concept at this time.
Questcorp cautions investors grab samples are selective by nature and not necessarily indicative of similar mineralization on the property.
Riverside, the operator of the La Union Project, is currently lining up the various geophysical contractors to immediately undertake orientation surveys and follow up detailed survey to confirm and enhance the drill targets.
The technical and scientific information in this news release has been reviewed and approved by R. Tim Henneberry, P. Geo (BC), a director of the Company and a “qualified person” under National Instrument 43-101 – Standards of Disclosure for Mineral Projects.
About Questcorp Mining Inc.
Questcorp Mining Inc. is engaged in the business of the acquisition and exploration of mineral properties in North America, with the objective of locating and developing economic precious and base metals properties of merit. The Company holds an option to acquire an undivided 100% interest in and to mineral claims totaling 1,168.09 hectares comprising the North Island Copper Property, on Vancouver Island, British Columbia, subject to a royalty obligation. The Company also holds an option to acquire an undivided 100% interest in and to mineral claims totaling 2,520.2 hectares comprising the La Union Project located in Sonora, Mexico, subject to a royalty obligation.
Contact Information
Questcorp Mining Corp. Saf Dhillon, President & CEO Email: saf@questcorpmining.ca Telephone: (604) 484-3031
This news release includes certain “forward-looking statements” under applicable Canadian securities legislation. Forward-looking statements include, but are not limited to, statements with respect to Riverside’s arrangements with geophysical contractors to undertake orientation surveys and follow up detailed survey to confirm and enhance the drill targets. Forward-looking statements are necessarily based upon a number of estimates and assumptions that, while considered reasonable, are subject to known and unknown risks, uncertainties, and other factors which may cause the actual results and future events to differ materially from those expressed or implied by such forward-looking statements. Such factors include, but are not limited to: the ability of Riverside to secure geophysical contractors to undertake orientation surveys and follow up detailed survey to confirm and enhance the drill targets as contemplated or at all, general business, economic, competitive, political and social uncertainties, uncertain capital markets; and delay or failure to receive board or regulatory approvals. There can be no assurance that the geophysical surveys will be completed as contemplated or at all and that such statements will prove to be accurate, as actual results and future events could differ materially from those anticipated in such statements. Accordingly, readers should not place undue reliance on forward-looking statements. The Company disclaims any intention or obligation to update or revise any forward-looking statements, whether as a result of new information, future events or otherwise, except as required by law.
A stack of one-kilogram gold bullion bars inside a vault in Germany.
Central banks around the world have dumped $48 billion in Treasuries since late March alone. At the same time, central banks keep buying gold, continuing a trend that began years earlier.
BofA estimated the central banks’ gold holdings are now equivalent to just under 18% of outstanding U.S. public debt, up from 13% a decade ago.
“That tally should be a warning for US policymakers. Ongoing apprehension over trade and US fiscal deficits may well divert more central bank purchases away from US Treasuries to gold,” analysts warned.
Meanwhile, the market still doesn’t appear to be overexposed to gold. BofA estimated that investors have allocated just 3.5% of their portfolios to gold.
And regardless of how Congress ends up rewriting the budget bill, analysts said deficits will remain elevated.
“Therefore, market concerns over fiscal sustainability are unlikely to fade no matter the result of Senate negotiations,” BofA predicted. “Rates volatility and a weaker USD should then keep gold supported, especially if the US Treasury or the Fed are ultimately forced to step in and support markets.”

 China
China Malaysia
 Japan
Japan Estonia