VANCOUVER, BC / ACCESSWIRE / October 10, 2022 / Metallic Minerals Corp. (TSX.V:MMG; OTCQB:MMNGF) (“Metallic” or the “Company”) is pleased to announce the Company will be presenting at the Emerging Growth Conference on October 12th, 2022 at 9:00am PT (12:00pm ET).
Metallic Minerals Corp., Monday, October 10, 2022, Press release picture
This live, interactive online event will give existing shareholders and the investment community the opportunity to interact with CEO, Greg Johnson, who will discuss global and domestic metals markets, provide an overview of our key projects and upcoming catalysts and participate in a live Q&A session.
Metallic Minerals CEO, Greg Johnson, commented, “We are very pleased to be participating in our first Emerging Growth event and, against the backdrop of recently rebounding metals strength, feel this is excellent timing to introduce investors to the mining sector, the opportunities that abound and the value potential of Metallic Minerals as a precious and base metals explorer with exceptional assets. In 2022, we conducted exploration and drill campaigns at both our high-grade Keno Silver project adjacent to Hecla Mining in Yukon, Canada and our La Plata copper-silver-gold project in Colorado, USA. Results from both are pending receipt of assays and we anticipate news flow in that regard to commence soon.”
About the Emerging Growth Conference
The Emerging Growth conference is an effective way for public companies to present opportunities and communicate major announcements to the investment community in a time efficient manner. Conference focus and coverage includes companies in a wide range of growth sectors with strong management teams, focused strategy and execution, and overall potential for long-term growth. The audience includes individual and institutional investors, as well as investment advisors and analysts.https://embed.fireplace.yahoo.com/embed?ctrl=Monalixa&m_id=monalixa&m_mode=document&site=sports&os=android&pageContext=%257B%2522ctopid%2522%253A%25221542500%253B1480989%253B1481489%253B1577000%2522%252C%2522hashtag%2522%253A%25221542500%253B1480989%253B1481489%253B1577000%2522%252C%2522wiki_topics%2522%253A%2522Hecla_Mining%253BLa_Plata%253BCompany%253BMineral%253BKeno_City%2522%252C%2522lmsid%2522%253A%2522a077000000LnOyOAAV%2522%252C%2522revsp%2522%253A%2522accesswire.ca%2522%252C%2522lpstaid%2522%253A%25227cad23d4-6755-3b0f-9a16-c008e5359400%2522%252C%2522pageContentType%2522%253A%2522story%2522%257D
About Metallic Minerals
Metallic Minerals Corp. is an exploration and development stage company, focused on silver, gold and copper in the high-grade Keno Hill and La Plata mining districts of North America. Our objective is to create shareholder value through a systematic, entrepreneurial approach to making exploration discoveries, growing resources and advancing projects toward development. Metallic Minerals has consolidated the second-largest land position in the historic Keno Hill silver district of Canada’s Yukon Territory, directly adjacent Hecla Mining’s operations, with more than 300 million ounces of high-grade silver in past production and current M&I resources. Hecla Mining Company, the largest primary silver producer in the USA and third largest in the world, completed the acquisition of Alexco in September 2022. In April 2022, Metallic announced the inaugural NI 43-101 mineral resource estimate for its La Plata silver-gold-copper project in southwestern Colorado. The Company also continues to add new production royalty leases on its holdings in the Klondike gold district in the Yukon. All three districts have seen significant mineral production and have existing infrastructure, including power and road access. Metallic Minerals is led by a team with a track record of discovery and exploration success on several major precious and base metal deposits, as well as having large-scale development, permitting and project financing expertise.
Neither the TSX Venture Exchange nor its Regulation Services Provider (as that term is defined in the policies of the TSX Venture Exchange) accepts responsibility for the adequacy or accuracy of this release.
Follow the authors@Edspencive+ Get alerts forEddie Spence+ Get alerts forSing Yee
In this article
There’s a global migration underway in the gold market, as western investors dump bullion while Asian buyers take advantage of a tumbling price to snap up cheap jewelry and bars.
Rising rates that make gold less attractive as an investment mean that large volumes of metal are being drawn out of vaults in financial centers like New York and heading east to meet demand in Shanghai’s gold market or Istanbul’s Grand Bazaar.
In fact, it can’t move fast enough.
Logistical issues combined with quirks of the market are making it difficult for traders to get enough bullion where it’s wanted. As a result, gold and silver are selling at unusually large premiums over the global benchmark price in some Asian markets.
“The incentive to hold gold is a lot lower. It’s going from west to east now,” said Joseph Stefans, head of trading at MKS PAMP SA, a gold refining and trading firm. “We are trying to keep up as best we can.”
Gold items displayed in the window of a jewelry shop inside the Grand Bazaar in Istanbul, Turkey.Photographer: Nicole Tung/Bloomberg
The rotation of metal around the world is part of a gold-market cycle that has repeated for decades: when investors retreat and prices drop, Asian buying picks up and precious metals flow east — helping to put a floor on the gold price during times of weakness.Sponsored ContentWomen are Finding Their Voices in Financial PlanningFirst Horizon Bank
Then, when gold eventually rallies again, much of it returns to sit in bank vaults beneath the streets of New York, London and Zurich.
Since peaking in March, gold prices have tumbled 18% as the Federal Reserve’s aggressive rate hikes caused mass liquidation by financial investors.
More than 527 tons of gold has poured out of New York and London vaults that back the two biggest Western markets since the end of April, according to data from the CME Group Inc. and London Bullion Market Association.
At the same time, shipments are rising into big Asian gold consumers like China, whose imports hit a four-year high in August.
Gold Flows East
Asia has net-imported gold from the West since Aprilhttps://www.bloomberg.com/toaster/v2/charts/8e101e907831c2855279f794770d9a13.html?brand=business&webTheme=default&web=true&hideTitles=true
Source: Swiss Federal Customs Administration
Note: Data shows net-imports from Switzerland from May to August
While plenty of gold is heading east, it’s still not enough to meet demand. Gold in Dubai and Istanbul or on the Shanghai Gold Exchange has traded at multi-year premiums to the London benchmark in recent weeks, according to MKS PAMP — a sign that buying is outstripping imports.
“Demand typically picks up when prices fall,” said Philip Klapwijk, managing director of Hong Kong-based consultant Precious Metals Insights Ltd. “Buyers want to source metal at the lower price and in the local physical market in question there may not be sufficient metal available when the price falls, so the local premium increases.”
Gold in Thailand is also trading at a premium to London prices, due to a lack of supply and weakness in the local currency, according to Jitti Tangsithpakdi, the president of Thailand’s Gold Traders Association.
In India, it is silver that is seeing big premiums. The differential has soared recently to $1, more than triple the usual level, according to consultancy Metals Focus Ltd.
“Right now the demand for silver is huge as traders restock,” said Chirag Sheth, the firm’s principal consultant in Mumbai. “Premiums could remain elevated during the festival season that concludes with Diwali.”
Analysts say that much of the precious metals feeding Asia’s appetite is coming out of vaults run by CME Group, which back the Comex futures market in New York.
Market dislocations early in the pandemic drove a massive surge in prices there, forcing banks to build large stockpiles to cover their futures positions. In recent months gold has traded at a discount on the Comex compared to London, and those inventories are now being drawn down to meet Asian demand.
However, it can be slow going, partly because Asian buyers tend to prefer one-kilogram bars over larger sizes. To fill a standard shipment box of 25 kg of gold, physical traders must take delivery of multiple Comex gold futures, often backed by bullion in different warehouses.
Traders say they are facing other logistical challenges as well, which are contributing to the high Asian premiums.
“Getting stuff on boats or on planes is a bit harder than it used to be,” said MKS PAMP’s Stefans. “It’s really just a classic example of demand far out-pacing supply.”
— With assistance by Swansy Afonso, Suttinee Yuvejwattana and Masumi Suga
APC-12 intersected the highest-grade assay results drilled to date in the Main Breccia discovery at the Apollo target. The hole intercepted a continuous, broad, and consistently high-grade zone of copper-silver-gold mineralization with multiple, overprinting carbonate base metal veins observed within the breccia matrix and returned:
APC-14 intersected two separate zones of mineralization. Importantly, the shallower intercept, beginning at only 45 metres down hole, extended the southern dimension of the Main Breccia discovery and confirmed continuity of copper-silver-gold mineralization directly below the recently announced outcrop discovery with assay results as follows:
The second intercept, which was slightly deeper down hole, cut a remarkably continuous zone of Main Breccia copper-silver-gold mineralization and extended the width of the system slightly to the north with results as follows:
As a result of the intercepts in APC-14, the known width of the system increased by approximately 90% with the overall maximum dimensions of the Main Breccia now measuring 385 metres along strike by 190 metres width by 500 metres depth (prior dimensions were 350 metres x 100 metres x 500 metres). The deposit remains open in all directions.
TORONTO, Oct. 6, 2022 /CNW/ – Collective Mining Ltd. (TSXV: CNL) (OTCQX: CNLMF) (“Collective” or the “Company”) is pleased to announce assay results from four additional holes completed at the Apollo target (“Apollo”) within the Company’s Guayabales project located in Caldas, Colombia. The Main Breccia discovery at Apollo is a high-grade, bulk tonnage copper-gold-silver porphyry-related breccia target with previously announced intercepts including hole APC-2, which intersected 207.15 metres @ 2.68 g/t AuEq and APC-8, which intersected 265.75 metres @ 2.44 g/t gold equivalent (See press releases dated August 10th and September 13th respectively). As part of its fully funded 20,000+ metre drill program for 2022, there are currently three diamond drill rigs operating at the Apollo target.
“The Main Breccia discovery at the Apollo target continues to deliver robust results demonstrating remarkable continuity and grade over significant drilling widths. Drill-hole APC-14 is a very important hole as it not only confirmed that the Main Breccia comes directly to surface in the southern portion of the system but also extended the size (width) of the system to the south and to the north. Subsequent step out drill holes either recently completed or currently underway appear to have intersected significant extensions to the size of the system in the north. Once logging has been completed and interpreted by our team, a further update will be provided in the near term on this exciting development,” commented Ari Sussman, Executive Chairman.
Details (See Table 1 and Figures 1– 5)
Eleven diamond drill holes with accompanying assay results have now been announced at Apollo and based on results, the Main Breccia at Apollo continues to grow and now measures up to 385 metres along strike by 190 metres in width by 500 metres vertical. The target remains open in all directions and continues to develop into a significant bulk tonnage mineralized system.
Assay results have been received for four new sequential drill holes APC-11 through APC-14. Drill holes APC-12 and APC-14 intersected the Main Breccia and were drilled in different directions from two separate drill pads. APC-14 was drilled to the north from Pad 3 to a final depth of 407.5 metres and APC-12 was drilled eastwards to a final depth of 474.4 metres from the newly constructed Pad 4, which is located 300 metres to the north of Pad 3. Drill holes APC-11 and 13 were collared from Pad 2 and were drilled to the south and east to final depths of 243.75 metres and 313.20 metres respectively.https://embed.fireplace.yahoo.com/embed?ctrl=Monalixa&m_id=monalixa&m_mode=document&site=sports&os=android&pageContext=%257B%2522ctopid%2522%253A%25221542500%253B1577000%2522%252C%2522hashtag%2522%253A%25221542500%253B1577000%2522%252C%2522wiki_topics%2522%253A%2522Target_Corporation%253BMetre%253BBreccia%2522%252C%2522lmsid%2522%253A%2522a0770000002lA5sAAE%2522%252C%2522revsp%2522%253A%2522cnwgroup.com%2522%252C%2522lpstaid%2522%253A%25226ced45bf-fe56-3155-9ef3-33846db874a1%2522%252C%2522pageContentType%2522%253A%2522story%2522%257D
Assay results and related details are listed below:
APC-12: 237.70 metres @ 2.88 g/t AuEq from 191.35 metres down hole (170 metres vertical) including: 14.3 metres @ 5.58 g/t AuEq from 209.70 metres down hole; and 21.75 metres @ 8.27 g/t AuEq from 339.55 metres down hole.
APC-12 is the Company’s highest-grade intercept to date within the Main Breccia discovery at Apollo and includes broad, continuous and consistent zones of gold (1.15 g/t Au), silver (72 g/t Ag) and copper (0.38% Cu) grades. The mineralized angular Breccia consists of quartz porphyry clasts and a matrix of chalcopyrite, pyrrhotite and pyrite, all of which are over printed by CBM veins hosting quartz, carbonate, sphalerite and galena.
APC-14:47.45 metres @ 1.36 g/t AuEq from 84.25 metres down hole (45 metres vertical) and 194.30 metres @ 2.00 g/t AuEq from 197.0 metres down hole (130 metres vertical). APC-14 intercepted two zones of mineralized angular breccia with a similar sulphide matrix to APC-12. The shallower zone was intersected only 45 metres below a recently discovered outcrop of the Main Breccia body. The deeper intercept is separated from the shallower one by a post mineralization, diorite dyke and includes the highest proportion of copper intersected to date within the Main Breccia discovery grading 0.44% copper over the entire 194.30 metre interval.
APC-11 was drilled specifically to target a zone of high grade CBM veins and intersected multiple sheeted northwest trending veins and returned a grade range of 11.9 g/t AuEq to 3.48 g/t AuEq over widths ranging from 0.55 metres to 1.35 metres.
APC-13 was sited to intersect the Main Breccia body at depth but was terminated early due to mechanical issues with the rig. Prior to termination, the hole did intercept multiple CBM veins at shallow elevations including:
Three rigs continue to drill at the Apollo project with additional assay results anticipated in the near term, including potentially significant step out holes drilled to the north well past the currently modeled northern boundary of the Main Breccia system.
The Apollo target area, as defined to date by surface mapping, rock sampling and copper and molybdenum soil geochemistry, covers an 800 metres X 700 metres area. The Apollo target area hosts the Company’s new Main Breccia discovery plus a vein system located above and on the eastern flank of the Main Breccia discovery and the Northern Breccia discovery located 250 metres to the north of the Main Breccia. Multiple additional untested breccia, porphyry and vein targets have been generated and will be drilled in due course. The overall Apollo target area also remains open for further expansion.
Table 1: Apollo Target Assays Results
HoleID
From (m)
To (m)
Intercept (m)
Au (g/t)
Ag (g/t)
Cu %
Zn %
Pb %
Mo %
AuEq (g/t)*
APC-11
55.00
55.60
0.60
7.73
28
0.02
0.07
0.47
0.001
8.02
157.55
158.10
0.55
1.88
61
0.06
0.58
0.68
0.001
3.48
160.00
161.20
1.20
2.89
113
0.07
0.74
1.49
0.001
5.64
173.60
174.25
0.65
5.95
18
0.02
0.14
0.17
0.002
6.13
231.00
231.65
0.65
11.80
12
0.01
0.54
0.13
0.001
11.90
234.70
235.45
0.75
2.42
50
0.02
0.14
0.89
0.001
3.51
237.10
238.45
1.35
4.22
11
0.02
0.08
0.08
0.001
4.30
APC-12
191.35
429.05
237.70
1.15
72
0.38
0.08
0.07
0.001
2.88
Incl
209.70
224.00
14.30
4.01
77
0.21
0.27
0.26
0.001
5.58
339.55
361.30
21.75
3.84
210
0.68
0.37
0.45
0.001
8.27
416.90
429.05
12.15
3.64
84
0.22
0.04
0.06
0.001
5.09
APC-13
126.40
143.20
16.80
4.24
19
0.01
0.24
0.21
0.001
4.60
Incl
128.95
132.85
3.90
9.73
34
0.02
0.46
0.32
0.000
10.25
141.20
143.20
2.00
15.54
65
0.02
1.03
1.10
0.001
16.99
242.10
242.80
0.70
3.63
24
0.02
0.12
0.10
0.000
3.97
343.60
353.70
10.10
1.15
16
0.01
0.05
0.05
0.000
1.39
and
343.60
345.60
2.00
2.77
25
0.01
0.10
0.05
0.000
3.09
APC-14
84.25
131.70
47.45
0.81
13
0.20
0.01
0.00
0.003
1.36
197.00
391.30
194.30
0.39
56
0.44
0.03
0.01
0.002
2.00
*AuEq (g/t) is calculated as follows: (Au (g/t) x 0.95) + (Ag g/t x 0.014 x 0.95) + (Cu (%) x 1.96 x 0.95) + (Mo (%) x 7.35 x 0.95)+(Zn(%)x 0.86 x 0.95)+ (Pb(%)x 0.44 x 0.95) utilizing metal prices of Cu – US$4.00/lb, Mo – US$15.00/lb, Zn – US$1.75/lb, Pb – US$0.9/lb, Ag – $20/oz and Au – US$1,400/oz and recovery rates of 95% for Au, Ag, Cu, Mo, Zn and Mo. Recovery rate assumptions are speculative as no metallurgical work has been completed to date.
** A 0.2 g/t AuEq cut-off grade was employed with no more than 15% internal dilution. True widths are unknown, and grades are uncut.
Figure 1: Plan View of the Guayabales Project Highlighting the Apollo Target (CNW Group/Collective Mining Ltd.)
Figure 2: Plan View with Traces of Drill Holes Completed to Date in the Main Breccia Discovery at Apollo with Assay Results for Holes APC-12 to APC-14 in Red (CNW Group/Collective Mining Ltd.)
Figure 3: Zoomed in Plan View of the Main Breccia Discovery at Apollo Highlighting the Increase in the Width of the System in the South and North Due to Hole APC-14 (CNW Group/Collective Mining Ltd.)
Figure 4: Cross Section A-A with Core Photo Highlights for APC-12 (CNW Group/Collective Mining Ltd.)
Figure 5: Cross Section B-B with Core Photo Highlights for APC-14 (CNW Group/Collective Mining Ltd.)
About Collective Mining Ltd.
To see our latest corporate presentation and related information, please visit www.collectivemining.com
Collective Mining is an exploration and development company focused on identifying and exploring prospective mineral projects in South America. Founded by the team that developed and sold Continental Gold Inc. to Zijin Mining for approximately $2 billion in enterprise value, the mission of the Company is to repeat its past success in Colombia by making significant new mineral discoveries and advance the projects to production. Management, insiders and close family and friends own nearly 45% of the outstanding shares of the Company and as a result, are fully aligned with shareholders.
The Company currently holds an option to earn up to a 100% interest in two projects located in Colombia. As a result of an aggressive exploration program at both the Guayabales and San Antonio projects, a total of seven major targets have been defined at Guayabales as well as another three at San Antonio. The Company has made a total of five significant grassroot discoveries at both projects with near-surface discovery holes at the Guayabales project yielding 301.9 metres at 1.11 g/t AuEq at the Olympus target, 163 metres at 1.33 g/t AuEq at the Donut target, 207.15 metres at 2.68 g/t AuEq, 180.6 metres at 2.43 g/t AuEg and 87.8 metres at 2.49 g/t AuEg at the Apollo target and most recently, 102.2m @ 1.53 g/t AuEq at the Trap target. At the San Antonio project, the Company intersected, from surface, 710 metres at 0.53 AuEq. (See related press releases on our website for AuEq calculations)
Qualified Person (QP) and NI43-101 Disclosure
David J Reading is the designated Qualified Person for this news release within the meaning of National Instrument 43-101 (“NI 43-101”) and has reviewed and verified that the technical information contained herein is accurate and approves of the written disclosure of same. Mr. Reading has an MSc in Economic Geology and is a Fellow of the Institute of Materials, Minerals and Mining and of the Society of Economic Geology (SEG).
Technical Information
Rock and core samples have been prepared and analyzed at SGS laboratory facilities in Medellin, Colombia and Lima, Peru. Blanks, duplicates, and certified reference standards are inserted into the sample stream to monitor laboratory performance. Crush rejects and pulps are kept and stored in a secured storage facility for future assay verification. No capping has been applied to sample composites. The Company utilizes a rigorous, industry-standard QA/QC program.
FORWARD-LOOKING STATEMENTS
This news release contains certain forward-looking statements, including, but not limited to, statements about the drill programs, including timing of results, and Collective’s future and intentions. Wherever possible, words such as “may”, “will”, “should”, “could”, “expect”, “plan”, “intend”, “anticipate”, “believe”, “estimate”, “predict” or “potential” or the negative or other variations of these words, or similar words or phrases, have been used to identify these forward-looking statements. These statements reflect management’s current beliefs and are based on information currently available to management as at the date hereof.
Forward-looking statements involve significant risk, uncertainties, and assumptions. Many factors could cause actual results, performance, or achievements to differ materially from the results discussed or implied in the forward-looking statements. These factors should be considered carefully, and readers should not place undue reliance on the forward-looking statements. Although the forward-looking statements contained in this news release are based upon what management believes to be reasonable assumptions, Collective cannot assure readers that actual results will be consistent with these forward-looking statements. These forward-looking statements are made as of the date of this news release, and Collective assumes no obligation to update or revise them to reflect new events or circumstances, except as required by law.
Neither the TSXV nor its Regulation Services Provider (as that term is defined in the policies of the TSXV) accepts responsibility for the adequacy or accuracy of this news release.
Overview map of the Eureka Zone, including VTEM anomaly, exploration target and historical drill results. An asterisk denoted after the drill hole indicates that Pure Nickel Inc. reported the drill hole ended in mineralization. Refer to Millrock’s September 26, 2022 press release for cross-section A – A’.
Figure 2
Overview map of proposed collar locations for initial exploration target testing
VANCOUVER, British Columbia, Oct. 05, 2022 (GLOBE NEWSWIRE) — Millrock Resources Inc. (TSX-V: MRO) (“Millrock”) is pleased to report that a significant exploration target of Ni-Cu-Co-PGE mineralization has been identified at Millrock’s 100% owned Nikolai Project. The Nikolai Project is located within Alaska’s Delta Mining District, approximately 130 kilometers by road south of Delta Junction and approximately 280 kilometers southeast of Fairbanks. The Eureka zone consists of disseminated Ni-Cu-Co-PGE mineralization initially discovered by a subsidiary of INCO and further expanded by Pure Nickel Inc., as reported in their press releases released between 2007-2014. https://embed.fireplace.yahoo.com/embed?ctrl=Monalixa&m_id=monalixa&m_mode=document&site=sports&os=android&pageContext=%257B%2522ctopid%2522%253A%25221542500%253B1480989%253B1481489%2522%252C%2522hashtag%2522%253A%25221542500%253B1480989%253B1481489%2522%252C%2522wiki_topics%2522%253A%2522Target_Corporation%253B%25C3%2589cu%253BNio%253BExploration%2522%252C%2522lmsid%2522%253A%2522a0770000002m0AbAAI%2522%252C%2522revsp%2522%253A%2522globenewswire.com%2522%252C%2522lpstaid%2522%253A%2522c5ed4c96-c955-3257-9e0b-95a99f98e1d5%2522%252C%2522pageContentType%2522%253A%2522story%2522%257D
Millrock President and CEO Gregory Beischer commented: “Our exploration geologists have outlined a block of mineralized rock that could likely be converted to a NI43-101 compliant Inferred Resource with a single drill program estimated to cost approximately $2 million. If successful, Millrock estimates the resulting Inferred Resource may comprise a deposit with approximately 400,000 metric tonnes of contained nickel metal, plus copper, cobalt, and platinum group metals. Other companies exploring similar deposits have significantly higher market capitalization than Millrock. Establishing an Inferred Resource at Nikolai could substantially increase the value of the Company. The planned drilling program would delineate an Inferred Resource over a 400-meter-long strike length. However, indications from sparse drilling along strike in both directions indicate the suspected deposit may be in excess of five kilometers long and contain a very large, albeit low-grade metal endowment.”
Based on historical INCO Ltd. drill hole assay data available to Millrock, newly received assays reported on September 26, 2022, and positive mineralogy results reported on September 29, 2022, Millrock has established a clear exploration target. From the data, a block of mineralized rock measuring 400 meters by 300 meters by 400 meters has been outlined. Drill density is not presently sufficient to calculate an Inferred Resource. However, it is estimated that the exploration target contains between 140 million tonnes and 211 million tonnes, with grades ranging from 0.28% nickel equivalent (“NiEq”*) to 0.42% NiEq*. The target has been developed and modeled in 3D using the average thickness and grade from historical drill holes FL-003 and FL-006 of the Upper Eureka Zone, Central Eureka Zone and Lower Eureka Zone (Figure 1). Historical density studies of the Nikolai ultramafic sequence have returned an average density of 2.83 g/cm3, which was used in the tonnage calculation for this exploration target.
This target is based on two drill hole intersections, extrapolated along strike ~400-meter distance, with the base of the target as the lower mineralized elevation of FL-003. Additional drill holes reported by Pure Nickel are present in the area but were not used in exploration targeting as Millrock does not have access to the full dataset.
Table 1 below details the exploration target’s potential grade and tonnage, with the potential tonnage and grade using a maximum and minimum increase/decrease of 20% to allow for uncertainty.
Table 1. Exploration Target potential grade and tonnages.
Nikolai Ni-Cu-Co-PGE Exploration Target (NiEq & CuEq = $7.00, Cu = $3.50, Co = $25.00, Pt = $900, Pd = $1800, Au = $1600)
Zone
Metric Tonnage Range
Base & Battery Metals
Platinum Group and Precious Metals
Total NiEq2 Range
Total CuEq3 Range
Ni Range
Cu Range
Co Range
NiEq Range1
Pt Range
Pd Range
Au Range
%
%
%
%
g/t
g/t
g/t
%
%
Upper Eureka Zone
48-73
0.16-0.24
0.04-0.06
0.013-0.019
0.23-0.34
0.037-0.055
0.078-0.117
0.005-0.007
0.26-0.39
0.53-0.79
Core Eureka Zone
39-58
0.19-0.29
0.10-0.15
0.016-0.023
0.30-0.45
0.053-0.080
0.113-0.170
0.017-0.025
0.36-0.53
0.66-1.07
Lower Eureka Zone
53-80
0.16-0.24
0.04-0.06
0.013-0.019
0.23-0.34
0.021-0.031
0.050-0.074
0.011-0.016
0.25-0.38
0.51-0.75
Total Eureka Zone
140-211
0.16-0.25
0.06-0.08
0.014-0.020
0.25-0.37
0.035-0.053
0.077-0.115
0.010-0.015
0.28-0.42
0.55-0.85
1. NiEq calculated as Ni+(Cu% x $3.50/$7.00)+(Co% x $25.00/$7.00)
2. Total NiEq calculated as Ni + Cu% x $3.50/$7.00 + Co% x $25.00/$7.00 + Pt(g/t)/31.103 x $900/$7.00/22.04 + Pd(g/t)/31.103 x $1800/$7.00/22.04 + Au(g/t)/31.103 x $1600/$7.00/22.04
3. Total CuEq calculated as Cu + Ni% x $7.00/$3.50 + Co% x $25.00/$3.50 + Pt(g/t)/31.103 x $900/$3.50/22.04 + Pd(g/t)/31.103 x $1800/$3.50/22.04 + Au(g/t)/31.103 x $1600/$3.50/22.04
The potential quantity and grade is conceptual in nature. There has not been sufficient exploration drilling to estimate a Mineral Resource, and it is uncertain if further exploration will result in the estimation of a Mineral Resource.
Additionally, significant upside potential exists, as historical geophysical reports indicated a VTEM anomaly ~3.5 kilometer in length and 400 to 600 meters in width in this part of the Eureka Zone. The developed exploration target accounts for only 12% of the length of the VTEM anomaly (Figure 1). Historical drill hole assay results in this VTEM anomaly, reported by Pure Nickel Inc. (Pure Nickel Inc., News Release, October 29th, 2013), indicate an area of mineralization with an estimated true width ranging from 94.8 meters to 320 meters, and grades ranging from 0.20% to 0.25% nickel, 0.05% to 0.15% copper, 0.016% to 0.019% cobalt, 39 ppb to 96 ppb platinum, 62 ppb to 156 ppb palladium and 11 ppb to 31 ppb Au, with a calculated nickel equivalent (NiEq) ranging from 0.33% to 0.47%.
As reported previously, the Millrock Qualified Person (QP) does not have access to all the Pure Nickel Inc. drill logs, assay results, and geophysical data and has no way to verify the results that were published. The Millrock QP has access to the drill logs and assay certificates for the INCO holes that are designated with the “FL” prefix.
Exploration Target Drill Testing A drill program consisting of seven holes totaling approximately 2,750 meters has been recommended. If successful, the program would, along with historical drill hole information, provide a drill density on 200 meters centers. This drill hole density is believed to be adequate to allow a calculation of an Inferred Resource, given the apparent relative continuity and homogeneity of the mineralized zone. Figure 2 depicts the approximate surface locations of the recommended drill collars for the intial test. Millrock anticipates that the recommended program will prove the exploration target holds significant mineralization and could be expanded along the VTEM anomaly.
Qualified Person The technical information within this document has been reviewed and approved by Gregory A. Beischer, President, CEO, and a director of Millrock. Mr. Beischer is a Qualified Person as defined in NI 43-101.
About Millrock Resources Inc. Millrock Resources Inc. is a premier project generator to the mining industry. Millrock identifies, packages, and operates large-scale projects for joint venture, thereby exposing its shareholders to the benefits of mineral discovery without the usual financial risk taken on by most exploration companies. The company is recognized as the premier generative explorer in Alaska and is a significant shareholder of junior explorers ArcWest Exploration Inc. (TSXV : AWX), Resolution Minerals Limited (ASX : RML), and Felix Gold (ASX: FXG). Funding for drilling at Millrock’s exploration projects is primarily provided by its joint venture partners. Business partners of Millrock have included some of the leading names in the mining industry: EMX Royalty, Coeur Explorations, Centerra Gold, First Quantum, Teck, Kinross, Vale, Inmet and, Altius as well as junior explorers Resolution, Riverside, PolarX, Felix Gold, and Tocvan.
ON BEHALF OF THE BOARD “Gregory Beischer” Gregory Beischer, President & CEO
FOR FURTHER INFORMATION, PLEASE CONTACT: Melanee Henderson, Investor Relations Toll-Free: 877-217-8978 | Local: 604-638-3164 Twitter | Facebook | LinkedIn
Some statements in this news release contain forward-looking information, including but not limited to execution of deportment studies. These statements address future events and conditions and, as such, involve known and unknown risks, uncertainties and other factors which may cause the actual results, performance, or achievements to be materially different from any future results, performance or achievements expressed or implied by the statements. Such factors include without limitation the completion of planned expenditures, the ability to complete exploration programs on schedule and the success of exploration programs.
“NEITHER TSX VENTURE EXCHANGE NOR ITS REGULATION SERVICES PROVIDER (AS THAT TERM IS DEFINED IN THE POLICIES OF THE TSX VENTURE EXCHANGE) ACCEPTS RESPONSIBILITY FOR THE ADEQUACY OR ACCURACY OF THIS RELEASE.”
VANCOUVER, British Columbia, Oct. 05, 2022 (GLOBE NEWSWIRE) — Rover Metals Corp. (TSXV: ROVR) (OTCQB: ROVMF) (FSE:4XO) (“Rover” or the “Company”) is pleased to announce that its new corporate presentation is now available on its website. The Company is also featuring a recently recorded interview with its CEO, Judson Culter, who has provided a corporate update and plans for Q4 of this year.
Rover is a publicly traded junior mining company that trades on the TSXV under symbol ROVR, on the OTCQB under symbol ROVMF, and on the FSE under symbol 4XO. The Company is now developing a diverse portfolio of mineral resource projects: (1) Nevada Claystone Lithium; (2) Zinc-Copper-Lead-Silver in NT, Canada; as well as (3) Gold in NT, Canada. The Company is exclusive to the mining jurisdictions of Canada and the U.S.https://embed.fireplace.yahoo.com/embed?ctrl=Monalixa&m_id=monalixa&m_mode=document&site=sports&os=android&pageContext=%257B%2522ctopid%2522%253A%25221542500%253B1577000%2522%252C%2522hashtag%2522%253A%25221542500%253B1577000%2522%252C%2522wiki_topics%2522%253A%2522Vancouver%253BRover_(marque)%253BTSX_Venture_Exchange%2522%252C%2522lmsid%2522%253A%2522a0770000002m0AbAAI%2522%252C%2522revsp%2522%253A%2522globenewswire.com%2522%252C%2522lpstaid%2522%253A%2522b243763e-490c-3642-8311-1f09ba99905e%2522%252C%2522pageContentType%2522%253A%2522story%2522%257D
You can follow Rover on its social media channels:
ON BEHALF OF THE BOARD OF DIRECTORS “Judson Culter” Chief Executive Officer and Director
For further information, please contact: Email: info@rovermetals.com Phone: +1 (778) 754-2617
Statement Regarding Forward-Looking Information This news release contains statements that constitute “forward-looking statements.” Such forward-looking statements involve known and unknown risks, uncertainties and other factors that may cause Rover’s actual results, performance or achievements, or developments in the industry to differ materially from the anticipated results, performance or achievements expressed or implied by such forward-looking statements. Forward-looking statements are statements that are not historical facts and are generally, but not always, identified by the words “expects,” “plans,” “anticipates,” “believes,” “intends,” “estimates,” “projects,” “potential” and similar expressions, or that events or conditions “will,” “would,” “may,” “could” or “should” occur. There can be no assurance that such statements prove to be accurate. Actual results and future events could differ materially from those anticipated in such statements, and readers are cautioned not to place undue reliance on these forward-looking statements. Any factor could cause actual results to differ materially from Rover’s expectations. Rover undertakes no obligation to update these forward-looking statements in the event that management’s beliefs, estimates or opinions, or other factors, should change.
THE FORWARD-LOOKING INFORMATION CONTAINED IN THIS NEWS RELEASE REPRESENTS THE EXPECTATIONS OF THE COMPANY AS OF THE DATE OF THIS NEWS RELEASE AND, ACCORDINGLY, IS SUBJECT TO CHANGE AFTER SUCH DATE. READERS SHOULD NOT PLACE UNDUE IMPORTANCE ON FORWARD-LOOKING INFORMATION AND SHOULD NOT RELY UPON THIS INFORMATION AS OF ANY OTHER DATE. WHILE THE COMPANY MAY ELECT TO, IT DOES NOT UNDERTAKE TO UPDATE THIS INFORMATION AT ANY PARTICULAR TIME EXCEPT AS REQUIRED IN ACCORDANCE WITH APPLICABLE LAWS.
NEITHER THE TSX VENTURE EXCHANGE NOR ITS REGULATION PROVIDER (AS THAT TERM IS DEFINED IN THE POLICIES OF THE TSX VENTURE EXCHANGE) ACCEPTS RESPONSIBILITY FOR THE ADEQUACY OF THIS RELEASE.
North Vancouver, British Columbia–(Newsfile Corp. – October 4, 2022) – Lion One Metals Limited (TSXV: LIO) (OTCQX: LOMLF) (ASX: LLO) (“Lion One” or the “Company”) is pleased to announce assay results from recent wide-diameter (PQ) core drilled for metallurgical test work at its Tuvatu Gold Project in Fiji.
These results complement the excellent results obtained by the infill drill program completed earlier this year and reported on February 23, 2022 (Lion One Reports Additional High Grade Intercepts, Completes Phase 1 Infill Drill Program at Tuvatu – Lion One Metals). The additional results provided by the metallurgical drill program reported here will be applied to the ongoing remodelling of the Tuvatu orebody that will inform the resource update scheduled for Q1 2023. Results of the metallurgical study that will be based on the material provided by this drilling program will be reported as they are received.
Highlight intercepts include:
TUDDM-001 intersecting the URW1 mineralized vein:
14.96 g/t Au over 24.0m from 81.8-105.8m including:
– 105.19 g/t Au over 0.3m from 86.9-87.2m
– 18.67 g/t Au over 0.6m from 91.4-92.0m
– 19.43 g/t Au over 0.6m from 93.2-93.8m
– 26.59 g/t Au over 0.9m from 95.6-96.5m
– 14.80 g/t Au over 0.6m from 96.5-97.1m
– 23.43 g/t Au over 0.6m from 97.1-97.7m
– 13.63 g/t Au over 0.6m from 97.7-98.3m
– 33.76 g/t Au over 0.6m from 98.3-98.9m
– 22.36 g/t Au over 0.6m from 98.9-99.5m
– 6.04 g/t Au over 0.9m from 99.5-100.4m
– 78.64 g/t Au over 2.4m from 103.4-105.8m which includes:
– 9.44 g/t Au over 0.6m from 104.6-105.2m
– 297.70 g/t Au over 0.6m from 105.2-105.8m
TUDDM-003 intersecting the URW1 mineralized vein:
65.13 g/t Au over 3.2m from 78.8-82.0m including:
– 98.88 g/t Au over 2.1m from 78.8-80.9m which includes:
– 58.18 g/t Au over 0.3m from 78.8-79.1m
– 624.81 g/t Au over 0.3m from 79.1-79.4m
23.27 g/t Au over 3.3m from 118.9-122.2m including
– 50.67 g/t Au over 1.5m from 118.9-120.4m which includes:
– 19.49 g/t Au over 0.9m from 118.9-119.8m
– 97.45 g/t Au over 0.6m from 119.8-120.4m
TUDDM-004 intersecting the SKL and URW1 mineralized veins:
260.44 g/t Au over 0.3m from 55.7-56.0m
213.52 g/t Au over 0.9m from 56.6-57.5m
40.08 g/t Au over 0.9m from 78.2-79.1m
10.03 g/t Au over 3.0m from 130.6-133.6m including:
– 59.82 g/t Au over 0.3m from 130.6-130.9m
– 11.39 g/t Au over 0.3m from 130.9-131.2m
– 13.64 g/t Au over 0.3m from 131.2-131.5m
TUDDM-005 intersecting the Murau (M) mineralized vein:
9.30 g/t Au over 5.4m from 127.7-133.1m including:
– 31.56 g/t Au over 0.6mfrom 128.9-129.5m
– 14.99 g/t Au over 1.2mfrom 129.5-130.7m
– 6.08 g/t Au over 0.9mfrom 132.2-133.1m
22.80g/t Au over 1.5m from 140.3-141.8m including:
– 9.55 g/t Au over 0.3m from 140.6-140.9m
– 10.54 g/t Au over 0.3m from 140.9-141.2m
– 58.59 g/t Au over 0.3m from 141.2-141.5m
– 32.03 g/t Au over 0.3m from 141.5-141.8m
TUDDM-006 intersecting the Murau (M) Lodes
9.87g/t Au over 3.9m from 141.8-145.7m including:
– 10.01g/t Au over 1.2mfrom 141.8-143.0m
– 13.74g/t Au over 0.6m from 143.3-143.9m
– 13.49g/t Au over 1.2m from 144.5-145.7m
All six metallurgical drill holes were drilled from surface using wide diameter PQ core (85mm) between June 6 and August 10, 2022. The purpose of the program was to collect samples from areas scheduled for mining in the first 3 years of development. These assays presented are a result of one eighth split core, with the remaining seven eighths being sent to Bureau Veritas metallurgical laboratory in Vancouver, Canada for test work to assist in the design of optimised recoveries. As this is a metallurgical program, the holes were designed to intersect some vein sets at an oblique angle in-order to maximise mineralized sample recovery and as such, while drill widths does not necessarily represent true widths, the results provide information on the continuity of Au grades. The URW1 lode is interpreted to strike north-south and dip steeply east and has a true width of approximately 1 to 7 metres. The Murau lodes are interpreted to strike east-west with a moderate southerly dip with multiple lodes of true-width between 0.3 and 4 metres. The SKL lodes are dip subhorizontally, with true-widths of between 0.3 and 1 metre.
Lion One CEO Walter Berukoff commented, “These latest results underscore the continuous, high-grade nature of the mineralization at Tuvatu. Each batch of drill results adds enormous value to the project in both addition of ounces to the total metal budget as well as clarification of important upside potential.”
Figure 1. Image from Leapfrog software long-section view west showing select results from metallurgical drilling campaign. The Murau (red) and SKL lode (purple) orientations are projected on to section.
Figure 2. Image from Leapfrog software plan view showing select results from metallurgical drilling campaign. The general outline of the Murau (red) and SKL lode (purple) is projected onto the plan.
Table 1: Drilling intervals returning >0.5 g/t Au. Intervals > 3.0 g/t Au cutoff are shown in red, and intervals > 9.0 g/t Au or longer than 1.2m are bolded.
Hole ID
From (m)
To (m)
Interval
Metres
Lode
TUDDM-001
62.0
62.9
0.9
0.58
SKLW7
TUDDM-001
70.4
71.3
0.9
0.78
SKLW8
TUDDM-001
76.4
77.3
0.9
1.04
Undefined
TUDDM-001
79.4
80.6
1.2
1.56
SKLW12
TUDDM-001
81.8
105.8
24.0
14.96
URW1
Incl.
86.9
87.2
0.3
105.19
URW1
Incl.
91.4
92.0
0.6
18.67
URW1
Incl.
93.2
93.8
0.6
19.43
URW1
Incl.
95.6
96.5
0.9
26.59
URW1
Incl.
96.5
97.1
0.6
14.80
URW1
Incl.
97.1
97.7
0.6
23.43
URW1
Incl.
97.7
98.3
0.6
13.63
URW1
Incl.
98.3
98.9
0.6
33.76
URW1
Incl.
98.9
99.5
0.6
22.36
URW1
Incl.
99.5
100.4
0.9
6.04
URW1
Incl.
103.4
105.8
2.4
78.64
URW1
Which Incl.
104.6
105.2
0.6
9.44
URW1
and incl.
105.2
105.8
0.6
297.70
URW1
TUDDM-001
107.3
112.4
5.1
4.40
URW1
Incl.
107.3
107.9
0.6
17.00
URW1
Incl.
107.9
108.5
0.6
5.63
URW1
TUDDM-001
122.9
123.8
0.9
6.07
M7
Incl.
122.9
123.5
0.6
6.12
M7
Incl.
123.5
123.8
0.3
5.96
M7
TUDDM-002
11.5
19.4
7.9
0.93
ME1
TUDDM-002
23.0
23.3
0.3
2.93
ME1
TUDDM-002
24.8
26.6
1.8
1.31
ME1
TUDDM-002
28.7
29.0
0.3
1.11
ME1
TUDDM-002
30.8
36.2
5.4
3.29
SKLW6
Incl.
33.2
33.5
0.3
19.60
SKLW6
Incl.
33.5
34.1
0.6
6.03
SKLW6
TUDDM-002
40.1
41.0
0.9
1.45
SKLW7
TUDDM-002
47.6
48.2
0.6
1.55
SKLW8
TUDDM-002
51.2
51.5
0.3
14.26
SKLW9
TUDDM-002
55.1
55.7
0.6
0.84
SKLW9
TUDDM-002
59.0
59.6
0.6
3.71
SKLW9
Incl.
59.3
59.6
0.3
5.15
SKLW9
TUDDM-002
61.1
61.7
0.6
0.89
SKLW9
TUDDM-002
64.7
72.6
7.9
2.39
URW1
Incl.
65.6
66.2
0.6
6.76
URW1
Incl.
67.7
68.0
0.3
5.81
URW1
Incl.
69.8
70.1
0.3
5.14
URW1
TUDDM-002
75.3
75.6
0.3
1.66
M8
TUDDM-002
78.9
81.5
2.6
4.83
M8
Incl.
79.7
80.3
0.6
6.75
M8
Incl.
80.3
80.9
0.6
6.71
M8
TUDDM-002
84.2
86.3
2.1
4.24
M8
Incl.
84.2
84.5
0.3
11.91
M8
Incl.
84.5
84.8
0.3
7.41
M8
Incl.
84.8
85.1
0.3
5.17
M8
TUDDM-002
97.8
98.4
0.6
0.81
M9
TUDDM-002
101.1
101.7
0.6
1.71
M9
TUDDM-003
8.6
10.4
1.8
2.52
Undefined
Incl.
9.5
9.8
0.3
6.76
Undefined
TUDDM-003
12.2
13.1
0.9
0.73
Undefined
TUDDM-003
14.3
16.1
1.8
0.64
Undefined
TUDDM-003
17.6
17.9
0.3
0.82
Undefined
TUDDM-003
19.4
20.0
0.6
0.69
Undefined
TUDDM-003
23.6
23.9
0.3
1.43
Undefined
TUDDM-003
26.3
35.9
9.6
2.47
ME1
Incl.
31.7
32.0
0.3
6.79
ME1
Incl.
34.1
34.4
0.3
45.68
ME1
TUDDM-003
37.1
42.3
5.2
0.61
SKLW6
TUDDM-003
45.6
47.1
1.5
0.89
SKLW8
TUDDM-003
49.1
49.7
0.6
2.34
SKLW8
TUDDM-003
50.9
55.1
4.2
2.84
SKLW9
Incl.
51.5
51.8
0.3
5.16
SKLW9
Incl.
54.2
54.5
0.3
7.39
SKLW9
TUDDM-003
65.9
67.4
1.5
0.65
SKLW9
TUDDM-003
71.0
73.4
2.4
9.74
URW1
Incl.
71.6
72.2
0.6
5.00
URW1
Incl.
72.2
72.8
0.6
14.41
URW1
Incl.
72.8
73.4
0.6
16.77
URW1
TUDDM-003
78.8
82.0
3.2
65.13
URW1
Which Incl.
78.8
80.9
2.1
98.88
URW1
Incl.
78.8
79.1
0.3
58.18
URW1
Incl.
79.1
79.4
0.3
624.81
URW1
Incl.
79.4
79.7
0.3
6.20
URW1
TUDDM-003
91.9
93.1
1.2
1.00
URW1
TUDDM-003
95.2
98.9
3.7
4.89
M4
Incl.
95.2
95.8
0.6
12.44
M4
Incl.
97.6
97.9
0.3
18.60
M4
TUDDM-003
101.0
106.4
5.4
4.17
M5
Incl.
101.0
102.2
1.2
9.01
M5
Incl.
103.1
103.7
0.6
10.33
M5
Incl.
103.7
104.3
0.6
5.52
M5
TUDDM-003
118.9
122.2
3.3
23.29
M7
Which Incl.
118.9
120.4
1.5
50.67
M7
Incl.
118.9
119.8
0.9
19.49
M7
Incl.
119.8
120.4
0.6
97.45
M7
TUDDM-003
132.1
133.3
1.2
1.13
M7
TUDDM-004
8.6
8.9
0.3
1.22
M7
TUDDM-004
10.1
10.7
0.6
0.71
M7
TUDDM-004
12.5
16.7
4.2
0.42
M7
TUDDM-004
17.9
18.2
0.3
2.19
M7
TUDDM-004
19.4
22.1
2.7
1.85
M7
Incl.
19.7
20.0
0.3
6.95
M7
TUDDM-004
23.3
23.9
0.6
0.99
M7
TUDDM-004
26
29.6
3.6
0.78
ME1
TUDDM-004
31.1
36.8
5.7
1.11
ME1
TUDDM-004
38.6
39.8
1.2
0.77
Undefined
TUDDM-004
43.4
44.0
0.6
0.56
SKLW6
TUDDM-004
55.7
56.0
0.3
260.44
SKLW8
TUDDM-004
56.6
57.5
0.9
213.52
SKLW8
TUDDM-004
64.7
68.6
3.9
0.85
Undefined
TUDDM-004
78.2
79.1
0.9
40.08
SKLW10
TUDDM-004
83.0
83.9
0.9
1.40
Undefined
TUDDM-004
85.7
86.9
1.2
21.10
SKLW11
Incl.
86
86.9
0.9
26.72
SKLW11
TUDDM-004
89.6
92.3
2.7
3.13
Undefined SKL
Incl.
91.7
92.0
0.3
10.05
Undefined SKL
Incl.
92.0
92.3
0.3
11.03
Undefined SKL
TUDDM-004
95.9
101.2
5.3
4.13
Undefined SKL
Incl.
96.4
97.0
0.6
9.28
Undefined SKL
Incl.
97.0
97.6
0.6
6.87
Undefined SKL
Incl.
100.6
101.2
0.6
7.30
Undefined SKL
TUDDM-004
112.9
114.4
1.5
14.14
Undefined SKL
Incl.
112.9
113.2
0.3
22.61
Undefined SKL
Incl.
113.2
113.5
0.3
11.88
Undefined SKL
Incl.
113.5
114.4
0.9
12.07
Undefined SKL
TUDDM-004
116.2
117.4
1.2
0.95
Undefined SKL
TUDDM-004
121.6
122.5
0.9
4.02
Undefined SKL
TUDDM-004
124.9
125.5
0.6
6.02
URW1
Incl.
125.2
125.5
0.3
11.51
URW1
TUDDM-004
128.5
129.1
0.6
1.09
URW1
TUDDM-004
130.6
133.6
3.0
10.03
URW1
Incl.
130.6
130.9
0.3
59.82
URW1
Incl.
130.9
131.2
0.3
11.39
URW1
Incl.
131.2
131.5
0.3
13.64
URW1
TUDDM-004
136.3
136.9
0.6
2.80
URW1
TUDDM-004
153.0
153.6
0.6
9.79
URW1
TUDDM-005
74.3
79.7
5.4
1.69
M1
Incl.
77.3
77.6
0.3
11.66
M1
TUDDM-005
80.9
83.0
2.1
5.89
M2
TUDDM-005
85.7
86.9
1.2
1.85
M3
TUDDM-005
105.5
106.4
0.9
8.84
M4
TUDDM-005
123.8
126.5
2.7
10.98
M8
Incl.
124.4
124.7
0.3
8.51
M8
Incl.
125.9
126.2
0.3
64.21
M8
Incl.
126.2
126.5
0.3
18.15
M8
TUDDM-005
127.7
133.1
5.4
9.30
M8
Incl.
128.9
129.5
0.6
31.56
M8
Incl.
129.5
130.7
1.2
14.99
M8
Incl.
132.2
133.1
0.9
6.08
M8
TUDDM-005
136.7
139.1
2.4
11.50
M9
Incl.
138.2
138.5
0.3
50.06
M9
Incl.
138.5
138.8
0.3
16.66
M9
Incl.
138.8
139.1
0.3
10.14
M9
TUDDM-005
140.3
141.8
1.5
22.80
M10
Incl.
140.6
140.9
0.3
9.55
M10
Incl.
140.9
141.2
0.3
10.54
M10
Incl.
141.2
141.5
0.3
58.59
M10
Incl.
141.5
141.8
0.3
32.03
M10
TUDDM-006
56.3
56.6
0.3
0.53
M10
TUDDM-006
93.2
95.6
2.4
4.20
M3
Incl.
94.4
95.6
1.2
6.30
M3
TUDDM-006
98.9
99.5
0.6
9.06
M4
Incl.
99.2
99.5
0.3
15.96
M4
TUDDM-006
113.9
114.8
0.9
3.39
M5
TUDDM-006
136.7
138.5
1.8
3.64
M8
Incl.
137.3
138.5
1.2
5.12
M8
TUDDM-006
141.8
145.7
3.9
9.87
M9
Incl.
141.8
143.0
1.2
10.01
M9
Incl.
143.3
143.9
0.6
13.74
M9
Incl.
144.5
145.7
1.2
13.49
M9
Table 2: Survey details of diamond drill holes referenced in this release
Hole No
Coordinates (Fiji map grid)
RL
final depth
dip
azimuth
E
N
m
(TN)
TUDDM-001
1876337
3920739
227.2
151.4
-90
–
TUDDM-002
1876348
3920796
209.5
112.4
-76
219
TUDDM-003
1876350
3920793
206.7
159.4
-59
197
TUDDM-004
1876352
3920798
209.7
154.2
-59
180
TUDDM-005
1876335
3920737
227.3
173.6
-69
304
TUDDM-006
1876335
3920738
227.2
180.1
-59
302
Qualified Person In accordance with National Instrument 43-101 – Standards of Disclosure for Mineral Projects (“NI 43-101”), Sergio Cattalani, P.Geo, Senior Vice President Exploration, is the Qualified Person for the Company and has reviewed and is responsible for the technical and scientific content of this news release.
QAQC Procedures Lion One adheres to rigorous QAQC procedures above and beyond basic regulatory guidelines in conducting its sampling, drilling, testing, and analyses. The Company utilizes its own fleet of diamond drill rigs, using PQ, HQ and NQ sized drill core rods. Drill core is logged and split by Lion One personnel on site. Samples are delivered to and analysed at the Company’s geochemical and metallurgical laboratory in Fiji. Duplicates of all samples with grades above 0.5 g/t Au are both re-assayed at Lion One’s lab and delivered to ALS Global Laboratories in Australia (ALS) for check assay determinations. All samples for all high-grade intercepts are sent to ALS for check assays. All samples are pulverized to 80% passing through 75 microns. Gold analysis is carried out using fire assay with an AA finish. Samples that have returned grades greater than 10.00 g/t Au are then re-analysed by gravimetric method. For samples that return greater than 0.50 g/t Au, repeat fire assay runs are carried out and repeated until a result is obtained that is within 10% of the original fire assay run. For samples with multiple fire assay runs, the average of duplicate runs is presented. Lion One’s laboratory can also assay for a range of 71 other elements through Inductively Coupled Plasma Optical Emission Spectrometry (ICP-OES), but currently focuses on a suite of 9 important pathfinder elements. All duplicate anomalous samples are sent to ALS labs in Townsville QLD and are analysed by the same methods (Au-AA26, and Au-GRA22 where applicable). ALS also analyses for 33 pathfinder elements by HF-HNO3-HClO4 acid digestion, HCl leach and ICP-AES (method ME-ICP61).
About Lion One Metals Limited Lion One’s flagship asset is 100% owned, fully permitted high grade Tuvatu Alkaline Gold Project, located on the island of Viti Levu in Fiji. Lion One envisions a low-cost high-grade underground gold mining operation at Tuvatu coupled with exciting exploration upside inside its tenements covering the entire Navilawa Caldera, an underexplored yet highly prospective 7km diameter alkaline gold system. Lion One’s CEO Walter Berukoff leads an experienced team of explorers and mine builders and has owned or operated over 20 mines in 7 countries. As the founder and former CEO of Miramar Mines, Northern Orion, and La Mancha Resources, Walter is credited with building over $3 billion of value for shareholders.
On behalf of the Board of Directors of Lion One Metals Limited “Walter Berukoff“ Chairman and CEO
Neither the TSX Venture Exchange nor its Regulation Service Provider accepts responsibility for the adequacy or accuracy of this release.
This press release may contain statements that may be deemed to be “forward-looking statements” within the meaning of applicable Canadian securities legislation. All statements, other than statements of historical fact, included herein are forward looking information. Generally, forward-looking information may be identified by the use of forward-looking terminology such as “plans”, “expects” or “does not expect”, “proposed”, “is expected”, “budget”, “scheduled”, “estimates”, “forecasts”, “intends”, “anticipates” or “does not anticipate”, or “believes”, or variations of such words and phrases, or by the use of words or phrases which state that certain actions, events or results may, could, would, or might occur or be achieved. This forward-looking information reflects Lion One Metals Limited’s current beliefs and is based on information currently available to Lion One Metals Limited and on assumptions Lion One Metals Limited believes are reasonable. These assumptions include, but are not limited to, the actual results of exploration projects being equivalent to or better than estimated results in technical reports, assessment reports, and other geological reports or prior exploration results. Forward-looking information is subject to known and unknown risks, uncertainties and other factors that may cause the actual results, level of activity, performance or achievements of Lion One Metals Limited or its subsidiaries to be materially different from those expressed or implied by such forward-looking information. Such risks and other factors may include, but are not limited to: the stage development of Lion One Metals Limited, general business, economic, competitive, political and social uncertainties; the actual results of current research and development or operational activities; competition; uncertainty as to patent applications and intellectual property rights; product liability and lack of insurance; delay or failure to receive board or regulatory approvals; changes in legislation, including environmental legislation, affecting mining, timing and availability of external financing on acceptable terms; not realizing on the potential benefits of technology; conclusions of economic evaluations; and lack of qualified, skilled labour or loss of key individuals. Although Lion One Metals Limited has attempted to identify important factors that could cause actual results to differ materially from those contained in forward-looking information, there may be other factors that cause results not to be as anticipated, estimated or intended. Accordingly, readers should not place undue reliance on forward-looking information. Lion One Metals Limited does not undertake to update any forward-looking information, except in accordance with applicable securities laws.
Vancouver, British Columbia–(Newsfile Corp. – October 4, 2022) – Goldshore Resources Inc. (TSXV: GSHR) (OTCQB: GSHRF) (FSE: 8X00) (“Goldshore” or the “Company“), is pleased to announce assay results from its initial scout drilling campaign testing the historic North Coldstream copper mine (“North Coldstream“) at the Moss Lake Project in Northwest Ontario, Canada (the “Moss Lake Gold Project“).
Highlights:
Initial results from one North Coldstream hole confirm significant copper, cobalt and gold mineralization hosted within a sheared volcanic massive sulphide deposit with best intercepts of:
62.8m @ 0.88% CuE (0.36% Cu, 0.06% Co, 0.30 ppm Au and 3.1 ppm Ag) from 8.2m depth in CND-22-006, including
13.35m @ 1.18% CuE (0.54% Cu, 0.07% Co, 0.39 ppm Au and 3.5 ppm Ag) from 8.2m
14.65m @ 1.30% CuE (0.57% Cu, 0.09% Co, 0.39 ppm Au and 4.4 ppm Ag) from 23.1m
These copper and cobalt results confirm that North Coldstream hasimportant critical mineral value and highlights multiple deposit styles in the district, which is a hallmark of important mineral districts worldwide.
North Coldstream was mapped by last year’s VTEM survey (press release dated March 10, 2022) as a discrete magnetic conductor. There are twelve similar targets in the Moss Lake Project, highlighting the potential for similar copper-cobalt-gold deposits.
Drilling also identified a gold only intercept of 2.1m @ 1.88 g/t Au from 98.9m in the footwall to the North Coldstream VMS deposit, which is related to the East Coldstream style of mineralization 1.6 kilometers to the east, suggesting greater continuity of the gold-bearing structures.
President and CEO Brett Richards stated: “Although we are very focused on the Moss Lake drilling and defining a higher-grade resource within the lower grade historical resource; these findings at North Coldstream are extremely encouraging and provide tremendous potential optionality in the future. As we have illustrated previously to the market, North Coldstream was a past producing copper-gold mine, so these results are not unexpected. However, I think the exciting story is the emergence and identification of cobalt in the historic mine. These drill results prove the value and priority of further drilling and exploration at the North Coldstream deposit, and could identify it as a critical mineral asset, which is important for the development of renewable energies, electrification of vehicles and global decarbonization initiatives.”
Figure 1 shows the location of North Coldstream relative to the main Moss Lake Gold Deposit. Figures 2 and 3 show a plan and long section of the historic workings, respectively, with the location of CND-22-006. Figure 4 shows a photograph of the drill core to illustrate the style of mineralization. Table 1 shows the hole details and Table 2 shows the significant intercepts.
Figure 1: Location map showing North Coldstream relative to Moss Lake
Intersections calculated above a 0.1% Cu cut off with no top cut and a maximum internal waste interval of 2 metres. Bordered intervals are higher grade intersections above a 0.2% Cu cut off. Copper equivalent values assume prices of $3.50/lb Cu, $25/lb Co, $1700/oz Au and $19/oz Ag. Metallurgical recoveries are assumed at 90% Cu, 70% Co, 70% Au and 70% Ag based on similar mineralization in the Copperbelt, however, metallurgical test work is yet to be conducted. True widths are approximate and assume a subvertical body.
Figure 2: Drill plan showing drill hole relative to the historic copper mine
The Company has completed six scout holes to test the geology and multi-element chemistry of the North Coldstream deposit that was mined for copper between 1957 and 1967. The challenging aspect of this program has been drilling to avoid the historic stopes, which has meant, at this stage, drilling the fringes of the deposit as we target extensions to shoots.
CND-22-006 intersected a broad zone of copper mineralization associated with the western edge of the historic workings. While gold and silver credits were expected, based on historic production figures, elevated levels of cobalt in the range of 0.02 to 0.2% Co suggest previously unrecognized critical mineral value at North Coldstream.
A review of the geology has confirmed that the deposit is a sheared volcanic massive sulphide deposit with chalcopyrite-pyrite-pyrrhotite mineralization associated with brecciated siliceous cherts containing variable amounts of syngenetic magnetite (Figure 4). Minor sphalerite mineralization defines a very distinct 40-meter halo around the main massive sulphide lens, bolstering the interpretation of a VMS setting for the mineralization. Within the massive sulphide lens copper, cobalt, gold, and silver grades track each other closely, indicating that they precipitated as part of a single event. In contrast, the narrow intervals of gold mineralization outboard of the main lens are associated with quartz-carbonate veining and have only minor silver and weak copper-cobalt values. These are likely related to the gold mineralization 1.6 kilometers along strike at the East Coldstream deposit and highlight the prospectivity of this trend for additional gold targets.
Figure 4: Photograph of drill core in the main high-grade zone (CND-22-006: 25.9-38.15m averages 1.34% CuE, including 0.59% Cu, 0.09% Co, 0.41 ppm Au and 4.5 ppm Ag)
The Company will address the backlog of North Coldstream core once it has cleared the balance of drill core from Moss Lake. Future drilling will target pillars within the deposit, potential depth extensions, and test similar targets in the district that are characterized by magnetic conductors (press release dated March 10, 2022).
Pete Flindell, VP Exploration for Goldshore, said, “These drill results confirm our expectations of high-grade copper mineralization, especially as we are on the margin of the volcanic massive sulphide lens, and are extremely encouraging with respect to Cobalt grades. While the five pending holes are also around the margin of the system, and therefore likely to contain similar grades, I look forward to drilling closer to the core of the deposit to understand how the critical mineral elements may increase. These data will be invaluable in guiding our future drilling of similar, untested targets within the Moss Lake Project.”
Analytical and QA/QC Procedures
All samples were sent to ALS Geochemistry in Thunder Bay for preparation and analysis was performed in the ALS Vancouver analytical facility. ALS is accredited by the Standards Council of Canada (SCC) for the Accreditation of Mineral Analysis Testing Laboratories and CAN-P-4E ISO/IEC 17025. Samples were analyzed for gold via fire assay with an AA finish (“Au-AA23”) and 48 pathfinder elements via ICP-MS after four-acid digestion (“ME-MS61”). Samples that assayed over 10 ppm Au were re-run via fire assay with a gravimetric finish (“Au-GRA21”).
In addition to ALS quality assurance / quality control (“QA/QC”) protocols, Goldshore has implemented a quality control program for all samples collected through the drilling program. The quality control program was designed by a qualified and independent third party, with a focus on the quality of analytical results for gold. Analytical results are received, imported to our secure on-line database and evaluated to meet our established guidelines to ensure that all sample batches pass industry best practice for analytical quality control. Certified reference materials are considered acceptable if values returned are within three standard deviations of the certified value reported by the manufacture of the material. In addition to the certified reference material, certified blank material is included in the sample stream to monitor contamination during sample preparation. Blank material results are assessed based on the returned gold result being less than ten times the quoted lower detection limit of the analytical method. The results of the on-going analytical quality control program are evaluated and reported to Goldshore by Orix Geoscience Inc.
About Goldshore
Goldshore is an emerging junior gold development company, and owns the Moss Lake Gold Project located in Ontario. Wesdome is currently a large shareholder of Goldshore with an approximate 27% equity position in the Company. Well-financed and supported by an industry-leading management group, board of directors and advisory board, Goldshore is positioned to advance the Moss Lake Gold Project through the next stages of exploration and development.
About the Moss Lake Gold Project
The Moss Lake Gold Project is located approximately 100 km west of the city of Thunder Bay, Ontario. It is accessed via Highway 11 which passes within 1 km of the property boundary to the north. The Moss Lake Gold Project covers 14,292 hectares and consists of 282 unpatented and patented mining claims.
The Moss Lake Gold Project hosts a number of gold and base metal rich deposits including the Moss Lake Deposit, the East Coldstream Deposit (Table 3), the historically producing North Coldstream Mine (Table 4), and the Hamlin Zone, all of which occur over a mineralized trend exceeding 20 km in length. A historical preliminary economic assessment (the “Moss Lake Historical Estimate“) was completed on the Moss Lake Gold Project in 2013 and published by Moss Lake Gold Mines Ltd. (“Moss Lake Gold Mines“)1,3. A historical mineral resource estimate (the “East Coldstream Historical Estimate“) was completed on the East Coldstream Deposit in 2011 by Foundation Resources Inc.2,3 In addition to these zones, the Moss Lake Gold Project also hosts a number of under-explored mineral occurrences which are reported to exist both at surface and in historically drilled holes. The Moss Lake Deposit is a shear-hosted disseminated-style gold deposit which outcrops at surface. It has been drilled over a 2.5 km length and to depths of 300 m with 376 holes completed between 1983 and 2017. The last drilling program conducted in 2016 and 2017 by Wesdome Gold Mines Ltd. (“Wesdome“), which consisted of widely spaced holes along the strike extension of the deposit was successful in expanding the mineralized footprint and hydrothermal system 1.6 km to the northeast. Additionally, the deposit remains largely open to depth. In 2017, Wesdome completed an induced polarization survey which traced the potential extensions of pyrite mineralization associated with the Moss Lake Deposit over a total strike length of 8 km and spanning the entire extent of the survey grids.
The East Coldstream Deposit is a shear-hosted disseminated-style gold deposit which locally outcrops at surface. It has been drilled over a 1.3 km length and to depths of 200 m with 138 holes completed between 1988 and 2017. The deposit remains largely open at depth and may have the potential for expansion along strike. Historic drill hole highlights from the East Coldstream Deposit include 4.86 g/t Au over 27.3 m in C-10-15.
The historically producing North Coldstream Mine is reported to have produced significant amounts of copper, gold and silver4 from mineralization with potential iron-oxide-copper-gold deposit style affinity. The exploration potential immediately surrounding the historic mining area is not currently well understood and historic data compilation is required.
The Hamlin Zone is a significant occurrence of copper and gold mineralization, and also of potential iron-oxide-copper-gold deposit style affinity. Between 2008 and 2011, Glencore tested Hamlin with 24 drill holes which successfully outlined a broad and intermittently mineralized zone over a strike length of 900 m. Historic drill hole highlights from the Hamlin Zone include 0.9 g/t Au and 0.35% Cu over 150.7 m in HAM-11-75.
The Moss Lake, East Coldstream and North Coldstream deposits sit on a mineral trend marked by a regionally significant deformation zone locally referred to as the Wawiag Fault Zone in the area of the Moss Lake Deposit. This deformation zone occurs over a length of approximately 20 km on the Moss Lake Gold Project and there is an area spanning approximately 7 km between the Moss Lake and East Coldstream deposits that is significantly underexplored.
Table 3: Historical Mineral Resources1,2,3
INDICATED
INFERRED
Deposit
Tonnes
Au g/t
Au oz
Tonnes
Au g/t
Au oz
Moss Lake Historical Estimate
Open Pit Potential
39,795,000
1.1
1,377,300
48,904,000
1.0
1,616,300
Underground Potential
–
–
–
1,461,100
2.9
135,400
Moss Lake Total
39,795,000
1.1
1,377,300
50,364,000
1.1
1,751,600
East Coldstream Historical Estimate
East Coldstream Total
3,516,700
0.85
96,400
30,533,000
0.78
763,276
Combined Total
43,311,700
1.08
1,473,700
80,897,000
0.98
2,514,876
Notes:
(1) Source: Poirier, S., Patrick, G.A., Richard, P.L., and Palich, J. “Technical Report and Preliminary Economic Assessment for the Moss Lake Project”, prepared for Moss Lake Gold Mines Ltd. The qualified persons for the Moss Lake Historical Estimate are Pierre-Luc Richard, MSc, PGeo (InnovExplo Inc), and Carl Pelletier, BSc, PGeo (InnovExplo Inc), and the effective date of the Moss Lake Historical Estimate is February 8, 2013. In-Pit results are presented undiluted and in situ, within Whittle-optimized pit shells. Underground results are presented undiluted and in situ, outside Whittle-optimized pit shells. The Moss Lake Historical Estimate includes 18 gold-bearing zones and 1 envelope containing isolated gold intercepts. Whittle parameters: mining cost = C$2.28; pit slope angle = 50.0 degrees; production cost = C$9.55; mining Dilution = 5%; mining recovery = 95%; processing recovery = 80% to 85%; gold price = C$1,500. In-Pit and Underground resources were compiled at cut-off grades from 0.3 to 5.0 g/t Au (for sensitivity characterization). A cut-off grade of 0.5 g/t Au was selected as the official in-pit cut-off grade and a cut-off grade of 2.0 g/t Au was selected as the official underground cut-off grade. The Moss Lake Historical Estimate is based on 352 diamond drill holes (90,978 m) drilled from 1983 and 2008. A fixed density of 2.78 g/cm3 was used. A minimum true thickness of 5.0 m was applied, using the grade of the adjacent material when assayed or a value of zero when not assayed. Capping was established at 35 g/t Au, supported by statistical analysis and the high grade distribution within the deposit. Compositing was done on drill hole sections falling within the mineralized zone solids (composite = 1 m). Resources were evaluated from drill hole samples using the ID2 interpolation method in a multi-folder percent block model using Gems version 6.4. Based on geostatistics, the ellipse range for interpolation was 75m x 67.5m x 40m. The Indicated category is defined by combining the blocks within the two main zones and various statistical criteria, such as average distance to composites, distance to closest composite, quantity of drill holes within the search area. Ounce (troy) = metric tons x grade / 31.10348. Calculations used metric units (metres, tonnes and g/t). The number of metric tonnes was rounded to the nearest thousand. Any discrepancies in the totals are due to rounding effects; rounding followed the recommendations in NI 43-101.
(2) Source: McCracken, T. “Technical Report and Resource Estimate on the Osmani Gold Deposit, Coldstream Property, Northwestern Ontario”, prepared for Foundation Resources Inc. and Alto Ventures Ltd. The East Coldstream Historical Estimate is based on a 0.4 g/t Au cut-off grade. The qualified persons for the East Coldstream Historical Estimate are Todd McCracken, P.Geo. (Tetratech Wardrop), and Jeff Wilson, Ph.D., P.Geo. (Tetratech Wardrop), and the effective date of the East Coldstream Historical Estimate is December 12, 2011. Resources are presented unconstrained, undiluted and in situ. The East Coldstream Historical Estimate includes 2 gold-bearing zones. A cut-off grade of 0.4 g/t Au was selected as the official resource cut-off grade. The East Coldstream Historical Estimate is based on 116 diamond drill holes drilled from 1986 to 2011. A fixed density of 2.78 g/cm3 was used. Capping was established at 5.89 g/t Au and 5.70 g/t Au for domains EC-1 and EC-2, respectively. This is supported by statistical analysis and the high grade distribution within the deposit. Compositing was done on drill hole sections falling within the mineralized zone solids (composite = 1 m). Resources were evaluated from drill hole samples using the ID2 interpolation method in a multi-folder percent block model using Datamine Studio 3 version 3.20.5321.0. Resource categorization is based on spatial continuity based from the variography of the assays within the drillholes. Ounce (troy) = metric tons x grade / 31.10348. Calculations used metric units (metres, tonnes and g/t). The number of metric tonnes was rounded to the nearest thousand. Any discrepancies in the totals are due to rounding effects; rounding followed the recommendations in NI 43-101.
(3) The reader is cautioned that the Moss Lake Historical Estimate East and the East Coldstream Historical Estimate (the “Historical Estimates“) are considered historical in nature and as such is based on prior data and reports prepared by previous property owners. The reader is cautioned not to treat them, or any part of them, as current mineral resources or reserves. The Company has determined these historical resources are reliable, and relevant to be included here in that they demonstrate simply the mineral potential of the Moss Lake Gold Project. A qualified person has not done sufficient work to classify the Historical Estimates as current resources and Goldshore is not treating the Historical Estimates as current resources. Significant data compilation, re-drilling, re-sampling and data verification may be required by a qualified person before the Historical Estimates can be classified as a current resource. There can be no assurance that any of the historical mineral resources, in whole or in part, will ever become economically viable. In addition, mineral resources are not mineral reserves and do not have demonstrated economic viability. Even if classified as a current resource, there is no certainty as to whether further exploration will result in any inferred mineral resources being upgraded to an indicated or measured mineral resource category. The Historical Estimates relating to inferred mineral resources were calculated using prior mining industry standard definitions and practices for estimating mineral resource and mineral reserves. Such prior definitions and practices were utilized prior to the implementation of the current standards of the Canadian Institute of Mining for mineral resource estimation, and have a lower level of confidence.
Table 4: Reported Historical Production from the North Coldstream Deposit4
Deposit
Tonnes
Cu %
Au g/t
Ag
Cu lbs
Au oz
Ag oz
Historical Production
2,700,0000
1.89
0.56
5.59
102,000,000
44,000
440,000
Note::
(4) Source: Schlanka, R., 1969. Copper, Nickel, Lead and Zinc Deposits of Ontario, Mineral Resources Circular No. 12, Ontario Geological Survey, pp. 314-316.
Peter Flindell, P.Geo., MAusIMM, MAIG, Vice President – Exploration of the Company, a qualified person under NI 43-101 has approved the scientific and technical information contained in this news release.
Neither the TSXV nor its Regulation Services Provider (as that term is defined in the policies of the TSXV) accepts responsibility for the adequacy or accuracy of this release.
For More Information – Please Contact:
Brett A. Richards President, Chief Executive Officer and Director Goldshore Resources Inc.
This news release contains statements that constitute “forward-looking statements.” Such forward looking statements involve known and unknown risks, uncertainties and other factors that may cause the Company’s actual results, performance or achievements, or developments to differ materially from the anticipated results, performance or achievements expressed or implied by such forward-looking statements. Forward looking statements are statements that are not historical facts and are generally, but not always, identified by the words “expects,” “plans,” “anticipates,” “believes,” “intends,” “estimates,” “projects,” “potential” and similar expressions, or that events or conditions “will,” “would,” “may,” “could” or “should” occur.
Forward-looking statements in this news release include, among others, statements relating to expectations regarding the exploration and development of the Moss Lake Gold Project, and other statements that are not historical facts. By their nature, forward-looking statements involve known and unknown risks, uncertainties and other factors which may cause our actual results, performance or achievements, or other future events, to be materially different from any future results, performance or achievements expressed or implied by such forward-looking statements. Such factors and risks include, among others: the Company may require additional financing from time to time in order to continue its operations which may not be available when needed or on acceptable terms and conditions acceptable; compliance with extensive government regulation; domestic and foreign laws and regulations could adversely affect the Company’s business and results of operations; the stock markets have experienced volatility that often has been unrelated to the performance of companies and these fluctuations may adversely affect the price of the Company’s securities, regardless of its operating performance; and the impact of COVID-19.
The forward-looking information contained in this news release represents the expectations of the Company as of the date of this news release and, accordingly, is subject to change after such date. Readers should not place undue importance on forward-looking information and should not rely upon this information as of any other date. The Company undertakes no obligation to update these forward-looking statements in the event that management’s beliefs, estimates or opinions, or other factors, should change.
This news release does not constitute an offer to sell, or a solicitation of an offer to buy, any securities in the United States. The securities have not been and will not be registered under the United States Securities Act of 1933, as amended (the “U.S. Securities Act”) or any state securities laws and may not be offered or sold within the United States or to U.S. Persons unless registered under the U.S. Securities Act and applicable state securities laws or an exemption from such registration is available.
Vancouver, British Columbia–(Newsfile Corp. – October 4, 2022) – EMX Royalty Corporation (NYSE American: EMX) (TSXV: EMX) (FSE: 6E9) (the “Company” or “EMX”) is pleased to announce that it will receive a US$3 million milestone payment from Arizona Sonoran Copper Company, Inc. (TSX: ASCU) (“ASCU”) for the Parks-Salyer royalty property (the “Royalty Property”) in Arizona. The Royalty Property was held under a lease arrangement by EMX’s wholly owned subsidiary Bronco Creek Exploration Inc., and was transferred to ASCU via Assignment and Royalty Agreements (the “Agreements”) executed earlier this year (see EMX news release dated February 10, 2022). EMX’s Royalty Property covers 158 acres of ASCU’s Parks-Salyer copper project. The milestone payment results from ASCU’s maiden resource estimate for the Parks-Salyer project that exceeds thresholds for contained copper included within EMX’s Royalty Property footprint. The Company also retains a 1.5% net smelter return (“NSR”) royalty covering the Royalty Property.
EMX’s Parks-Salyer Royalty Property provides an example of a significant pre-production payment to the Company resulting from its copper porphyry royalty generation program in Arizona. The Property’s porphyry targets, which are concealed beneath post-mineral cover, were identified by EMX based upon structural geological assessments of historical exploration data. The open ground covering these targets was acquired by EMX at minimal cost. The 158 acres transferred to ASCU complemented the property position at its Parks-Salyer project, while providing EMX with pre-production payments and exploration, development, and royalty upside optionality at no additional cost to the Company.
Commercial Terms and Property Summary (all dollar amounts in USD). The Agreements provided for a one-time cash payment to EMX for the assignment of EMX’s rights covering the Property, as well as the 1.5% NSR royalty interest (ASCU may buy back 1% of the royalty for $500,000), work commitments, annual advance royalty (“AAR”) payments, and the $3 million milestone payment to EMX based upon declared resources totaling 200 million pounds or more of contained copper covered by EMX’s Royalty Property. ASCU’s (global) maiden resources for its Parks-Salyer project were disclosed in a news release dated September 28, 2022.
Parks-Salyer is located approximately five kilometers northwest of Casa Grande, Arizona and approximately 1.5 kilometers southwest of the historical Sacaton open pit copper mine. Sacaton was a porphyry copper-molybedenum mine operated by Asarco (1974-1984), and is now being advanced by ASCU as the PEA stage Cactus Project. The Parks-Salyer deposit lies beneath post-mineral gravels and represents a tilted, and fault-displaced portion of the Casa Grande-Santa Cruz porphyry system.
Qualified Person. Michael P. Sheehan, CPG, a Qualified Person as defined by National Instrument 43-101 and employee of the Company, has reviewed, verified and approved the disclosure of the technical information contained in this news release.https://embed.fireplace.yahoo.com/embed?ctrl=Monalixa&m_id=monalixa&m_mode=document&site=sports&os=android&pageContext=%257B%2522ctopid%2522%253A%25221542500%253B1577000%2522%252C%2522hashtag%2522%253A%25221542500%253B1577000%2522%252C%2522wiki_topics%2522%253A%2522Arizona%253BCompany%253BCasa_Grande%252C_Arizona%253BCopper_Project%2522%252C%2522lmsid%2522%253A%2522a0V0W00000HOPDcUAP%2522%252C%2522revsp%2522%253A%2522newsfile_64%2522%252C%2522lpstaid%2522%253A%2522d7d1d544-54c0-352e-9892-db00e84c428c%2522%252C%2522pageContentType%2522%253A%2522story%2522%257D
About EMX. EMX is a precious, base and battery metals royalty company. EMX’s investors are provided with discovery, development, and commodity price optionality, while limiting exposure to risks inherent to operating companies. The Company’s common shares are listed on the NYSE American Exchange and the TSX Venture Exchange under the symbol EMX, and also trade on the Frankfurt exchange under the symbol “6E9”. Please see www.EMXroyalty.com for more information.
About Arizona Sonoran Copper Company. ASCU’s objective is to become a mid-tier copper producer with low operating costs, develop the Cactus and Parks-Salyer Project that could generate robust returns for investors, and provide a long term sustainable and responsible operation for the community and all stakeholders. The Company’s principal asset is a 100% interest in the Cactus Project (former ASARCO, Sacaton mine) and Parks-Salyer deposit which is situated on private land in an infrastructure-rich area of Arizona.
For further information contact:
David M. Cole President and Chief Executive Officer Phone: (303) 973-8585 Dave@emxroyalty.com
Scott Close Director of Investor Relations Phone: (303) 973-8585 SClose@emxroyalty.com
Neither the TSX Venture Exchange nor its Regulation Services Provider (as that term is defined in policies of the TSX Venture Exchange) accepts responsibility for the adequacy or accuracy of this release.
Forward-Looking Statements
This news release may contain “forward looking statements” that reflect the Company’s current expectations and projections about its future results. These forward-looking statements may include statements regarding perceived merit of properties, exploration results and budgets, mineral reserve and resource estimates, work programs, capital expenditures, timelines, strategic plans, market prices for precious and base metal, or other statements that are not statements of fact. When used in this news release, words such as “estimate,” “intend,” “expect,” “anticipate,” “will”, “believe”, “potential” and similar expressions are intended to identify forward-looking statements, which, by their very nature, are not guarantees of the Company’s future operational or financial performance, and are subject to risks and uncertainties and other factors that could cause the Company’s actual results, performance, prospects or opportunities to differ materially from those expressed in, or implied by, these forward-looking statements. These risks, uncertainties and factors may include, but are not limited to: unavailability of financing, failure to identify commercially viable mineral reserves, fluctuations in the market valuation for commodities, difficulties in obtaining required approvals for the development of a mineral project, increased regulatory compliance costs, expectations of project funding by joint venture partners and other factors.
Readers are cautioned not to place undue reliance on these forward-looking statements, which speak only as of the date of this news release or as of the date otherwise specifically indicated herein. Due to risks and uncertainties, including the risks and uncertainties identified in this news release, and other risk factors and forward-looking statements listed in the Company’s MD&A for the quarter ended June 30, 2022 and the year ended December 31, 2021 (the “MD&A”), and the most recently filed Revised Annual Information Form (the “AIF”) for the year ended December 31, 2021, actual events may differ materially from current expectations. More information about the Company, including the MD&A, the AIF and financial statements of the Company, is available on SEDAR at www.sedar.com and on the SEC’s EDGAR website at www.sec.gov.
Vancouver, British Columbia–(Newsfile Corp. – October 3, 2022) – Dolly Varden Silver Corporation (TSXV: DV) (OTCQX: DOLLF)(“Dolly Varden”) and Fury Gold Mines Ltd (“Fury”) are pleased to announce that Dolly Varden’s largest shareholder, Fury, with the approval and consent of Dolly Varden, has entered into an agreement to sell 17 million common shares at C$0.40 in the capital of the Dolly Varden (“Common Shares“), representing approximately 7.4% of the outstanding Common Shares, to a well known institutional investor (the “Transaction“).
Fury approached Dolly Varden about the sale of a portion of its Common Shares as a way for Fury to finance continued exploration at the Eau Claire and Éléonore South Joint Venture projects in Quebec and for general working capital. Following completion of the Transaction, Fury will continue to hold approximately 26% of the Common Shares and will be well capitalized for its upcoming exploration activities. While Dolly Varden will receive no proceeds from the Transaction, the company is pleased to be welcoming a new financial institutional investor.
Shawn Khunkhun, Chief Executive Officer of Dolly Varden said, “We are pleased to have been involved in discussions regarding the Transaction and to consent to the sale by Fury of a portion of its holdings in Dolly Varden to a new institutional investor for Dolly Varden. We believe the transaction is mutually beneficial for Dolly Varden and Fury as it brings another experienced institutional investor to Dolly Varden while providing Fury with funding for its Eau Claire and Éléonore South Joint Venture projects in Quebec. We consider Fury to be our partner in the exploration and development of the Company’s proposed Kitsault Valley Project, and we are happy to be able to support a transaction that benefits both companies.”
Tim Clark, CEO and Director of Fury, added, “We would like to thank Dolly Varden for the support on this mutually beneficial transaction. We view this as a prudent and strategic joint decision that will provide capitalization for Fury’s exciting potential at its Eau Claire and Éléonore South Joint Venture projects, and also add a significant institutional investor to Dolly Varden’s current share ownership. Going forward, Fury is still the largest investor in Dolly Varden at 26% and we remain confident in both their management team and projects. We believe that success in this industry is about working well with your partners and are thrilled about the opportunities ahead for both companies.”
Fury acquired the Common Shares of Dolly Varden in February 2022 when Dolly Varden acquired, through the acquisition of Fury’s wholly-owned subsidiary Homestake Resource Corporation, a 100% interest in the Homestake Ridge gold-silver project (the “Homestake Ridge Project“), located adjacent to the Dolly Varden Project in the Golden Triangle, British Columbia.
At that time, Dolly Varden and Fury also entered into an investor rights agreement (the “Investor Rights Agreement“) granting Fury certain board nomination and participation rights as well as providing for customary re-sale restrictions, voting and standstill conditions and a one-year hold period. Dolly Varden has provided its consent under the Investor Rights Agreement to the Transaction.
Dolly Varden understands that Fury intends to file a Form 45-102F1 Notice of Intention to Distribute Securities under Section 2.8 of National Instrument 45-102 – Resale of Securities later today to facilitate the sale. Closing of the Transaction is anticipated to occur on the business day following the expiry of the seven day notice period under NI 45-102. It is not anticipated that the purchaser will become a 10% or greater shareholder of Dolly Varden upon completion of the Transaction.
Upon completion of the Transaction, the ownership interest of Fury in Dolly Varden will be reduced from the current 76,504,590 Shares, representing 33% of the outstanding common shares of Dolly Varden, to 59,504,590 Dolly Varden Shares, representing 26% of the outstanding common shares of Dolly Varden. Fury will file an amendment to its current Early Warning Report on SEDAR to reflect its change in ownership position. Fury will continue to have two nominees on Dolly Varden’s board of directors under the Investor Rights Agreement following completion of the Transaction as Fury’s ownership will remain above the 20% level. Fury will continue to hold its shares in Dolly Varden for investment purposes and will evaluate its investment in Dolly Varden on ongoing basis and may increase or decrease its holdings in Dolly Varden in the future, subject to its rights and obligations under the Investor Rights Agreement, a copy of which has been filed under Fury’s and Dolly Varden’s SEDAR profile.
About Dolly Varden Silver Corporation
Dolly Varden Silver Corporation is a mineral exploration company focused on advancing its 100% held Kitsault Valley Project (which combines the Dolly Varden Project and the Homestake Ridge Project) located in the Golden Triangle of British Columbia, Canada, 25kms by road to tide water. The 163 sq. km. project hosts the high-grade silver and gold resources of Dolly Varden and Homestake Ridge along with the past producing Dolly Varden and Torbrit silver mines. It is considered to be prospective for hosting further precious metal deposits, being on the same structural and stratigraphic belts that host numerous other, on-trend, high-grade deposits, such as Eskay Creek and Brucejack. The Kitsault Valley Project also contains the Big Bulk property which is prospective for porphyry and skarn style copper and gold mineralization, similar to other such deposits in the region (Red Mountain, KSM, Red Chris).
About Fury Gold Mines Limited
Fury Gold Mines Limited is a well financed Canadian-focused exploration company positioned in two prolific mining regions across the country and holds a 59.5 million common share position in Dolly Varden Silver Corp. Led by a management team and board of directors with proven success in financing and advancing exploration assets, Fury intends to grow its multi-million-ounce gold platform through rigorous project evaluation and exploration excellence. Fury is committed to upholding the highest industry standards for corporate governance, environmental stewardship, community engagement and sustainable mining. For more information on Fury Gold Mines, visit www.furygoldmines.com.
This release may contain forward-looking statements or forward-looking information under applicable Canadian securities legislation that may not be based on historical fact, including, without limitation, statements containing the words “believe”, “may”, “plan”, “will”, “estimate”, “continue”, “anticipate”, “intend”, “expect”, “potential”, and similar expressions. Forward-looking statements involve known and unknown risks, uncertainties, and other factors which may cause the actual results, performance, or achievements of Dolly Varden to be materially different from any future results, performance, or achievements expressed or implied by the forward-looking statements. Forward-looking statements or information in this release relates to, among other things, the intended closing of the Transaction, the use of proceeds from the Transaction by Fury and Fury’s intention to file certain regulatory forms.
These forward-looking statements are based on management’s current expectations and beliefs and assume, among other things, the ability of the Company to successfully pursue its current development plans, that future sources of funding will be available to the company, that relevant commodity prices will remain at levels that are economically viable for the Company and that the Company will receive relevant permits in a timely manner in order to enable its operations, but given the uncertainties, assumptions and risks, readers are cautioned not to place undue reliance on such forward-looking statements or information. The Company disclaims any obligation to update, or to publicly announce, any such statements, events or developments except as required by law.
For additional information on risks and uncertainties, see the Company’s annual information form (“AIF“) dated September 23, 2022 for the year ended December 31, 2021 available on SEDAR at www.sedar.com. The risk factors identified in the AIF are not intended to represent a complete list of factors that could affect the Company.
Neither the TSX Venture Exchange nor its Regulation Services Provider (as that term is defined in the policies of the TSX-V) accepts responsibility for the adequacy or accuracy of this news release.
Vancouver, British Columbia–(Newsfile Corp. – October 3, 2022) – Riverside Resources Inc. (TSXV: RRI) (OTCQB: RVSDF) (FSE: 5YY)(“Riverside” or the “Company”), has been reimbursed for past taxes and fees with more than USD$500,000 of new mineral exploration and consolidation work completed to-date as per the option agreement announced in May 2022 with Hochschild Mining Corp. Exploration work at La Union Project (the “Project”) has returned gold (“Au”) values greater than two ounces per ton (“oz/t”), silver (“Ag”) values over 20 oz/t and up to six percent zinc (“Zn”) (see press release dated October 6, 2021). There are four primary drill targets that were defined from 2022 exploration programs, however Minera Hochschild Mexico SA de CV (“Hochschild”) has decided not to proceed with the option and further exploration spending at La Union for corporate strategy reasons.
Riverside’s President and CEO, John-Mark Staude, commented: “We appreciate the collaboration with Hochschild and the contributions in advancing La Union. The Project has clear exploration upside and while the timing doesn’t currently work to continue with this partnership, we still see an opportunity to create significant value at La Union and will integrate all of the data and evaluate new partnership opportunities in the near future.”
Riverside is now free to move ahead with seeking other partners for the 26 km sq project located in the favorable limestone carbonate replacement (CRD) belt of western Sonora, Mexico. The Union Project displays mineralized gold-silver-zinc-lead rich mantos (tabular bodies) hosted in the Precambrian limestone strata with mineralized chimneys cutting upward into the Cambrian limestone with a surrounding halo of alteration, dolomitization, and silicification. Furthermore, the previous mining activities did not treat sulfides at the time, providing another untested mineralization style for future drilling.
The latest exploration investment helped to define the main structural and lithological controls of the mineralization which is fundamental for successful exploration of the Union district. Technical work has defined NNW-oriented subvertical structures that acted as conducts for mineralizing fluids and which interacted with thick (> 200m) highly reactive carbonate host rocks (Caborca and Arpa Formations) delineating three main CRD target areas (Figure 1).
Target 1: This area displays a mineral and alteration footprint larger than 2 x 1.5 km, with new geochemistry yielding 7 – 10g/t Au, 170 – 279 g/t Ag and Zn ranging from 1.2 – 11.6 % (Figure 1).
Target 2: New surface geochemistry in this area returned 2.5 – 7 g/t Au, up to 73 g/t Ag and 3.2 % Zn.
Target 3: is close to la Famosa Mine where the previous sampling returned ~2 oz/t Au, ~26 oz/t Ag, and > 4% Zn (Oct 6, 2021, news release).
Newly completed regional and local structural geology has been aided through stratigraphic geologic work by the Company which provides a district-wide targeting cross-section that helps for planning future drilling as shown below.
Figure 1 – New geologic map and gold assay data from rock sampling defining primary target areas and property wide N-S cross section showing the mantos and chimneys in the Precambrian-Cambrian carbonate stratigraphy.
Exploration work completed to-date includes extensive field mapping, sampling, and geochemistry. The newly mapped and sampled areas show alteration features typical of CRD targets and particularly the gossan oxidation of potential sulfide bodies at shallow depths (<100m) that remain wide open for relatively low-risk, high-potential exploration. The Company has been able to link various units into the broader stratigraphic units of the Sierra El Viejo and overall Caborca Geologic Terrane, which had previous scientific investigations, but limited CRD drill testing so far sets up the project for immediate further exploration discovery. To that effect, a first phase of drilling could include 10 drillholes to test the continuity of the gossans and target areas along the NNW corridor shown in Figure 1 above. Therefore, the Project is now nicely set up for the next exploration steps, which could include geophysics and drilling, and the Company looks forward to exploring new partnership opportunities.
Qualified Person & QA/QC: The scientific and technical data contained in this news release pertaining to the La Union Project was reviewed and approved by Julian Manco, P.Geo, a non-independent qualified person to Riverside Resources focusing on the work in Sonora, Mexico, who is responsible for ensuring that the information provided in this news release is accurate and who acts as a “qualified person” under National Instrument 43-101 Standards of Disclosure for Mineral Projects.
Rock samples from the exploration program discussed above at the La Union Project were taken to the Bureau Veritas Laboratories in Hermosillo, Mexico for fire assaying for gold. The rejects remained with Bureau Veritas in Mexico while the pulps were transported to Bureau Veritas laboratory in Vancouver, BC, Canada for 45 element ICP/ES-MS analysis using 4-acid digestion methods. A QA/QC program was implemented as part of the sampling procedures for the exploration program. Standard samples were randomly inserted into the sample stream prior to being sent to the laboratory.
About Riverside Resources Inc.: Riverside is a well-funded exploration company driven by value generation and discovery. The Company has over $4M in cash, no debt and less than 80M shares outstanding with a strong portfolio of gold-silver and copper assets and royalties in North America. Riverside has extensive experience and knowledge operating in Mexico and Canada and leverages its large database to generate a portfolio of prospective mineral properties. In addition to Riverside’s own exploration spending, the Company also strives to diversify risk by securing joint-venture and spin-out partnerships to advance multiple assets simultaneously and create more chances for discovery. Riverside has properties available for option, with information available on the Company’s website at www.rivres.com.
ON BEHALF OF RIVERSIDE RESOURCES INC.
“John-Mark Staude”
Dr. John-Mark Staude, President & CEO
For additional information contact:
John-Mark Staude President, CEO Riverside Resources Inc. info@rivres.com Phone: (778) 327-6671 Fax: (778) 327-6675 Web: www.rivres.com
Certain statements in this press release may be considered forward-looking information. These statements can be identified by the use of forward-looking terminology (e.g., “expect”,” estimates”, “intends”, “anticipates”, “believes”, “plans”). Such information involves known and unknown risks — including the availability of funds, the results of financing and exploration activities, the interpretation of exploration results and other geological data, or unanticipated costs and expenses and other risks identified by Riverside in its public securities filings that may cause actual events to differ materially from current expectations. Readers are cautioned not to place undue reliance on these forward-looking statements, which speak only as of the date of this press release.
Neither the TSX Venture Exchange nor its Regulation Services Provider (as that term is defined in the policies of the TSX Venture Exchange) accepts responsibility for the adequacy or accuracy of this release.


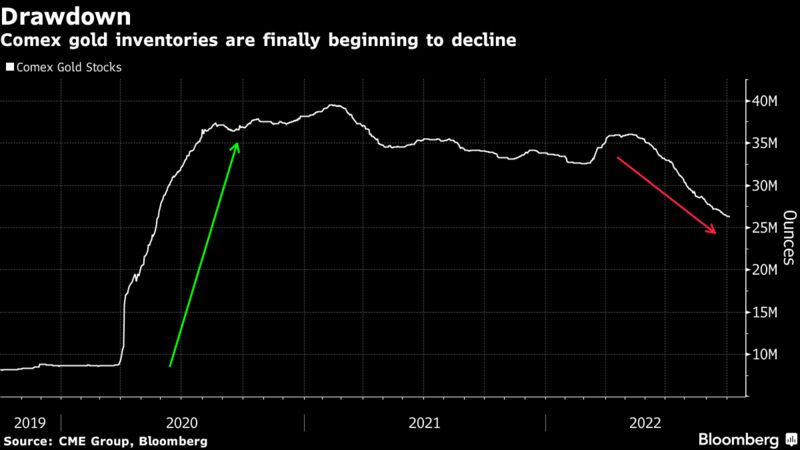


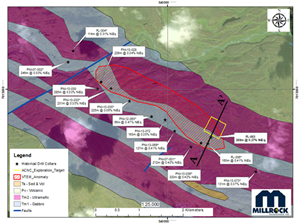
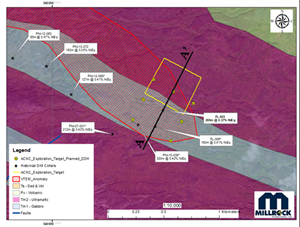


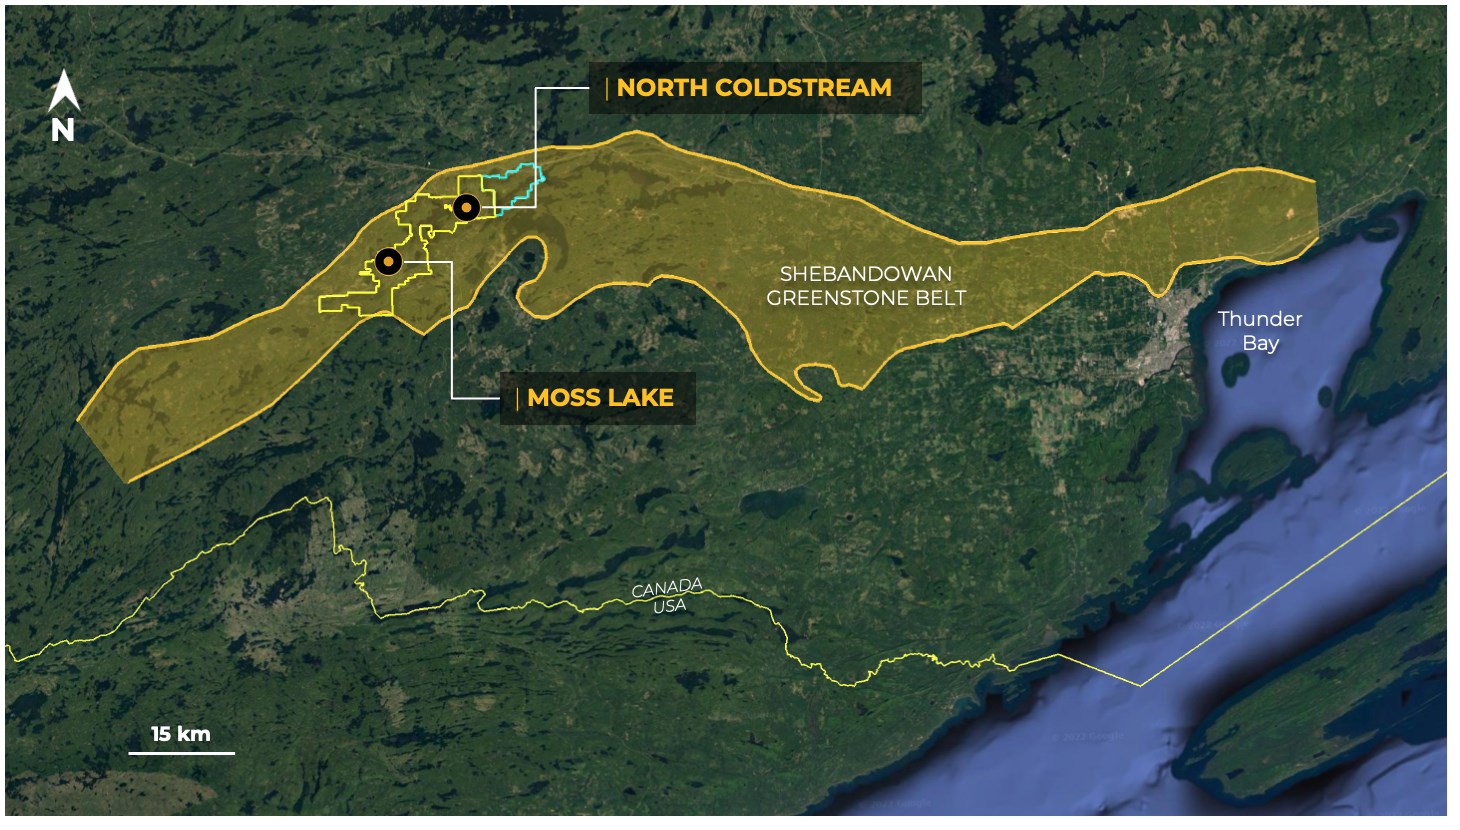


