Mr. Dean H. Taylor deant@diamcor.com 1.250.864.3326
About Diamcor 💎: Diamcor Mining Inc. is a publicly traded Canadian company with a proven history of supplying rough diamonds to the world market. Diamcor has established a long-term strategic alliance with world famous luxury retailer Tiffany & Co. and is now in the final stages of developing the Krone-Endora at Venetia Project co-located with De Beer’s flagship Venetia mine.
The U3O8 uranium spot price broke through $80 per pound, gaining 8.39% in November and is up 67.10% YTD; uranium stocks followed suit.
Uranium continues to outperform other commodities and demonstrate its strong fundamentals.
Both Western and Eastern nations made important geopolitical maneuvers in November to secure uranium supplies.
Competition for uranium supply is rapidly intensifying, driven by the increasing importance of nuclear energy and the growing awareness of an impending supply-demand gap.
COP28 was dubbed the “nuclear COP” as nuclear energy took center stage.
*Performance for periods under one year not annualized. Sources: Bloomberg and Sprott Asset Management LP. Data as of 11/30/2023. You cannot invest directly in an index. Included for illustrative purposes only. Past performance is no guarantee of future results.
Uranium’s Resurgence to a 16-Year High
The U3O8 uranium spot price gained 8.39% in November, increasing from US$74.48 to $80.73 per pound as of November 30, 2023.1 Uranium has posted a stellar 67.10% year-to-date return as of November 30, 2023, and continued to show strength and diversification relative to other commodities, which declined 9.75% (as measured by the BCOM Index).
Breaking through the $80 per pound level represents a high price for the current uranium bull market and a price level not seen in almost 16 years. Uranium’s all time high of $136 was reached in 2007 at the end of the last commodity supercycle which ended due to the 2008 Global Financial Crisis. Following the GFC, the uranium price was in a state of decline through 2016, when it reached a month-end low of $17.75 on November 30, 2016. Although November was characterized by lower inflation and favorable 2024 interest rate change expectations, which provided many asset classes with a boost, energy and metals commodity markets were largely negative, with the notable exception of uranium. This trend continues to showcase the uranium market’s economic insensitivity and diversification to major asset classes.
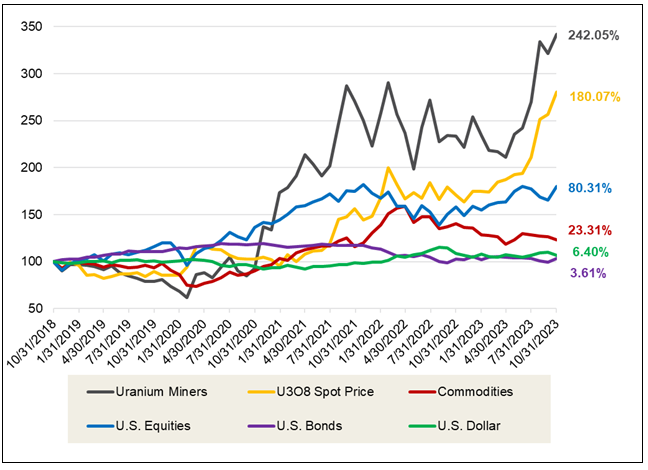
Over the longer term, physical uranium and uranium equities have demonstrated significant outperformance against broad asset classes, particularly other commodities. For the five years ended November 30, 2023, the U3O8 spot price has risen a cumulative 180.07% compared to 23.31% for the broader commodities index (BCOM), as shown in Figure 1.
Figure 1. Physical Uranium & Uranium Stocks Have Outperformed Other Asset Classes Over the Past Five Years (11/30/2018-11/30/2023)
Source: Bloomberg and Sprott Asset Management. Data as of 09/30/2023. Uranium miners are measured by the Northshore Global Uranium Mining Index (URNMX index); U.S. Equities are measured by the S&P 500 TR Index; the U308 spot price is from TradeTech; U.S. Bonds are measured by the Bloomberg Barclays US Aggregate Bond Index (LBUSTRUU); Commodities are measured by the Bloomberg Commodity Index (BCOM); and the U.S. Dollar is measured by DXY Curncy Index. Definitions of the indices are provided in the footnotes. You cannot invest directly in an index. Included for illustrative purposes only. Past performance is no guarantee of future results.
The Urgency of the Uranium Supply Race
Geopolitical uncertainty and concerns about the security of uranium supply continue to be the driving forces behind the ongoing uranium rally. Notably, French President Emmanuel Macron’s November visit to Kazakhstan marked a pivotal event. During this visit, a significant joint declaration was made to enhance trade and cooperation in the fields of nuclear energy and strategic minerals. Additionally, a crucial agreement was signed, focusing on collaboration in the nuclear fuel cycle.6 These strengthened ties between France and Kazakhstan come at a critical juncture for France, especially in light of deteriorating relations with Niger following the July coup. Niger’s military junta has publicly accused France of attempting to destabilize the country, leading to the closure of borders and heightened uncertainty surrounding France’s uranium supply from Niger. It’s worth noting that France shares a deep historical connection with Niger, having maintained control until Niger gained independence in 1960. Over the past decade, France has relied heavily on Niger for almost 20% of its uranium imports, a substantial proportion considering that Niger’s contribution to global production stands at just 4%.7,8
France & the West Move to Secure Supply…
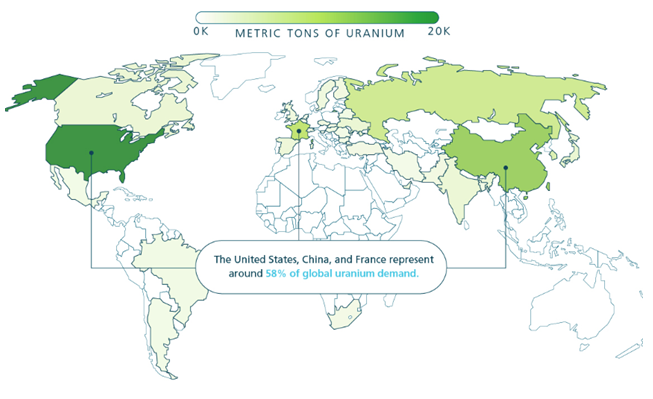
Kazakhstan and France play pivotal roles in the uranium markets, each contributing substantially to the industry. Kazakhstan, as the world’s leading uranium producer, accounts for an impressive 43% of the global mine production in 2022. On the other hand, France stands out not only as the world’s third-largest consumer of uranium, as illustrated in Figure 2, but also boasts a significant reliance on nuclear energy, which accounts for 63% of its total electricity generation. Given these vital positions, the evolving situation in Niger, coupled with an inherent supply-demand gap in the broader uranium market, has heightened the imperative for ensuring the security of supply, not just for France but for all nations reliant on uranium resources.
Western nations are particularly vulnerable due to their shift away from Russia for nuclear fuel supply services. While Russia contributed only 5% to the global uranium mine supply in 2022, it plays a more substantial role in uranium conversion and enrichment services. Consequently, Western utilities are still accepting deliveries of Russian-enriched uranium, but they are implementing self-sanctions by refraining from entering into new contracts. Moreover, legislative efforts are gaining momentum, aiming to restrict uranium imports into the United States. The Prohibiting Russian Uranium Imports Act has recently garnered approval in the U.S. House and now awaits consideration in the Senate (was passed on 12/11/2023 by U.S. House of Representatives). Time is limited for its passage within the current year. If the act is ratified, it will lead to a ban on Russian uranium imports 90 days after its enactment, while allowing for temporary waivers until 2028.9
…Along with Russia and China
Eastern nations are also actively pursuing the assurance of a stable uranium supply. While Russia does engage in uranium mining, its domestic production falls short of meeting its extensive demands to fuel both domestic and Russian-built reactors in various countries. Consequently, Russia also uses its southern neighbor, Kazakhstan, for access to uranium resources. In a reciprocal effort, following French President Emmanuel Macron’s visit to Kazakhstan, Russian President Vladimir Putin embarked on a visit to further strengthen Russian-Kazakh relations just one week later.10 These diplomatic overtures align with China’s President Xi Jinping’s visit to Kazakhstan in October, where he emphasized the need for increased cooperation.11
China stands out with the second-largest uranium reactor requirements globally and ambitious nuclear expansion plans, currently overseeing the construction and planning of 68 reactors, compared to the 55 already operational. Given the scale of both current and anticipated future demand, China is deeply committed to securing its uranium supply for the long term. Leveraging its historical capability to invest significantly in commodity supply chains well in advance of actual requirements, it is likely that a substantial portion of Kazakh supply, including the announced capacity increases to 100% by 2025, will primarily flow into China. As a notable illustration, the China National Uranium Corporation is presently expanding its storage capacity at its warehouse along the Kazakhstan-China border, increasing it from 3,000 tU to 20,000 tU—almost double China’s anticipated annual reactor requirements for 2023.12
The competition for uranium supply is rapidly intensifying, driven by the increasing importance of nuclear energy and the growing awareness of an impending supply-demand gap. This situation has been exacerbated by the fact that mine supply has consistently lagged behind reactor requirements for more than a decade. To bridge this gap, the industry has been compelled to depend on secondary sources, mainly utility inventories through either direct sales or, more notably, inventory drawdowns. We firmly believe that the era of destocking has come to an end, and the supply-demand deficit appears poised to endure. This scenario is likely to provide ample room for the uranium bull market to flourish.
Figure 2. Uranium Demand for Nuclear Power
Source: World Nuclear Association, November 2023. Included for illustrative purposes only. Past performance is no guarantee of future results.
The “Nuclear COP”
Nuclear energy sentiment and international collaboration were abundant in the United Nations COP28 (Conference of the Parties). COP28 took place this month, eight years after the signing of the Paris Agreement, and saw world leaders convene to discuss their collective commitments to limit global warming to below 2, preferably to 1.5 degrees, Celsius compared to pre-industrial levels.
During COP28, more than 20 nations, including the United States, France, Japan and the UK, made a significant commitment to triple global nuclear energy generation by 2050.13 COP28 was held in the United Arab Emirates, and amidst reports of geopolitical disagreements affecting discussions on fossil fuels, nuclear energy took center stage as a pivotal point of collaboration during the conference. Some even referred to this event as the “nuclear COP,” underscoring its newfound prominence on the international stage. This represents a substantial acceleration in the global sentiment towards nuclear energy. In contrast, at COP27 the previous year, the most concrete nuclear-related developments were limited to altering the agreement’s language to prioritize “low-emission” energy sources rather than solely “renewables.” Additionally, it marked the first time nuclear energy was even considered in the conversation, a significant shift from its exclusion at COP26.
Nuclear energy has undeniably experienced a boost in favor, as governments worldwide come to recognize the imperative of dependable baseload power to counterbalance the intermittent nature of renewable energy sources. A noteworthy advantage of nuclear energy lies in its capacity factor, which stands at an impressive 93%. This metric represents the ratio of the total energy generated over a specific period to what the plant would have produced at full capacity. By comparison, renewables like solar and wind lag behind, with capacity factors of 25% and 36%, respectively.
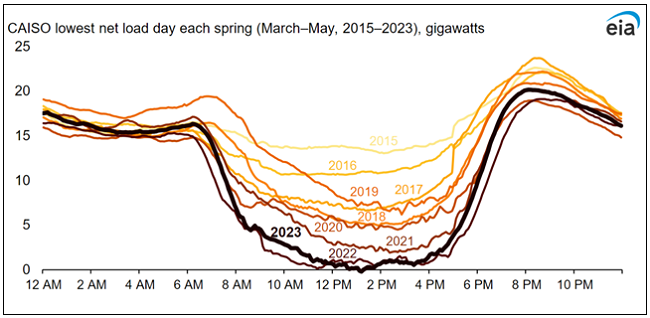
Moreover, the growing investment in solar energy by numerous nations has underscored the critical importance of reliable power supply. This need becomes even more pronounced when considering that peak electricity demand frequently occurs after sunset when solar power becomes unavailable. This phenomenon is exemplified by California’s duck curve, a graph depicting the growing gap between electricity supply and demand as the sun sets, emphasizing the urgency of securing stable energy sources.
Figure 3. California’s Duck Curve Is Getting Deeper
Uranium miners ascended in tandem with the U3O8 uranium spot price, with the broad sector of uranium miners rising by 6.31%2 and junior uranium miners gaining 7.47%.3
As the price of uranium has increased significantly, uranium mine projects are starting to come online. Restarts, projects that had been producing uranium and then stopped and put on care and maintenance, have been the logical start to a supply response.
In November, enCore Energy Corp. (enCore) announced the successful startup of uranium production at its Rosita plant.14 enCore also plans to restart its Alta Mesa plant in early 2024. These restarts are both located in Texas and should help to start the revival of the U.S.’s domestic uranium production.
Though restarts such as enCore’s and Boss Energy Ltd.’s Honeymoon project (see last month’s commentary) are critical to helping address the uranium market’s supply-demand deficit, new builds will also be needed for this endeavor. New builds take many years to both develop and go through the permitting process, and total lead times can take 10 to 15 years.15
NexGen Energy Ltd. (Nexgen) is a uranium developer focused on the Rook 1 Project located in the Athabasca Basin of Saskatchewan, Canada. In November, Nexgen announced it had received a major milestone with Saskatchewan’s environmental approval for its Rook 1 project.16 The 98,739 tU indicated mineral resources Rook 1 Project next step in the permitting process is for federal approval. This marks a further significant development as even though the Athabasca Basin is a large source of high-grade uranium, this Rook 1 environmental approval is the first in more than 20 years.
Global Atomic Corporation (Global Atomic) released an update on its Dasa project in Niger. In August, the coup d’état in Niger forced Global Atomic to announce delays of 6-12 months in the first production at Dasa to end of 2025.17 In November, their update on the situation in Niger seemed to help soothe investor concerns as the stock jumped and outperformed peers. In this update, the Global Atomic President and CEO noted, “Further to our Q2 2023 update regarding the Republic of Niger, a transition government is in place and includes a new Prime Minister and Cabinet, as well as the previous experienced staff in the Government Ministries. The Government of Niger is a 20% owner of the Dasa Project and recognizes that the Dasa Mine will benefit the Republic of Niger by generating royalty and tax revenue, creating new jobs and opportunities for local business and revitalize the northern region of the country. The Government has offered its positive support for the development of the Dasa Project.” 18
A Concerning Supply Deficit
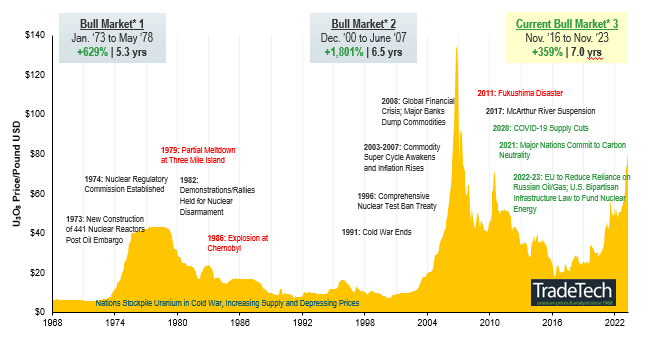
As global uranium mine production consistently falls short of the world’s burgeoning uranium reactor demands, a concerning supply deficit is projected to materialize over the next decade. This deficit is further exacerbated by a decade of insufficient investment in supply infrastructure. Additionally, the prospects for future supply are hindered by extended lead times and substantial capital requirements. Consequently, we deem the reactivation of dormant mines and the development of new ones as absolutely critical. The uranium price target as an incentive for reviving existing mines and initiating greenfield projects is a moving target. Our assessment suggests that achieving higher uranium prices will be necessary to stimulate sufficient production and bridge the forecasted deficits. Looking ahead, the persistent growth in demand amid an uncertain uranium supply landscape is expected to bolster a sustained bullish market trend, as depicted in Figure 4.
Note: A “bull market” refers to a condition of financial markets where prices are generally rising. A “bear market” refers to a condition of financial markets where prices are generally falling. Source: TradeTech Data as of 11/30/2023. TradeTech is the leading independent provider of uranium prices and nuclear fuel market information. The uranium prices in this chart dating back to 1968 is sourced exclusively from TradeTech; visit https://www.uranium.info/. Included for illustrative purposes only. Past performance is no guarantee of future results.
Footnotes
1
The U3O8 uranium spot price is measured by a proprietary composite of U3O8 spot prices from UxC, S&P Platts and Numerco.
2
The North Shore Global Uranium Mining Index (URNMX) was created by North Shore Indices, Inc. (the “Index Provider”). The Index Provider developed the methodology for determining the securities to be included in the Index and is responsible for the ongoing maintenance of the Index. The Index is calculated by Indxx, LLC, which is not affiliated with the North Shore Global Uranium Miners Fund (“Existing Fund”), ALPS Advisors, Inc. (the “Sub-Adviser”) or Sprott Asset Management LP (the “Adviser”).
3
The Nasdaq Sprott Junior Uranium Miners™ Index (NSURNJ™) was co-developed by Nasdaq® (the “Index Provider”) and Sprott Asset Management LP (the “Adviser”). The Index Provider and Adviser co-developed the methodology for determining the securities to be included in the Index and the Index Provider is responsible for the ongoing maintenance of the Index.
4
The Bloomberg Commodity Index (BCOM) is a broadly diversified commodity price index that tracks prices of futures contracts on physical commodities, and is designed to minimize concentration in any one commodity or sector. It currently has 23 commodity futures in six sectors.
5
The S&P 500 or Standard & Poor’s 500 Index is a market-capitalization-weighted index of the 500 largest U.S. publicly traded companies.
Past performance is no guarantee of future results. You cannot invest directly in an index. Investments, commentary and statements are that of the author and may not be reflective of investments and commentary in other strategies managed by Sprott Asset Management USA, Inc., Sprott Asset Management LP, Sprott Inc., or any other Sprott entity or affiliate. Opinions expressed in this commentary are those of the author and may vary widely from opinions of other Sprott affiliated Portfolio Managers or investment professionals.
This content may not be reproduced in any form, or referred to in any other publication, without acknowledgment that it was produced by Sprott Asset Management LP and a reference to sprott.com. The opinions, estimates and projections (“information”) contained within this content are solely those of Sprott Asset Management LP (“SAM LP”) and are subject to change without notice. SAM LP makes every effort to ensure that the information has been derived from sources believed to be reliable and accurate. However, SAM LP assumes no responsibility for any losses or damages, whether direct or indirect, which arise out of the use of this information. SAM LP is not under any obligation to update or keep current the information contained herein. The information should not be regarded by recipients as a substitute for the exercise of their own judgment. Please contact your own personal advisor on your particular circumstances. Views expressed regarding a particular company, security, industry or market sector should not be considered an indication of trading intent of any investment funds managed by Sprott Asset Management LP. These views are not to be considered as investment advice nor should they be considered a recommendation to buy or sell. SAM LP and/or its affiliates may collectively beneficially own/control 1% or more of any class of the equity securities of the issuers mentioned in this report. SAM LP and/or its affiliates may hold a short position in any class of the equity securities of the issuers mentioned in this report. During the preceding 12 months, SAM LP and/or its affiliates may have received remuneration other than normal course investment advisory or trade execution services from the issuers mentioned in this report.
The information contained herein does not constitute an offer or solicitation to anyone in the United States or in any other jurisdiction in which such an offer or solicitation is not authorized or to any person to whom it is unlawful to make such an offer or solicitation. Prospective investors who are not residents of Canada or the United States should contact their financial advisor to determine whether securities of the Funds may be lawfully sold in their jurisdiction.
The information provided is general in nature and is provided with the understanding that it may not be relied upon as, or considered to be, the rendering of tax, legal, accounting or professional advice. Readers should consult with their own accountants and/or lawyers for advice on their specific circumstances before taking any action.
Vancouver, British Columbia–(Newsfile Corp. – December 20, 2023) – Dolly Varden Silver Corporation (TSXV: DV) (OTCQX: DOLLF) (the “Company” or “Dolly Varden”) has entered into an assignment and assumption agreement (the “Assignment Agreement”) with Libero Copper & Gold Corporation (“Libero”) pursuant to which Dolly Varden has acquired (the “Acquisition”) from Libero an option agreement (the “Option Agreement”) entitling Dolly Varden, subject to certain conditions, to earn-in a 100% undivided interest in the southern portion of the Big Bulk Project from Libero thus consolidating the entire copper-gold porphyry system. The Libero property, also known as the Big Bulk Property (the “Big Bulk Property”), is comprised of seven mineral claims making up 3,025Ha in the Golden Triangle, British Columbia. Pursuant to the Assignment Agreement, as consideration, the Company has agreed to issue Libero 275,000 common shares of the Company (the “Consideration Shares”).
Agreement Highlights
Consolidation of the Big Bulk copper-gold mineralized calc-alkali porphyry system of the Texas Creek plutonic suite (“Big Bulk”).
Historic data sets will be incorporated into a complete geologic model.
Existing Land Use Agreement and Exploration Permit in place.
“We have been continuing to seek accretive consolidation opportunities in the area and the amalgamation of the southern portion of the Big Bulk copper gold porphyry with Dolly Varden’s portion is our latest step,” said Shawn Khunkhun, President and CEO of Dolly Varden. “In the Golden Triangle, porphyry systems can represent metallogenic feeders to high-grade vein systems, such as the KSM Deposit that occurs adjacent to the Brucejack Mine. Big Bulk may represent a causative mineralized porphyry to the high-grade silver and gold deposits 10 kilometres to the west at the Kitsault Valley Trend.”
About The Big Bulk Porphyry System
Big Bulk is located 20 kilometres north of the town of Kitsault, BC, and is surrounded by Hecla Mining’s Kinskuch project (Figure 1). The Big Bulk porphyry copper-gold system hosts multiple phases of intrusive rocks, hosted in Lower Jurassic-age Hazelton and Triassic-age Stuhini volcanic and sedimentary rocks analogous (Figure 2). Recent work by the British Columbia Geological Survey (“BCGS”) and University of British Columbia (“UBC”) Mineral Deposits Research Unit (“MDRU”) indicate that Big Bulk is the northernmost porphyry of a string of several porphyry mineralized systems of multiple geologic ages that extend 30km south to the New Moly LLC’s Eocene-age Kitsault molybdenum deposit.
The southern portion of the Big Bulk Property was initially explored by Teck and Canadian Empire Minerals from 2001 to 2003. The northern half of the system was drilled by AngloGold in 2009, encountering porphyry-style alteration with copper and gold mineralization associated with quartz chalcopyrite/pyrite stockwork veins.
A new interpretation of the geology based on recent geologic mapping by the BCGS indicates that the target is a much larger calc-alkaline porphyry system tilted on its side with similarities in age and structural setting to the Kerr-Sulpherets-Mitchell (KSM) deposits. The work by UBC-MDRU (2018) places the Big Bulk intrusive along a regional structural trend that hosts numerous porphyry and epigenetic deposits. Within the Big Bulk porphyry system, higher grade mineralization occurs in a discreet mineralized phases that had not been targeted by previous operators.
Libero’s 2021 drill program at Big Bulk tested the new geological model focusing on a quartz-chalcopyrite veined hornblende diorite intrusive phase of the Texas Creek plutonic Suite that was intersected in multiple holes.
The Acquisition
The Acquisition is being completed pursuant to the Assignment Agreement. Dolly Varden has agreed to issue the Consideration Shares to Libero at a deemed value of $0.78 per Consideration Share (being the closing price of the Common Shares on the TSX Venture Exchange (the “TSXV”) on December 15, 2023) for an aggregate consideration of $214,500.
Issuance of the Common Shares remains subject to TSXV approval and other customary conditions and is currently expected to occur on or about December 22, 2023. The Company has agreed to use commercially reasonable efforts to promptly make all filings and take all necessary actions required to effect the Acquisition, including the issuances of the Consideration Shares. The Company intends to file a prospectus supplement to its base shelf prospectus dated April 25, 2023 to qualify the distribution of the Consideration Shares to Libero.
The Option Agreement
In connection with the Acquisition, Dolly Varden also entered into an amending agreement with LCT Holdings Inc., the owner of the Big Bulk Property and optionor under the Option Agreement. The amended Option Agreement provides that Dolly Varden may earn-in a 100% undivided interest in the Big Bulk Property by completing the following payments:
a) $50,000 in cash on or before December 31, 2023;
b) $150,000 in cash on or before December 31, 2024;
c) $250,000 in cash or common shares on or before December 31, 2025;
d) $500,000 in cash or common shares on or before December 31, 2026; and
e) $500,000 in cash or common shares on or before December 31, 2027.
Any common shares issued by Dolly Varden under the Option Agreement, as amended, will be issued at a deemed price equal to the ten day volume weighted average price of the Dolly Varden common shares on the TSXV, subject to minimum pricing rules on the TSXV. The Option Agreement gives Dolly Varden the option to accelerate the payments described above.
Figure 1. Dolly Varden Silver’s Consolidated Big Bulk Project Location, Kitsault Valley, Northwest BC
Rob van Egmond, P.Geo., Vice-President Exploration for Dolly Varden Silver, the “Qualified Person” as defined by NI43-101 has reviewed, validated and approved the scientific and technical information contained in this news release and supervises the ongoing exploration program for Dolly Varden on the Kitsault Valley Project and the Big Bulk Project.
About Dolly Varden Silver Corporation
Dolly Varden Silver Corporation is a mineral exploration company focused on advancing its 100% held Kitsault Valley Project (which combines the Dolly Varden Project and the Homestake Ridge Project) located in the Golden Triangle of British Columbia, Canada, 25kms by road to tide water. The 163 sq. km. project hosts the high-grade silver and gold resources of Dolly Varden and Homestake Ridge along with the past producing Dolly Varden and Torbrit silver mines. It is considered to be prospective for hosting further precious metal deposits, being on the same structural and stratigraphic belts that host numerous other, high-grade deposits, such as Eskay Creek and Brucejack. The Kitsault Valley Project also contains the Big Bulk property which is prospective for porphyry and skarn style copper and gold mineralization, similar to other such deposits in the region (Red Mountain, KSM, Red Chris).
Forward-Looking Statements
This release may contain forward-looking statements or forward-looking information under applicable Canadian securities legislation that may not be based on historical fact, including, without limitation, statements containing the words “believe”, “may”, “plan”, “will”, “estimate”, “continue”, “anticipate”, “intend”, “expect”, “potential”, and similar expressions. Forward-looking statements involve known and unknown risks, uncertainties, and other factors which may cause the actual results, performance, or achievements of Dolly Varden to be materially different from any future results, performance, or achievements expressed or implied by the forward-looking statements. Forward-looking statements or information in this release relates to, among other things, the anticipate closing of the Acquisition, the planned filing of a prospectus supplement, the potential benefits of the Acquisition and other statements that are not historical facts.
These forward-looking statements are based on management’s current expectations and beliefs and assume, among other things, the ability of the Company to successfully pursue its current development plans, that future sources of funding will be available to the company, that relevant commodity prices will remain at levels that are economically viable for the Company and that the Company will receive relevant permits in a timely manner in order to enable its operations, but given the uncertainties, assumptions and risks, readers are cautioned not to place undue reliance on such forward-looking statements or information. The Company disclaims any obligation to update, or to publicly announce, any such statements, events or developments except as required by law.
For additional information on risks and uncertainties, see the Company’s annual information form dated April 11, 2023 for the year ended December 31, 2022 and the Company’s base-shelf prospectus dated April 25, 2023, both available on SEDAR+ at www.sedarplus.ca.
Neither the TSX Venture Exchange nor its Regulation Services Provider (as that term is defined in the policies of the TSX-V) accepts responsibility for the adequacy or accuracy of this news release.
Vancouver, British Columbia–(Newsfile Corp. – December 20, 2023) – Riverside Resources Inc.(TSXV: RRI) (OTCQB: RVSDF) (FSE: 5YY) (“Riverside” or the “Company”), is pleased to report on rock sampling and fieldwork from the Cecilia Gold-Silver Project (the “Project”) in Sonora, Mexico. The results fit within the larger context of a district scale gold-silver composite dome system with superimposed gold-rich veins. Past drilling by Riverside intercepted high-grade gold in 4 of the 7 holes and this sampling over new areas, doubles the strike of the defined mineralization footprint This large footprint is consistent with other rhyolite dome gold systems including those in New Mexico like Mogollon and in Sonora like at La India mine of Agnico Eagle.
Key Highlights:
34 rock samples were collected at the primary targets.
22 samples in the main target “Cerro Magallanes” confirming Au grades up 7.3 g/t Au and Ag > 100 g/t.
Five (5) primary structural trends were identified with field data and historic geochemical data reprocessing.
Updated drilling permits, valid for the next several years, have been obtained along with signed agreements for surface access over the targets.
Riverside collected rock chip samples from selective areas along 0.8 km length in the Magallanes Target area that returned gold values in assays up to 7.3 g/t Au and 144 g/t Ag (Figure 1A., Table 1). The sampling confirms the consistent Au grades obtained in past surface workings and diamond core drilling that includes 24.2m @1.51 g/t Au in CED21-005 by the Company. The mapping and exploration activities combined with data reprocessing allows the company geologists to define the main structural trends (Agua Prieta, San Jose, North Breccia, Central and East trends) that are the main mineral corridors (Figure 2). The structural trends are interpreted as the surface expression of a rooted rhyolite dome system where higher grades lie at the base of the hill (Figure 1B). The geochemical data obtained, and the geologic mapping are helpful to refine the geological model for the deposit type and target delineation for the next drill program planned for 2024.
Figure 1. A. Plan view map of the Magallanes Target with some of the new geochemical sampling done recently and the defined structural trends. B. Schematic cross-section interpreting the convergence of the structural trends into the root of a mineralized rhyolite composite dome system (like those found at Yanacocha, Peru and San Julian, Mexico).
Table 1: Selected assay results from Riverside’s recent sampling at Cecilia.
Area
East
North
Elevation
Sample Type
Au_g/t
Ag_g/t
Cerro Magallanes
612215
3436934
1779
selected
7.3
144
Cerro Magallanes
611598
3436932
2165
selected
6.18
9.21
Cerro Magallanes
612362
3437066
1711
dump
3.87
38.7
Cerro Magallanes
611469
3436911
2167
chip
2.64
1.33
Cerro Magallanes
611425
3436898
2133
chip
2.08
2.3
Cerro Magallanes
611935
3436954
1936
chip
1.86
12.65
La Cruz
615365
3438484
1431
chip
1.63
3.29
Figure 2. North-looking oblique aerial photograph of the Magallanes Dome Complex with different targets. The dashed red lines indicate the trends that control -mineralization and that are interpreted to be rooted in the central portion of the dome creating the next focused drill targeting.
The Cecilia project consists of six mineral concessions, collectively covering over 77 sq km (7,739 hectares) in size, thus a large district covered by the Company. The Project is located 40 kilometers southwest of the Agua Prieta border between Mexico and the USA, and 50 kilometers east of Mexico’s largest mining complex, Cananea copper mining complex producing the largest amount of copper in Mexico.
In the Cecilia Project, the rhyolitic tuffs and dome complex units intrude and unconformably overlie a sequence of marine clastic sedimentary rocks consisting of interbedded siltstone and sandstone of the Cretaceous Cabullona Group which hosts gold mineralization in other portions of northern Sonora as well as here at Cecilia. The age of the mineralization obtained by Riverside yielded ca. 18 Ma using U-Pb in zircons in syn-volcanic mineralized rhyolite flow dome in the top of the sequence. This age for mineralization tied to magmatism has also been reported in large Au camps in Arizona (e.g. Oatman area, DeWitt et al.,1986).
Riverside work in the district has developed additional targets including the Cruz 1, Cruz 2, Cruz 3, Casa de Piedra, Los Llanos, and Magallancito targets (Figure 3). These targets represent different levels of exposure and make the Cecilia project a potential district for multiple gold discoveries.
Figure 3. Map of the district by Riverside with areas of clustering with gold mineralization and targets shown. Stratigraphic column with targets in stars for location in the stratigraphy similar to other major rhyolite dome districts where multiple targets in diverse structural settings.
The scientific and technical data contained in this news release pertaining to the Cecilia Project was reviewed and approved by Julian Manco, P.Geo, a non-independent qualified person to Riverside Resources focusing on the work in Sonora, Mexico, who is responsible for ensuring that the information provided in this news release is accurate and who acts as a “qualified person” under National Instrument 43-101 Standards of Disclosure for Mineral Projects.
Rock samples from the exploration program discussed above at Cecilia were taken to the Bureau Veritas Laboratories in Hermosillo, Mexico for fire assaying for gold. The rejects remained with Bureau Veritas in Mexico while the pulps were transported to Bureau Veritas laboratory in Vancouver, BC, Canada for 45 element ICP/ES-MS analysis. A QA/QC program was implemented as part of the sampling procedures for the exploration program. Standard samples were randomly inserted into the sample stream prior to being sent to the laboratory.
About Riverside Resources Inc.:
Riverside is a well-funded exploration company driven by value generation and discovery. The Company has over $6M in cash, no debt, and less than 75M shares outstanding with a strong portfolio of gold-silver and copper assets and royalties in North America. Riverside has extensive experience and knowledge operating in Mexico and Canada and leverages its large database to generate a portfolio of prospective mineral properties. In addition to Riverside’s exploration spending, the Company also strives to diversify risk by securing joint-venture and spin-out partnerships to advance multiple assets simultaneously and create more chances for discovery. Riverside has properties available for option, with information available on the Company’s website at www.rivres.com.
ON BEHALF OF RIVERSIDE RESOURCES INC.
“John-Mark Staude”
Dr. John-Mark Staude, President & CEO
For additional information contact:
John-Mark Staude President, CEO Riverside Resources Inc. info@rivres.com Phone: (778) 327-6671 Fax: (778) 327-6675 Web: www.rivres.com
Certain statements in this press release may be considered forward-looking information. These statements can be identified by the use of forward-looking terminology (e.g., “expect”,” estimates”, “intends”, “anticipates”, “believes”, “plans”). Such information involves known and unknown risks — including the availability of funds, the results of financing and exploration activities, the interpretation of exploration results and other geological data, or unanticipated costs and expenses and other risks identified by Riverside in its public securities filings that may cause actual events to differ materially from current expectations. Readers are cautioned not to place undue reliance on these forward-looking statements, which speak only as of the date of this press release.
Neither the TSX Venture Exchange nor its Regulation Services Provider (as that term is defined in the policies of the TSX Venture Exchange) accepts responsibility for the adequacy or accuracy of this release.
Vancouver, British Columbia–(Newsfile Corp. – December 19, 2023) – EMX Royalty Corporation (NYSE American: EMX) (TSXV: EMX) (FSE: 6E9) (the “Company” or “EMX“) is pleased to announce the early repayment of US$10 million toward the principal amount of the Senior Secured Credit Facility (the “Sprott Credit Facility”) held by a fund managed by Sprott Resource Lending Corp. The remaining principal amount of US$34.7 million of the Sprott Credit Facility is due to be repaid by December 31, 2024. For additional information related to the Sprott Credit Facility refer to news release dated July 29, 2021, August 17, 2021, October 21, 2021, and January 25, 2022.
About EMX. EMX is a precious, base and battery metals royalty company. EMX’s investors are provided with discovery, development, and commodity price optionality, while limiting exposure to risks inherent to operating companies. The Company’s common shares are listed on the NYSE American Exchange and TSX Venture Exchange under the symbol “EMX”, and also trade on the Frankfurt exchange under the symbol “6E9”. Please see www.EMXroyalty.com for more information.
Neither the TSX Venture Exchange nor its Regulation Services Provider (as that term is defined in policies of the TSX Venture Exchange) accepts responsibility for the adequacy or accuracy of this release
Forward-Looking Statements
This news release may contain “forward looking statements” that reflect the Company’s current expectations and projections about its future results. These forward-looking statements may include statements regarding perceived merit of properties, exploration results and budgets, mineral reserves and resource estimates, work programs, capital expenditures, timelines, strategic plans, market prices for precious and base metal, or other statements that are not statements of fact. When used in this news release, words such as “estimate,” “intend,” “expect,” “anticipate,” “will”, “believe”, “potential” and similar expressions are intended to identify forward-looking statements, which, by their very nature, are not guarantees of the Company’s future operational or financial performance, and are subject to risks and uncertainties and other factors that could cause the Company’s actual results, performance, prospects or opportunities to differ materially from those expressed in, or implied by, these forward-looking statements. These risks, uncertainties and factors may include, but are not limited to unavailability of financing, failure to identify commercially viable mineral reserves, fluctuations in the market valuation for commodities, difficulties in obtaining required approvals for the development of a mineral project, increased regulatory compliance costs, expectations of project funding by joint venture partners and other factors.
Readers are cautioned not to place undue reliance on these forward-looking statements, which speak only as of the date of this news release or as of the date otherwise specifically indicated herein. Due to risks and uncertainties, including the risks and uncertainties identified in this news release, and other risk factors and forward-looking statements listed in the Company’s MD&A for the quarter ended September 30, 2022 (the “MD&A”), and themost recently filed Annual Information Form (“AIF”) for the year ended December 31, 2021, actual events may differ materially from current expectations. More information about the Company, including the MD&A, the AIF and financial statements of the Company, is available on SEDAR at www.sedarplus.ca and on the SEC’s EDGAR website at www.sec.gov
Ottawa, Ontario–(Newsfile Corp. – December 19, 2023) – Gold79 Mines Ltd. (TSXV: AUU) (OTCQB: AUSVF) (“Gold79” or the “Company”) is pleased to provide an update on the permitting process at its Jefferson Canyon project, in Nevada.
The original Plan of Operations for Jefferson Canyon was submitted in July 2021 and the cultural and biological studies were completed and submitted in Q2 2022. Gold79 received feedback on the proposed areas of disturbance relative to identified cultural sites in March 2023. After multiple revisions to the plan it was resubmitted on December 12, 2023. The revised application is for 20 drill sites and associated roads to service them.
Derek Macpherson, President and CEO of Gold79, states, “The permitting process at Jefferson Canyon has taken far longer than originally anticipated. While this has been a frustratingly long process for both Company shareholders and management, the recent progress provides us a positive view that the permitting process may be completed in-time for the 2024 exploration season.”
The Jefferson Canyon project in Nye County, Nevada is located 7 kilometres from Kinross’s Round Mountain operations. The project has 145 historical drill holes, including 41.2m at 6.4 g/t gold and 402 g/t silver (GJ-81). In 2022, Gold79 entered into an Exploration and Option agreement with Kinross. Kinross has made all the required payments associated with the agreement to date and has been working with Gold79 on completing the permitting process.
Corporate Update
The Company has granted incentive stock options to a director of the Company to purchase up to 300,000 common shares of the Company pursuant to the Company’s stock option plan. The options have a five-year term to expiry and are exercisable at $0.05 per share.
Qualified Person / Quality Control and Quality Assurance
Robert Johansing, M.Sc. Econ. Geol., P. Geo., the Company’s Vice President, Exploration is a qualified person (“QP”) as defined by NI 43-101 and has reviewed and approved the technical content of this press release.
About Gold79 Mines Ltd.
Gold79 Mines Ltd. is a TSX Venture listed company focused on building ounces in the Southwest USA. Gold79 holds 100% earn-in option to purchase agreements on three gold projects: the Jefferson Canyon Gold Project and the Tip Top Gold Project both located in Nevada, USA, and, the Gold Chain Project located in Arizona, USA. In addition, Gold79 holds a 32.3% interest in the Greyhound Project, Nunavut, Canada under JV by Agnico Eagle Mines Limited.
For further information regarding this press release contact: Derek Macpherson, President & CEO Phone: 416-294-6713 Email: dm@gold79mines.com Website: www.gold79mines.com.
This press release may contain forward-looking statements that are made as of the date hereof and are based on current expectations, forecasts and assumptions which involve risks and uncertainties associated with our business including any proposed private placement or any future private placements, the uncertainty as to whether further exploration will result in the target(s) being delineated as a mineral resource, capital expenditures, operating costs, mineral resources, recovery rates, grades and prices, estimated goals, expansion and growth of the business and operations, plans and references to the Company’s future successes with its business and the economic environment in which the business operates. All such statements are made pursuant to the ‘safe harbour’ provisions of, and are intended to be forward-looking statements under, applicable Canadian securities legislation. Any statements contained herein that are statements of historical facts may be deemed to be forward-looking statements. By their nature, forward-looking statements require us to make assumptions and are subject to inherent risks and uncertainties. We caution readers of this news release not to place undue reliance on our forward-looking statements as a number of factors could cause actual results or conditions to differ materially from current expectations. Please refer to the risks set forth in the Company’s most recent annual MD&A and the Company’s continuous disclosure documents that can be found on SEDAR+ at www.sedarplus.ca. Gold79 does not intend, and disclaims any obligation, except as required by law, to update or revise any forward-looking statements whether as a result of new information, future events or otherwise.
Neither the TSX Venture Exchange nor its Regulation Services Provider (as that term is defined in the policies of the TSX Venture Exchange) accepts responsibility for the adequacy or accuracy of this release.
VANCOUVER, BC / ACCESSWIRE / December 18, 2023 / Rover Metals Corp. (TSXV:ROVR)(OTCQB:ROVMF)(FSE:4XO) (“Rover” or the “Company“) is pleased to announce that it has submitted its Plan of Operations (the “Plan”) permit application for its Let’s Go Lithium (“LGL”) project to the Bureau of Land Management, Nevada division.
The LGL project is a claystone sedimentary lithium project located in a flat playa in an ancient volcanic lakebed. The claim block, which is approximately 8,300 acres in size, includes several limestone-capped butte-like outcrop formations. As released on September 7, 2023, a successful Phase 1 surface sampling program has returned multiple high-grade surface lithium samples. The clay body, as it’s known today, is believed to have very little overburden, and at the southern boundary of the project the lithium rich clay is exposed at the surface, or above surface in butte outcrops. Project infrastructure includes hydro power lines on site, direct road access, access to the Union Pacific rail line, and the nearby town of Pahrump with a readily available work force.
The project is located within the prolific southwest Nevada claystone lithium jurisdiction. LGL is located just 12 km away from the historic Franklin Wells hectorite (a rare lithium smectite mineral) deposit. Mining at Franklin Wells dates back to the 1920’s. The regional geology of the Amargosa Valley is a basin-and-range structure with the Greenwater Range and Funeral Mountains to the west and the Amargosa Desert to the east. The Greenwater/Funeral mountains are fault-controlled with narrow interior valleys and are bounded by broad, coalescing alluvial fans. The Greenwater/Funeral mountains are composed of lower Paleozoic marine and metamorphic rocks. LGL is located in a large basin of clay rich Tertiary lakebed sediments, the major host rock for the other lithium claystone deposits in the southwest Nevada lithium jurisdiction. Lhoist North America has been open pit mining the specialty clays in the area since 1974.
Later-stage company comparable claystone lithium projects in southwest Nevada include Century Lithium Corp.’s Clayton Valley project; American Lithium’s TLC project; Noram Lithium’s Zeus project, and Nevada Lithium’s Bonnie Claire project. All of the aforementioned companies are later-stage mining companies, with a NI 43-101 resource calculation.
LGL Plan
Rover has been working with UES since August 2023 on the Plan. An integral part of the Plan, is the water table flow model, developed by UES’ Principal Hydrologist – Dwight Smith PE, PG, CHg, and team. The Company, through UES, is expecting to start baseline environmental surveys in the early spring of 2024.
Judson Culter, CEO at Rover Metals, states, “The Plan was developed to ensure that there will be no impact to the critical water tables and sensitive biological resources in the Amargosa basin. Dwight Smith has over 20 years of hydrogeology experience working in the Amargosa basin. Rover and UES have obtained a copy of the Plan of Operations and Environmental Assessment study that the neighbouring mine, operated by Lhoist North America, is operating under. Lhoist has been mining in the area for over 50 years, and their Plan of Operations was most recently updated in 1992. Management at Rover, and UES, feel confident that sustainable lithium mining can be supported in the Amargosa Valley.“
A Call for Battery Recycling Partnerships and Joint Ventures
Management of the company will continue their outreach efforts, with assistance from the Nevada State Governor’s Office, to explore partnerships with the Las Vegas-based battery recycling community in H1 of 2024. The eastern Amargosa Valley has been slated for solar farm energy development by the BLM. Solar energy, in addition to the existing hydro energy infrastructure in the area, allows for new development opportunities like EV raw materials battery recycling. Rover is seeking inbound requests to partner with recycling technology companies. Please contact info@rovermetals.com with inquiries. The LGL project is a one and half hour drive from the city of Las Vegas, one of the fastest growing cities in the U.S.
Resignation of Director
Eugene Hodgson has resigned as a director of the Company. Mr. Hodgson was an integral part of Rover’s early growth years, helping the Company establish a presence in the Northwest Territories of Canada. The resignation of Mr. Hodgson coincides with management’s efforts to focus on lithium resource development in Nevada. The Company is seeking to add new directors with experience in Nevada over the coming weeks and months. Mr. Hodgson will stay on in an advisory consulting capacity with the Company on an as-needed basis.
Rover is a publicly traded junior mining company that trades on the TSXV under symbol ROVR, on the OTCQB under symbol ROVMF, and on the FSE under symbol 4XO. The Company has a diverse portfolio of mining resource development projects with varying exploration timelines. Its critical mineral projects include lithium, zinc, and copper. Its precious metals projects include gold and silver. The Company is exclusive to the mining jurisdictions of the U.S. and Canada.
You can follow Rover on its social media channels:
This news release contains statements that constitute “forward-looking statements.” Such forward-looking statements involve known and unknown risks, uncertainties, and other factors that may cause Rover’s actual results, performance, achievements, or developments in the industry to differ materially from the anticipated results, performance, or achievements expressed or implied by such forward-looking statements. Forward-looking statements are statements that are not historical facts and are generally, but not always, identified by the words “expects,” “plans,” “anticipates,” “believes,” “intends,” “estimates,” “projects,” “potential” and similar expressions, or that events or conditions “will,” “would,” “may,” “could” or “should” occur. There can be no assurance that such statements prove to be accurate. Actual results and future events could differ materially from those anticipated in such statements, and readers are cautioned not to place undue reliance on these forward-looking statements. Any factor could cause actual results to differ materially from Rover’s expectations. Rover undertakes no obligation to update these forward-looking statements in the event that management’s beliefs, estimates, opinions, or other factors, should change.
THE FORWARD-LOOKING INFORMATION CONTAINED IN THIS NEWS RELEASE REPRESENTS THE EXPECTATIONS OF THE COMPANY AS OF THE DATE OF THIS NEWS RELEASE AND, ACCORDINGLY, IS SUBJECT TO CHANGE AFTER SUCH DATE. READERS SHOULD NOT PLACE UNDUE IMPORTANCE ON FORWARD-LOOKING INFORMATION AND SHOULD NOT RELY UPON THIS INFORMATION AS OF ANY OTHER DATE. WHILE THE COMPANY MAY ELECT TO, IT DOES NOT UNDERTAKE TO UPDATE THIS INFORMATION AT ANY PARTICULAR TIME EXCEPT AS REQUIRED IN ACCORDANCE WITH APPLICABLE LAWS.
NEITHER THE TSX VENTURE EXCHANGE NOR ITS REGULATION PROVIDER (AS THAT TERM IS DEFINED IN THE POLICIES OF THE TSX VENTURE EXCHANGE) ACCEPTS RESPONSIBILITY FOR THE ADEQUACY OF THIS RELEASE.
Edmonton, Alberta–(Newsfile Corp. – December 13, 2023) – Grizzly Discoveries Inc. (TSXV: GZD) (FSE: G6H) (OTCQB: GZDIF) (“Grizzly” or the “Company”) is pleased to announce the first assay results for rock samples collected from the newly acquired and staked mineral claims in the Westbridge area of the Greenwood District. These are some of the first results from work conducted in the Westbridge to Beaverdell target areas within the Greenwood Precious and Battery Metals Project. In addition, results will also be forthcoming from additional prospecting and sampling in the Greenwood area and from recent work conducted at the Robocop Property following up on copper-cobalt anomalous soils identified in work over the last two years.
Highlights:
A total of 51 rock grab samples were collected from outcrop and mineralized dump material across the Colby and Enterprise claims acquired in early 2023 (Figures 1 & 2).
Additional staking has been conducted to expand and firm up the land position in the area.
Rock grab samples (40) from showings and mineralized dumps in the Colby area returned 13 samples with >1.0 gram per tonne (g/t) (0.029 ounces per ton [opt]) gold (Au) and 8 samples with >5.0 g/t (0.146 opt) Au up to 26.2 g/t (0.764 opt) Au including 12 grab samples with >30.0 g/t (0.875 opt) silver (Ag) up to 460 g/t (13.42 opt) Ag.
The high Au and Ag values are often accompanied by high lead and zinc in the 0.1 – 1% range. The high values are associated with gossanous pyritic material in quartz veins and breccia in what appears to be quartzite in contact with a diorite or felsic porphyry (Figures 3 & 4).
A total of 11 selected rock grab samples from the Enterprise showing and historical workings yielded 3 grab samples with >1.0 g/t (0.029 opt) Au up to 32.0 g/t (0.933 opt) Au including 3 grab samples with >30.0 g/t (0.875 opt) Ag up to 187 g/t (5.45 opt) Ag (Figures 1 and 2).
Sulphide mineralization at the Colby and Enterprise historical workings is associated with quartz veins, breccia and skarnified/silicified sedimentary rocks and intrusions. The alteration patterns are consistent with intermediate sulphidation epithermal mineralization.
Brian Testo, President and CEO of Grizzly Discoveries, stated, “We are excited with the new results to date from the new Westbridge mineral claims and we are planning follow-up exploration including extensive soil and rock sampling programs along with ground geophysical surveys. Much of newly acquired ground has seen little exploration and evaluation since the 1980’s. We also are looking forward to pursuing a number of high grade gold – silver – copper showings and historical mines with drilling in the New Year along with additional exploration for significant battery metal prospects in our current 165,000+ acre land holdings in the Greenwood District. We have barely scratched the surface in terms of exploration!“
As the Company awaits drilling permits from the BC Government, significant ground based prospecting and sampling programs have been executed at the newly staked Marshall Lake claims as well as at a number of other exploration target areas including Midway, Imperial, Sappho-West Lexington and Beaverdell areas (Figure 5). A total of more than 800 rock samples and 3,800 soil samples have been collected during the 2023 field season. Results will be announced as they are received and interpreted over the coming weeks.
Update on Drilling:
Drilling will initially be focused at the historical Midway Mine (Figure 5) but the intent is that eventually the Company will complete new drilling in 2024 at Midway, Imperial, Copper Mountain (Mable Jenny, Coronation and Prince of Wales targets), and potentially the Sappho areas, depending upon the timing of the receipt of drill permits, additional funding and weather permitting. We eagerly await drilling permits from the BC Ministry of Energy Mines and Petroleum Resources. The permit applications were submitted initially in January-February of this year and the Company is now awaiting final comments and any required conditions or changes resulting from the recently completed 30 day notification periods. Archaeological and biological surveys are being conducted where required.
Figure 5: Grizzly active exploration target areas 2023.
An extensive rock and soil sampling program along with new geological mapping during 2023 has been conducted in preparation for drilling. The work has yielded two new showings identified near the historical Midway Mine including up 5.64 g/t (0.165 opt) Au from a showing 400 m to the north of the Midway Mine and a second showing along an apparent fault structure with 4.19 g/t (0.122 opt) Au from a grab sample collected about 375 m to the west of the Midway Mine. At least 6 new areas with anomalous gold (> 100 ppb Au), silver or copper in soils have been identified across the Midway Mine Property with the results from follow up exploration in progress (See Company News Release Dated October 12, 2023). A summary of all the Midway results will be provided once all the results are received.
To date, gold-silver-base metal mineralization appears to be related to veins and stockworks at contacts between altered ultramafic-carbonate rocks (listwanites) in contact with diorite intrusions in a complex structural setting, with the intersections of structures playing a key role in the localization of alteration.
At the historical Imperial Mine area, a total of 50 new rock grab and rock chip samples were collected from the Imperial showing area, with 6 samples returning greater than 1 g/t(0.029 opt) Au up to 12.1 g/t (0.353 opt) Au and 8 samples retuning greater than 40 g/t (1.167 opt) Ag up to 469 g/t (13.68 opt) Ag (Figure 5). The samples define a targeted north – south strike length of over 170 m for future drilling. The samples show significant amounts of lead (Pb), zinc (Zn) and Cu with several samples yielding greater than 2% combined base metals (See Company News Release Dated October 12, 2023). Geological mapping is in progress and ground geophysical surveys are planned prior to conducting drilling at this target.
The Copper Mountain area continues to yield excellent results from a number of showings including the Coronation and Prince of Wales historical mines along with the Mabel Jenny area (Figure 5). A total of 9 of 14 rock grab and chip samples collected this year from a new zone discovered late in 2022 has yielded greater than 1 g/t (0.039 opt) Au up to 13.75 g/t (0.40 opt) Au (along with up to 61.9 g/t (1.81 opt) Ag) and up to 0.475% Cu and 2.93% Zn (See Company News Release Dated October 12, 2023). The discovery was made along a new logging road cut late in 2022 and appears to demonstrate quartz vein stockwork mineralization in an altered diorite over a strike length of more than 400 m when combined with anomalous samples from 2022.
Geological and prospecting crews have concluded prospecting, geological mapping, rock and soil sampling within the Greenwood Project area and have conducted an initial pass at the new mineral claim area staked August 1, 2023 (See Company News Release dated September 7, 2023). A number of existing showings and parts or extensions to known showings have been acquired with the staking of the new mineral claims including but not limited to Marshall Lake, Sylvester K, the Great Laxey, Eholt and lands adjacent to and surrounding the historical Phoenix Mine. Results from the initial sampling programs on these new claims will be released as they are received (Figure 5).
The geological and prospecting crew has made several discoveries of sulphide, quartz vein zones and skarn on the new claims (Figure 5). Sulphide showings associated with skarn at Marshall Lake hosted in Triassic Brooklyn Formation sedimentary rocks including limestone that has been intruded by diorite. The showings have been trenched and bulk sampled in the past (1960’s to 1970’s) yielding significant copper, silver and gold. Little to no modern exploration has been performed at the Marshall Lake target as well as a number of other showings in the Brooklyn sequence such as the Great Laxey.
The goal is to have a pipeline of high priority precious metal and battery metal targets that are all permitted and ready for a long 2024 drilling campaign in order to prioritize these assets into those that can deliver future mineral resources with additional drilling, eventually leading to some form of economic studies and scenarios that might be able to take advantage of local toll treating opportunities that exist in the Greenwood – Republic region.
Quality Assurance and Control
Rock and soil samples were analyzed at ALS Global Laboratories (Geochemistry Division) in Vancouver, Canada (an ISO/IEC 17025:2017 accredited facility). Gold was assayed using a fire assay with atomic emission spectrometry and gravimetric finish when required (+10 g/t Au). Rock grab and rock chip samples from outcrop/bedrock are selective by nature and may not be representative of the mineralization hosted on the project.
The sampling program was undertaken by Company personnel under the direction of Michael B. Dufresne, M.Sc., P.Geol., P.Geo. A secure chain of custody is maintained in transporting and storing of all samples.
The technical content of this news release and the Company’s technical disclosure has been reviewed and approved by Michael B. Dufresne, M. Sc., P. Geol., P.Geo., who is the Qualified Person as defined by National Instrument 43-101 Standards of Disclosure for Mineral Projects.
ABOUT GRIZZLY DISCOVERIES INC.
Grizzly is a diversified Canadian mineral exploration company with its primary listing on the TSX Venture Exchange focused on developing its approximately 72,700 ha (approximately 180,000 acres) of precious and base metals properties in southeastern British Columbia. Grizzly is run by a highly experienced junior resource sector management team, who have a track record of advancing exploration projects from early exploration stage through to feasibility stage.
On behalf of the Board,
GRIZZLY DISCOVERIES INC. Brian Testo, CEO, President
Suite 363-9768 170 Street NW Edmonton, Alberta T5T 5L4
Neither the TSX Venture Exchange nor its Regulation Services Provider (as that term is defined in the policies of the TSX Venture Exchange) accepts responsibility for the adequacy or accuracy of this release.
Caution concerning forward-looking information
This press release contains “forward-looking information” and “forward-looking statements” within the meaning of applicable securities laws. This information and statements address future activities, events, plans, developments and projections. All statements, other than statements of historical fact, constitute forward-looking statements or forward-looking information. Such forward-looking information and statements are frequently identified by words such as “may,” “will,” “should,” “anticipate,” “plan,” “expect,” “believe,” “estimate,” “intend” and similar terminology, and reflect assumptions, estimates, opinions and analysis made by management of Grizzly in light of its experience, current conditions, expectations of future developments and other factors which it believes to be reasonable and relevant. Forward-looking information and statements involve known and unknown risks and uncertainties that may cause Grizzly’s actual results, performance and achievements to differ materially from those expressed or implied by the forward-looking information and statements and accordingly, undue reliance should not be placed thereon.
Risks and uncertainties that may cause actual results to vary include but are not limited to the availability of financing; fluctuations in commodity prices; changes to and compliance with applicable laws and regulations, including environmental laws and obtaining requisite permits; political, economic and other risks; as well as other risks and uncertainties which are more fully described in our annual and quarterly Management’s Discussion and Analysis and in other filings made by us with Canadian securities regulatory authorities and available at www.sedar.com. Grizzly disclaims any obligation to update or revise any forward-looking information or statements except as may be required by law.
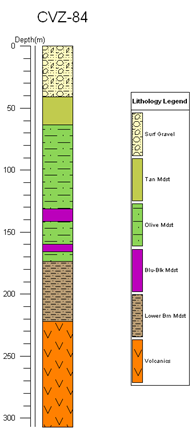
VANCOUVER, BC / ACCESSWIRE / December 13, 2023 / Noram Lithium Corp. (“Noram”) (TSXV:NRM)(FRA:N7R)(OTCQB:NRVTF) is pleased to announce the completion of the third hole of its 10-hole drilling program on the Zeus property in Clayton Valley, Nevada, USA. The core hole was bottomed at 1008 feet (307.2m), making it the deepest hole thus far drilled on the property. The Phase VII program was designed to drill deeper and test the possibility of a deep high-grade lithium lens below the previously defined Zeus resource which has been postulated from previous drilling and would have a significant impact on the Prefeasibility Study.
The core has been cleaned, logged, photographed and is in the process of being sampled for assay by the crew with the independent consulting group Big Rock Exploration of Duluth, Minnesota, USA. A graphical representation of the hole’s lithology is shown in Figure 1.
Figure 1 – Graphical representation of the CVZ-84 lithology.
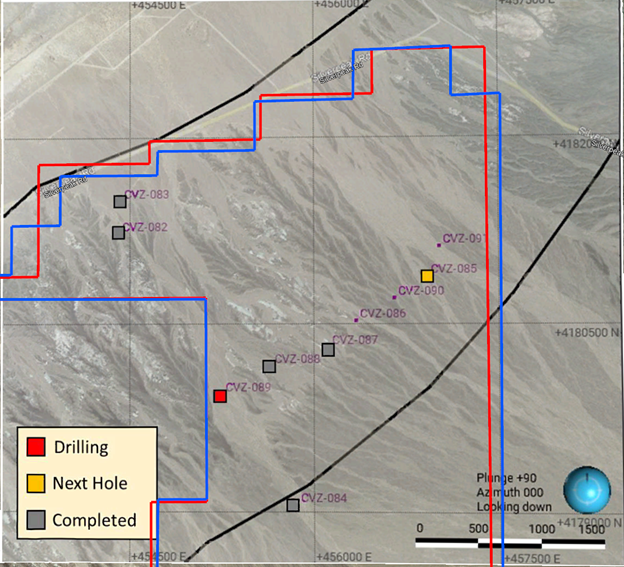
CVZ-84 was drilled in an area of the property that has seen thick high-grade lithium intersections in past drilling, but CVZ-84 is interpreted to be on the southeast side of a fault which may have acted as a northeast-trending mineralizing structure. The hole was designed to test this interpretation. Figure 2 shows its areal relationship to other completed and proposed holes in the current program, along with the location of the interpreted fault (in black) and Noram’s placer and lode claim outlines (in blue and red, respectively). After completing CVZ-84, the drill moved onto CVZ-87 and CVZ-88. News releases on these holes will be forthcoming in the near future.
Figure 2 – Current drilling status.
Sampling of the core using an industry standard QA/QC protocol is underway. Samples are to be delivered to ALS Laboratories in Reno, Nevada for assaying. Assay results are pending.
“The completion of this hole at depth was an important step for Noram. It allowed us to confirm and better understand the geology of the area. With each program, we have been able to build a more comprehensive model and validate our interpretations. This is crucial in truly understanding the size and extent of the resource as well as its commercial value” stated Sandy MacDougall, Executive Chairman and Director.
Noram Lithium Corp. (TSXV:NRM) | (OTCQB:NRVTF) | (Frankfurt:N7R) is focusing on advancing its 100%-owned Zeus Lithium Project located in Clayton Valley, Nevada an emerging lithium hub within the United States.
Qualified Person
The technical information contained in this news release has been reviewed and approved by Brad Peek, M.Sc., CPG, who is a Qualified Person as defined by National Instrument 43-101 Standards of Disclosure for Mineral Projects, and also Vice President of Exploration for Noram.
Neither the TSX Venture Exchange nor its Regulation Services Provider (as that term is defined in the policies of the TSX Venture Exchange) accepts responsibility for the adequacy or accuracy of this release.
Cautionary Statement Regarding Forward Looking Information
This news release may contain forward-looking information which is not comprised of historical facts. Forward-looking information involves risks, uncertainties and other factors that could cause actual events, results, performance, prospects and opportunities to differ materially from those expressed or implied by such forward-looking information. Forward-looking information in this news release includes statements regarding, among other things, plans for ongoing development of the Zeus Lithium Project. Factors that could cause actual results to differ materially from such forward-looking information include, but are not limited to, regulatory approval processes, results of further exploration work, and availability of capital on terms acceptable to the Company. Although Noram believes that the assumptions used in preparing the forward-looking information in this news release are reasonable, including that all necessary regulatory approvals will be obtained in a timely manner, undue reliance should not be placed on such information, which only applies as of the date of this news release, and no assurance can be given that such events will occur in the disclosed time frames or at all. Noram disclaims any intention or obligation to update or revise any forward-looking information, whether as a result of new information, future events or otherwise, other than as required by applicable securities laws.