Categories
Base Metals Energy Junior Mining Precious Metals

Bolivia Eases Rules on Gold Holdings as Liquidity Crunch Bites

Sergio Mendoza
Fri, November 8, 2024 at 3:05 PM EST

(Bloomberg) — Bolivia’s central bank is easing its rules on national gold reserves, potentially allowing it to access more liquidity to pay for imports and address a crippling fuel shortage.

The resolution, issued by the board this week, allows the bank to report its gold holdings twice a year: on Nov. 5 and May 5. By law, the institution must keep at least 22 tons of the metal, but the change could potentially allow it to drop below this level between the reporting dates.

Bolivia needs “flexibility” in the management of its gold holdings in order to maintain “the normal functioning of international payments in the country”, according to the resolution posted on its website.

The bank didn’t say it if plans to sell some of its holdings in the short term, and didn’t immediately reply to a written request for comment.

The bank reported 22.37 tons of gold holdings at the end of August, with a value of $1.8 billion.

Bolivia is undergoing an economic crisis as a shortage of foreign currency causes scarcity of fuel and other key goods as well as accelerating inflation. The crisis is being aggravated by clashes between supporters of President Luis Arce and former President Evo Morales.

Source: https://finance.yahoo.com/news/bolivia-eases-rules-gold-holdings-200553842.html

Categories
Base Metals Emx Royalty Energy Junior Mining Precious Metals Project Generators

EMX Royalty Announces Q3 2024 Results; Expects to Exceed 2024 Adjusted Royalty Revenue Guidance

Vancouver, British Columbia–(Newsfile Corp. – November 7, 2024) – EMX Royalty Corporation (NYSE American: EMX) (TSXV: EMX) (FSE: 6E9) (the “Company” or “EMX”) is pleased to report results for the three and nine months ended September 30, 2024 (in U.S. dollars unless otherwise noted).

In Q3 2024, EMX continued on a strong uptrend due to robust royalty production and strong metal prices. Strong performance during the quarter was marked from Caserones, Gediktepe, and Leeville. EMX continued to invest capital generating and acquiring royalties around the world while our partners invested significant capital to expand operations at existing mines, advance towards the development of new mines, and explore for new opportunities.

Summary of Financial Highlights for the Quarter Ended September 30, 2024 and 2023:

 Three months ended September
30,
Nine months ended September 30,
(In thousands of U.S. dollars) 2024202320242023
         
Statement of Income (Loss)    
Revenue and other income2$7,027$12,925$19,272$19,075
General and administrative costs (1,537)(1,364)(5,379)(4,662)
Royalty generation and project evaluation costs, net (3,090)(3,505)(8,931)(8,527)
Net income (loss)$1,194$2,441$(5,055)$(6,007)
     
Statement of Cash Flows     
Cash flows from operating activities $(187)$7,122$326$2,787
     
Non-IFRS Financial Measures1,2     
Adjusted revenue and other income $9,660$14,527$26,711$26,108
Adjusted royalty revenue $8,817$12,744$24,310$21,951
GEOs sold 3,5606,60810,60711,358
Adjusted cash flows from operating activities $1,760$8,863$5,762$7,880
Adjusted EBITDA $5,071$10,168$12,933$13,390
Strong Revenue Growth
Excluding $6,676,000 in catch-up payments received in Q3 2023 related to the Timok royalty, adjusted revenue and other income1 increased by 23% and adjusted royalty revenue1 increased by 45%3 compared to Q3 2023.
Development of Flagship Assets
Significant investment by Zijin Mining Group at Timok through continued development of upper and lower zonesIncreased exploration activity by Zijin Mining Group and Lundin Mining within EMX’s existing royalty footprints.
Exceeding Adjusted Royalty Revenue1 Guidance
The Company expects to exceed its 2024 adjusted royalty revenue1 guidance range of $22,000,000 to $27,500,000.
Other Q3 2024 Highlights
Excluding catch-up payments received in Q3 2023, adjusted EBITDA1 increased 45%3 compared to Q3 2023.Working capital of $41,825,000 as at September 30, 2024.


Outlook

The Company previously announced 2024 guidance of GEOs sales of 11,000 to 14,000, adjusted royalty revenue of $22,000,000 to $27,500,000 and option and other property income of $2,000,000 to $3,000,000. The Company is currently on pace to achieve the upper end of its annual guidance for GEOs sold, and exceed adjusted royalty revenue, while aiming for the lower end of our option and other property income guidance.

The Company is excited about the prospect for continued growth in the portfolio for 2024 and the coming years. The driver for near and long term growth in cash flow will come from the large deposits at Caserones in Chile and Timok in Serbia. At Caserones, Lundin has initiated an exploration program which is intended to expand mineral resources and mineral reserves while at the same time looking to increase throughput at the plant. At Timok, Zijin Mining Group Co. continues to increase its production rates in the upper zone copper-gold deposit while developing the lower zone, which we believe will be one of the more important block cave development projects in the world. Zijin also highlighted a recently discovered exploration target south of the Cukaru Peki mine and within EMX’s royalty footprint. Analysis of recent satellite imagery over the Brestovac license, which contains the Cukaru Peki Mine and is covered by EMX’s royalty, shows substantial development of new drill pads with numerous drill rigs visible in the images in the southeast corner of the license.

In terms of other producing royalty assets, the Company expects Gediktepe, Leeville, and Gold Bar South to mirror what occurred in 2023. In Türkiye, Gediktepe continues to perform well and is ahead of its production forecast for 2024 (as of the end of Q3) and production rates at Balya North continued to increase in Q3. New and compelling exploration results were announced at the Viscaria copper-iron-silver development project in Q3 and the new owner/operator of Gediktepe highlighted potential for additional oxide gold and polymetallic sulfide mineralization beyond the currently defined resources. We are also excited about the advancement of Diablillos in Argentina by AbraSilver Resource Corp. where the company continues to expand the mineral resource. These developments are all examples of the remarkable optionality that exists through EMX’s global royalty portfolio.

EMX believes it is well positioned to identify and pursue new royalty and investment opportunities, while further filling a pipeline of royalty generation properties heading into 2025. As the Company continues to generate revenues from its producing royalty assets and from other option, advance royalty and pre-production payments across its global asset portfolio, various opportunities for capital redeployment will be evaluated. Such opportunities may include the direct acquisition of royalties, continued organic generation of royalties through partner funded projects, purchase of strategic investments, share buybacks through the Normal Course Issuer Bid or debt repayment. Through the astute allocation of capital, EMX will seek to build upon its recent years of success and continue creating value for shareholders into the future.

Third Quarter Results for 2024

In Q3 2024, the Company recognized $9,660,000 and $8,817,000 in adjusted revenue and other incomeand adjusted royalty revenue4, respectively, which represented a 23%5  and 45%5 increase, respectively, compared to Q3 2023. The increase is largely due to a 72% increase in royalty revenue from Gediktepe and a 44% increase in royalty revenue from Leeville when compared to Q3 2023.

The following table is a summary of GEOs4 sold and adjusted royalty revenue4 for the three months ended September 30, 2024 and 2023:

20242023
GEOs SoldRevenue
(in thousands)
GEOs SoldRevenue
(in thousands)
           
Caserones1,063$2,633831$1,602
Timok64991,2363,9877,689
Gediktepe1,3543,3531,0141,955
Leeville4491,112401773
Balya139344295568
Gold Bar South421043159
Advanced royalty payments14355198
Adjusted royalty revenue3,560$8,8176,608$12,744

Included in the quarterly revenue for Caserones was a true up of $412,500 (Q3 2023 – $111,000) due to a higher than expected revenue in the prior quarter. The true up in the current period was mainly driven by positive provisional pricing adjustments on prior period concentrate sales, higher than estimated sales and higher than estimate realized copper prices.

The following table is a summary of GEOs1 sold and adjusted royalty revenue1 for the nine months ended September 30, 2024 and 2023:

20242023
GEOs SoldRevenue
(in thousands)
GEOs SoldRevenue
(in thousands)
           
Caserones3,232$7,4393,630$7,033
Timok61,7894,0893,9877,689
Gediktepe3,5698,1492,0984,056
Leeville1,3743,1631,0191,971
Balya367852380730
Gold Bar South15034698193
Advanced royalty payments127272145279
Adjusted royalty revenue10,607$24,31011,358$21,951

Net royalty generation and project evaluation costs decreased from $3,505,000 in Q3 2023 to $3,090,000 in Q3 2024. Royalty generation costs include exploration related activities, technical services, project marketing, land and legal costs, as well as third party due diligence for acquisitions. The decrease in net royalty generation and project evaluation costs was predominately attributable to the timing of the 2024 and 2023 annual share-based compensation grants. The 2024 annual grant occurred in Q2 2024 while the 2023 grant occurred in Q3 2023. This timing difference generated a $472,000 decrease in costs when compared to Q3 2023.

Not inclusive of the net royalty generation and project evaluation cost, EMX earned $345,000 in royalty generation revenue in Q3 2024 (Q3 2023 – $1,507,000).

Third Quarter Corporate Updates

Appointment of Stefan Wenger as Chief Financial Officer

During the three months ended September 30, 2024, the Company announced the appointment of Mr. Stefan L. Wenger as Chief Financial Officer effective October 1, 2024. Mr. Wenger was previously the Chief Financial Officer and Treasurer of Royal Gold, Inc., one of the mining industry’s leading royalty companies, from 2006 to 2018.

Credit Agreement with Franco-Nevada Corporation

In August 2024, the Company entered into a $35,000,000 credit agreement with Franco Nevada Corporation with a maturity date of July 1, 2029. Upon closing, the Company used the proceeds of the loan to repay the outstanding balance of the Sprott Credit Facility and for general working capital purposes.

Normal Course Issuer Bid

During Q3 2024 the Company repurchased and returned to treasury 692,189 common shares at a cost of $1,223,000. The Company then cancelled, pursuant to the Company’s Normal Course Issuer Bid, 684,253 common shares. Subsequent to period end, the Company repurchased 2,156,754 shares for a total cost of $3,322,000.

Qualified Persons

Michael P. Sheehan, CPG, a Qualified Person as defined by NI 43-101 and employee of the Company, has reviewed, verified, and approved the above technical disclosure on North America and Latin America, except for Caserones. Consulting Chief Mining Engineer Mark S. Ramirez, SME Registered Member #04039495, a Qualified Person as defined by NI 43-101 and consultant to the Company, has reviewed, verified and approved the above technical disclosure with respect to the Caserones Mine. Eric P. Jensen, CPG, a Qualified Person as defined by NI 43-101 and employee of the Company, has reviewed, verified, and approved the above technical disclosure on Europe, Türkiye and Australia.

Shareholder Information – The Company’s filings for the year are available on SEDAR+ at www.sedarplus.ca, on the U.S. Securities and Exchange Commission’s EDGAR website at www.sec.gov, and on EMX’s website at www.EMXroyalty.com. Financial results were prepared in accordance with International Financial Reporting Standards, as issued by the International Accounting Standards Board.

About EMX – EMX is a precious, and base metals royalty company. EMX’s investors are provided with discovery, development, and commodity price optionality, while limiting exposure to risks inherent to operating companies. The Company’s common shares are listed on the NYSE American Exchange and TSX Venture Exchange under the symbol “EMX”. Please see www.EMXroyalty.com for more information.

For further information contact:

David M. Cole
President and CEO
Phone: (303) 973-8585
Dave@EMXroyalty.com
Isabel BelgerInvestor Relations
Phone: +49 178 4909039
IBelger@EMXroyalty.com

Neither the TSX Venture Exchange nor its Regulation Services Provider (as that term is defined in policies of the TSX Venture Exchange) accepts responsibility for the adequacy or accuracy of this release

Forward-Looking Statements

This news release may contain “forward-looking information” or “forward-looking statements” that reflect the Company’s current expectations and projections about its future results. These forward-looking statements may include statements regarding the future price of copper, gold and other metals, the estimation of mineral reserves and resources, realization of mineral reserve estimates, the timing and amount of estimated future production, the Company’s growth strategy and expectations regarding the guidance for 2024 and future outlook, including revenue and GEO estimates, refinancing outstanding debt and the timing thereof, the acquisition of additional royalty interests and partnerships, the purchase of securities pursuant to the Company’s NCIB or other statements that are not statements of fact. Any statements that express or involve discussions with respect to predictions, expectations, beliefs, plans, projections, objectives, assumptions or future events or performance (often, but not always, identified by words or phrases such as “expects,” “anticipates,” “believes,” “plans,” “projects,” “estimates,” “assumes,” “intends,” “strategy,” “goals,” “objectives,” “potential,” “possible” or variations thereof or stating that certain actions, events, conditions or results “may”, “could”, “would”, “should”, “might” or “will” be taken, occur or be achieved, or the negative of any of these terms and similar expressions) are not statements of historical fact and may be forward-looking statements.

Forward-looking statements are based on a number of material assumptions, including those listed below, which could prove to be significantly incorrect, including disruption to production at any of the mineral properties in which the Company has a royalty, or other interest; estimated capital costs, operating costs, production and economic returns; estimated metal pricing (including the estimates from the CIBC Global Mining Group’s Consensus Commodity Price Forecasts published on January 2, 2024), metallurgy, mineability, marketability and operating and capital costs, together with other assumptions underlying the Company’s resource and reserve estimates; the expected ability of any of the properties in which the Company holds a royalty, or other interest to develop adequate infrastructure at a reasonable cost; assumptions that all necessary permits and governmental approvals will remain in effect or be obtained as required to operate, develop or explore the various properties in which the Company holds an interest; and the activities on any on the properties in which the Company holds a royalty, or other interest will not be adversely disrupted or impeded by development, operating or regulatory risks or any other government actions.

Certain important factors that could cause actual results, performances or achievements to differ materially from those in the forward-looking statements include, amongst others, failure to maintain or receive necessary approvals, changes in business plans and strategies, market conditions, share price, best use of available cash, copper, gold and other commodity price volatility, discrepancies between actual and estimated production, mineral reserves and resources and metallurgical recoveries, mining operational and development risks relating to the parties which produce the gold or other commodity the Company will purchase, regulatory restrictions, activities by governmental authorities (including changes in taxation), currency fluctuations, the global economic climate, dilution, share price volatility and competition.

Forward-looking statements are subject to known and unknown risks, uncertainties and other important factors that may cause the actual results, level of activity, performance or achievements of the Company to be materially different from those expressed or implied by such forward-looking statements, including but not limited to: the impact of general business and economic conditions, the absence of control over mining operations from which the Company will receive royalties from, and risks related to those mining operations, including risks related to international operations, government and environmental regulation, actual results of current exploration activities, conclusions of economic evaluations and changes in project parameters as plans continue to be refined, risks in the marketability of minerals, fluctuations in the price of gold and other commodities, fluctuation in foreign exchange rates and interest rates, stock market volatility, as well as those factors discussed in the Company’s MD&A for the quarter ended September 30, 2024, and the most recently filed Annual Information Form (“AIF”) for the year ended December 31, 2023, actual events may differ materially from current expectations. More information about the Company, including the MD&A, the AIF and financial statements of the Company, is available on SEDAR+ at www.sedarplus.ca and on the SEC’s EDGAR website at www.sec.gov. Although the Company has attempted to identify important factors that could cause actual results to differ materially from those contained in forward-looking statements, there may be other factors that cause results not to be as anticipated, estimated or intended. There can be no assurance that such statements will prove to be accurate, as actual results and future events could differ materially from those anticipated in such statements. Accordingly, readers should not place undue reliance on forward-looking statements. The Company does not undertake to update any forward-looking statements that are contained or incorporated by reference, except in accordance with applicable securities laws.

Future-Oriented Financial Information

This news release may contain future-oriented financial information (“FOFI”) within the meaning of Canadian securities legislation, about prospective results of operations, financial position, GEOs and anticipated royalty payments based on assumptions about future economic conditions and courses of action, which FOFI is not presented in the format of a historical balance sheet, income statement or cash flow statement. The FOFI has been prepared by management to provide an outlook of the Company’s activities and results and has been prepared based on a number of assumptions including the assumptions discussed under the headings above entitled “2024 Guidance”, “Outlook” and “Forward-Looking Statements” and assumptions with respect to the future metal prices, the estimation of mineral reserves and resources, realization of mineral reserve estimates and the timing and amount of estimated future production. Management does not have, or may not have had at the relevant date, or other financial assumptions which may have been used to prepare the FOFI or assurance that such operating results will be achieved and, accordingly, the complete financial effects are not, or may not have been at the relevant date of the FOFI, objectively determinable.

Importantly, the FOFI contained in this news release are, or may be, based upon certain additional assumptions that management believes to be reasonable based on the information currently available to management, including, but not limited to, assumptions about: (i) the future pricing of metals, (ii) the future market demand and trends within the jurisdictions in which the Company or the mining operators operate, and (iii) the operating cost and effect on the production of the Company’s royalty partners. The FOFI or financial outlook contained in this news release do not purport to present the Company’s financial condition in accordance with IFRS, and there can be no assurance that the assumptions made in preparing the FOFI will prove accurate. The actual results of operations of the Company and the resulting financial results will likely vary from the amounts set forth in the analysis presented in any such document, and such variation may be material (including due to the occurrence of unforeseen events occurring subsequent to the preparation of the FOFI). The Company and management believe that the FOFI has been prepared on a reasonable basis, reflecting management’s best estimates and judgments as at the applicable date. However, because this information is highly subjective and subject to numerous risks including the risks discussed under the heading above entitled “Forward-Looking Statements” and under the heading “Risk Factors” in the Company’s public disclosures, FOFI or financial outlook within this news release should not be relied on as necessarily indicative of future results.

Non-IFRS Financial Measures

The Company has included certain non-IFRS financial measures in this press release, as discussed below. EMX believes that these measures, in addition to conventional measures prepared in accordance with IFRS, provide investors an improved ability to evaluate the underlying performance of the Company. These non-IFRS financial measures are intended to provide additional information and should not be considered in isolation or as a substitute for measures of performance prepared in accordance with IFRS. These financial measures do not have any standardized meaning prescribed under IFRS, and therefore may not be comparable to other issuers.

Non-IFRS financial measures are defined in National Instrument 52-112 – Non-GAAP and Other Financial Measures Disclosure (“NI 52-112”) as a financial measure disclosed that (a) depicts the historical or expected future financial performance, financial position or cash flow of an entity, (b) with respect to its composition, excludes an amount that is included in, or includes an amount that is excluded from, the composition of the most directly comparable financial measure disclosed in the primary financial statements of the entity, (c) is not disclosed in the financial statements of the entity, and (d) is not a ratio, fraction, percentage or similar representation. A non-IFRS ratio is defined by NI 52-112 as a financial measure disclosed that (a) is in the form of a ratio, fraction, percentage or similar representation, (b) has a non-IFRS financial measure as one or more of its components, and (c) is not disclosed in the financial statements.

The following table outlines the non-IFRS financial measures, their definitions, the most directly comparable IFRS measures and why the Company use these measures.

Non-IFRS financial measureDefinitionMost directly
comparable IFRS
measure
Why we use the measure and why it is useful to investors
Adjusted revenue and
other income
Defined as revenue and other income including
the Company’s share of royalty revenue related to
the Company’s effective royalty on Caserones.
Revenue and other incomeThe Company believes these measures more accurately depict the Company’s revenue related to operations as the adjustment is to account for revenue from a material asset
Adjusted royalty revenueDefined as royalty revenue including the Company’s share of royalty revenue related to
the Company’s effective royalty on Caserones.
Royalty revenue
Adjusted cash flows from operating activitiesDefined as cash flows from operating activities plus the cash distributions related to the Company’s effective royalty on Caserones.Cash flows from operating activitiesThe Company believes this measure more accurately depicts the Company’s cash flows from operations as the adjustment is to account for cash flows from a material asset.
Gold equivalent ounces (GEOs)GEOs is a non-IFRS measure that is based on royalty interests and calculated on a quarterly basis by dividing adjusted royalty revenue by the average gold price during such quarter. The gold price is determined based on the LBMA PM fix. For periods longer than one quarter, GEOs are summed for each quarter in the period.Royalty revenueThe Company uses this measure internally to evaluate our underlying operating performance across the royalty portfolio for the reporting periods presented and to assist with the planning and forecasting of future operating results.
Earnings before interest, taxes, depreciation and amortization (EBITDA) and adjusted EBITDAEBITDA represents net earnings or loss for the period before income tax expense or recovery, depreciation and amortization, finance costs. Adjusted EBITDA adds all revenue from the Caserones Royalty less any equity income from the equity investment in SLM California (Caserones Royalty holder). Additionally, it removes the effects of items that do not reflect our underlying operating performance and are not necessarily indicative of future operating results. These may include: share based payments expense; unrealized and realized gains and losses on investments; write-downs of assets; impairments or reversals of impairments; foreign exchange gains or losses; and other non-cash or non-recurring expenses or recoveries.Earnings or loss before income taxThe Company believes EBITDA and adjusted EBITDA are widely used by investors and analysts as useful indicators of our operating performance, our ability to invest in capital expenditures, our ability to incur and service debt and also as a valuation metric.

Reconciliation of Adjusted Revenue and Other Income and Adjusted Royalty Revenue:

During the three months ended September 30, 2024 and 2023, the Company had the following sources of revenue and other income:

(In thousands of dollars) Three months ended September
 30,
Nine months ended September 30,
 2024202320242023
Royalty revenue $6,184$11,142$16,871$14,918
Option and other property income 3101,4099903,109
Interest income 5333741,4111,048
Total revenue and other income $7,027$12,925$19,272$19,075

The following is the reconciliation of adjusted revenue and other income and adjusted royalty revenue:

Three months ended September 30,Nine months ended September 30,
(In thousands of dollars)2024202320242023
Revenue and other income$7,027$12,925$19,272$19,075
SLM California royalty revenue$6,162$4,002$17,409$17,586
The Company’s ownership %42.740.042.740.0
The Company’s share of royalty revenue$2,633$1,602$7,439$7,033
Adjusted revenue and other income$9,660$14,527$26,711$26,108
    
Royalty revenue$6,184$11,142$16,871$14,918
The Company’s share of royalty revenue2,6331,6027,4397,033
Adjusted royalty revenue$8,817$12,744$24,310$21,951

Reconciliation of GEOs:

Three months ended September 30,Nine months ended September 30,
(In thousands of dollars)2024202320242023
Adjusted royalty revenue$8,817$12,744$24,310$21,951
Average gold price per ounce$2,477$1,929$2,292$1,933
Total GEOs3,5606,60810,60711,358

Reconciliation of Adjusted Cash Flows from Operating Activities:

Three months ended September 30,Nine months ended September 30,
(In thousands of dollars)2024202320242023
Cash provided by (used in) operating activities$(187)$7,122$326$2,787
Caserones royalty distributions1,9471,7415,4365,093
Adjusted cash flows from operating activities$1,760$8,863$5,762$7,880

Reconciliation of EBITDA and Adjusted EBITDA:

Three months ended September 30,Nine months ended September 30,
(In thousands of dollars)2024202320242023
Income (loss) before income taxes$1,226$4,515$(4,439)$(2,225)
Finance expense9211,2983,0663,809
Depletion, depreciation, and direct royalty taxes2,2301,5956,0183,237
EBITDA$4,377$7,408$4,645$4,821
Attributable revenue from Caserones royalty2,6331,6027,4397,034
Equity income from investment in SLM California(1,276)(733)(3,484)(2,988)
Share-based payments3591,5381,9021,763
Loss (gain) on revaluation of investments(1,778)160(3,004)869
Loss (gain) on sale of marketable securities307(39)2,253420
Foreign exchange (gain) loss(51)4012041,366
Loss (gain) on revaluation of derivative liabilities(283)(336)(176)62
Loss on revaluation of receivables124
Other losses2,326
Loss on debt settlement783783
Impairment charges434543
Adjusted EBITDA$5,071$10,168$12,933$13,390

Refer to the “Non-IFRS financial measures” section below and on page 29 of the Q3 2024 MD&A for more information on each non-IFRS financial measure.
Included in Q3 2023 and Q3 YTD 2023 was $6,676,000 (3,462 GEOs sold) and $4,783,000 (2,480 GEOs sold) respectively, in catch-up payments from the Timok royalty that relate to prior periods (2021 – $1,587,000, 2022 – $3,196,000, Q2 YTD 2023 – $1,893,000)
Excluding $6,676,000 in catch-up payments received in Q3 2023 from the Timok royalty that relate to prior periods (2021 – $1,587,000, 2022 – $3,196,000, Q2 YTD 2023 – $1,893,000)
Refer to the “Non-IFRS financial measures” section below and on page 29 of the Q3 2024 MD&A for more information on each non-IFRS financial measure.
Excluding $6,676,000 in catch-up payments in Q3 2023 from the Timok royalty that relate to prior periods.
Included in Q3 2023 and Q3 YTD 2023 was $6,676,000 (3,462 GEOs sold) and $4,783,000 (2,480 GEOs sold), respectively, in catch-up payments from the Timok royalty that relate to prior periods (2021 – $1,587,000, 2022 – $3,196,000, Q2 YTD 2023 – $1,893,000)

To view the source version of this press release, please visit https://www.newsfilecorp.com/release/229192

Categories
Base Metals Dolly Varden Silver Energy Junior Mining Precious Metals

Dolly Varden Silver Intersects 12.23 g/t Au and 84 g/t Ag over 34.93m, 29.24 g/t Au and 16.94 g/t Ag over 13.94m at the Homestake Silver Deposit

Vancouver, British Columbia–(Newsfile Corp. – November 4, 2024) – Dolly Varden Silver Corporation (TSXV: DV) (OTCQX: DOLLF) (the “Company” or “Dolly Varden“) is pleased to announce drill results from its 2024 program at the Homestake Silver deposit in BC’s Golden Triangle. The five (5) drillholes reported in this release, targeted the plunge of a wide, high-grade zone within the Homestake Silver Deposit within a wide gap of previous drilling. The 2024 Kitsault Valley Project drill program is finished for the season, with 69 drill holes completed for a total of 31,726m; 41 holes totalling 15,5467 meters were drilled at the Dolly Varden area and 28 holes totalling 16,181 meters were drilled at Homestake Ridge. Results are pending on an additional 23 drill holes from Homestake Silver and property wide exploration drilling.

Highlights from the Homestake Silver Deposit (*intervals shown are core length):

  • HR24-432: Mineralized envelope including veins: 8.85 g/t Au and 5 g/t Ag over 48.23 meters, including an internal zone of stronger breccia vein intervals grading 29.24 g/t Au and 16 g/t Ag over 13.94 meters, including one breccia vein grading 701 g/t Au and 184 g/t Ag over 0.54 meters.
  • HR24-435: Mineralized envelope including veins: 4.64 g/t Au and 38 g/t Ag over 100.80 meters, including an internal interval of stronger breccia vein mineralization grading 12.23 g/t Au and 84 g/t Ag over 34.93 meters. High grade breccia veins include 166 g/t Au and 675 g/t Ag over 0.97 meters.
  • HR24-442: Vein breccia zone: 4.58 g/t Au over 9.95 meters including 14.96 g/t Au over 1.69 meters.

*Estimated true widths vary depending on intersection angles and range from 70% to 85% of core lengths, further modelling of the new interpretation is needed before true widths can be calculated
**Assay results reported are uncapped

“The identification of a gold-rich, wide and high-grade area within the Homestake Silver Deposit is highly encouraging,” said Shawn Khunkhun, CEO of Dolly Varden Silver. “Our geological team is encouraged by overlapping mineralizing phases of silver and gold rich veins and breccias; the deposit remains open for expansion.”


Figure 1. Location along Dolly Varden’s Kitsault Valley trend of Deposits

To view an enhanced version of this graphic, please visit:
https://images.newsfilecorp.com/files/1728/228744_06f0544b14c1bb08_002full.jpg

Drill hole HR24-432 and drill holes HR24-434 + 435 were completed on vertical sections 65 meters apart along strike and targeted an area within the shallow, northerly plunging zone of wide and high-grade gold and silver mineralization in a sparsely drilled area. Results from the five holes in this release suggest that the plunge of mineralization at Homestake Silver has a similar orientation as the Homestake Main Deposit, located 300m to the northwest. The average grades within these core areas are higher, on a precious metal silver equivalent basis, than the average grade of the silver deposits at the Dolly Varden property further south, due to the increased gold content at the Homestake Ridge Deposits.

Figure 2. Drill hole HR24-435 targeting the central portion of the Homestake Silver deposit. Vein and vein breccias with strong pyrite mineralization and visible gold are associated with higher grade gold and silver.

To view an enhanced version of this graphic, please visit:
https://images.newsfilecorp.com/files/1728/228744_06f0544b14c1bb08_003full.jpg

Drill holes HR24-442 and HR24-445 are step outs targeting approximately 250m vertically below the upper portion of the main plunge zone and encountered the mineralized and altered structural corridor of Homestake Silver (figure 5 and 6). Drill hole HR24-442 intersected a mineralized vein breccia stockwork zone grading 4.58 g/t Au over 9.95m, including individual breccias with stronger pyrite mineralization grading 14.96 g/t Au over 1.69m.

Figure 3. Homestake Silver Longitduinal section, looking southwest with 2024 drill hole lithology.

To view an enhanced version of this graphic, please visit:
https://images.newsfilecorp.com/files/1728/228744_06f0544b14c1bb08_004full.jpg

Homestake Ridge

The Homestake Ridge deposits are interpreted as structurally controlled, multi-phase epithermal vein stockwork and vein breccia system hosted in Jurassic Hazelton volcanic rocks. Mineralization consists of pyrite, +/-galena and sphalerite with visible gold in a breccia matrix within a silica breccia vein system (see Figure 2). The northwest orientation of the main Homestake structural trend appears to have numerous subparallel internal structures that are interpreted to form the controls for higher grade gold and silver shoots within a broader Mineralized envelope at the Homestake Silver deposit. The main structural corridor dips steeply to the northeast at Homestake Main and rolls to vertical or steeply southwest at Homestake Silver (see Figure 5).

Figure 4. Plan View of the Homestake Silver and Main Deposits; 2024 drilling in bold lithology and red outline of mineralized zones.

To view an enhanced version of this graphic, please visit:
https://images.newsfilecorp.com/files/1728/228744_06f0544b14c1bb08_005full.jpg

`

Figure 5. Homestake Silver Cross Section (B-B’) looking Northwest, with 2024 and previous drill holes.

To view an enhanced version of this graphic, please visit:
https://images.newsfilecorp.com/files/1728/228744_06f0544b14c1bb08_006full.jpg

Figure 6. Homestake Silver Cross Section (A-A’) with 2024 and previous drill holes.

To view an enhanced version of this graphic, please visit:
https://images.newsfilecorp.com/files/1728/228744_06f0544b14c1bb08_007full.jpg

Table 1. Completed Drill Hole Assays from the Homestake Silver Deposit central mineralized zone

Hole IDFrom
(m)
To
(m)
Length*
(m)
Au**
(g/t)
Ag
(g/t)
Base Metals
(%)
Section A-A’
HR24-432
entire zone313.77362.0048.238.855
vein zone338.75352.6913.9429.2416
including352.15352.690.54701.00184
HR24-442
entire zone660.75682.4021.652.604
vein zone664.54674.499.954.586
including672.80674.491.6914.9614
      
Section B-B’
HR24-434
entire zone291.97301.339.361.551540.46%Pb
including294.00295.001.0012.4713742.77%Pb, 0.81%Zn
and310.55396.2185.660.768
HR24-435
entire zone287.50388.30100.804.6438
including329.74364.6734.9312.2384
including344.11345.541.4374.15376
including344.11345.080.97166675
including350.02352.452.4334.9875
including357.96358.961.0054.403465.38%Pb, 11.90%Zn
HR24-445
entire zone629.37643.4814.112.185.25
including630.95631.650.7012.6410.1
including635.00635.500.508.7528.21.60%Pb, 4.46%Zn

*Estimated true widths vary depending on intersection angles and range from 70% to 85% of core lengths
**Assay results reported are uncapped

Table 2. Drill Hole Collar Data for 2024 Homestake Silver Deposit Drilling Reported in this release

Hole IDEasting UTM83 (m)Northing UTM83 (m)Elev. (m)AzimuthDipLength
(m)
HR24-4324636376178878831239-45510.00
HR24-4344636376178878831220-50489.00
HR24-4354636376178878831220-45444.00
HR24-4424637956179008778235-48738.30
HR24-4454637956179008778226-45705.00

Quality Assurance and Quality Control

The Company adheres to CIM Best Practices Guidelines for exploration related activities conducted on its property. Quality Assurance and Quality Control (QA/QC) procedures are overseen by the Qualified Person.

Dolly Varden QA/QC protocols are maintained through the insertion of certified reference material (standards), blanks and field duplicates within the sample stream. Drill core is cut in-half with a diamond saw, with one-half placed in sealed bags and shipped to the laboratory and the other half retained on site. Third party laboratory checks on 5% of the samples are carried out as well. Chain of custody is maintained from the drill to the submittal into the laboratory preparation facility.

Analytical testing was performed by ALS Canada Ltd. in North Vancouver, British Columbia. The entire sample is crushed to 70% minus 2mm (10 mesh), of which a 500 gram split is pulverized to minus 200 mesh. Multi-element analyses were determined by Inductively Coupled Plasma Mass Spectrometry (ICP-MS) for 48 elements following a 4-acid digestion process. High grade silver testing was determined by Fire Assay with either an atomic absorption, or a gravimetric finish, depending on grade range. Au is also determined by fire assay on a 30g split with either atomic absorption, or gravimetric finish, depending on grade range. Metallic screen assays may be completed on very high grade samples.

Qualified Person

Rob van Egmond, P.Geo., Vice-President Exploration for Dolly Varden Silver, the “Qualified Person” as defined by NI43-101 has reviewed, validated and approved the scientific and technical information contained in this news release and supervises the ongoing exploration program at the Dolly Varden Project.

About Dolly Varden Silver Corporation

Dolly Varden Silver Corporation is a mineral exploration company focused on advancing its 100% held Kitsault Valley Project (which combines the Dolly Varden Project and the Homestake Ridge Project) located in the Golden Triangle of British Columbia, Canada, 25kms by road to tide water. The 163 sq. km. project hosts the high-grade silver and gold resources of Dolly Varden and Homestake Ridge along with the past producing Dolly Varden and Torbrit silver mines. It is considered to be prospective for hosting further precious metal deposits, being on the same structural and stratigraphic belts that host numerous other, on-trend, high-grade deposits, such as Eskay Creek and Brucejack. The Kitsault Valley Project also contains the Big Bulk property which is prospective for porphyry and skarn style copper and gold mineralization, similar to other such deposits in the region (Red Mountain, KSM, Red Chris).

Forward-Looking Statements

This release may contain forward-looking statements or forward-looking information under applicable Canadian securities legislation that may not be based on historical fact, including, without limitation, statements containing the words “believe”, “may”, “plan”, “will”, “estimate”, “continue”, “anticipate”, “intend”, “expect”, “potential”, and similar expressions. Forward-looking statements involve known and unknown risks, uncertainties, and other factors which may cause the actual results, performance, or achievements of Dolly Varden to be materially different from any future results, performance, or achievements expressed or implied by the forward-looking statements. Forward looking statements or information in this release relates to, among other things, the 2024 drill program at the Kitsault Valley Project, the results of previous field work and programs and the continued operations of the current exploration program, interpretation of the nature of the mineralization at the project and that that the mineralization on the project is similar to Eskay and Brucejack, results of the mineral resource estimate on the project, the potential to grow the project, the potential to expand the mineralization and our beliefs about the unexplored portion of the property.

These forward-looking statements are based on management’s current expectations and beliefs and assume, among other things, the ability of the Company to successfully pursue its current development plans, that future sources of funding will be available to the company, that relevant commodity prices will remain at levels that are economically viable for the Company and that the Company will receive relevant permits in a timely manner in order to enable its operations, but given the uncertainties, assumptions and risks, readers are cautioned not to place undue reliance on such forward-looking statements or information. The Company disclaims any obligation to update, or to publicly announce, any such statements, events or developments except as required by law.

For additional information on risks and uncertainties, see the Company’s most recently filed annual management discussion & analysis (“MD&A“) dated August 22, 2024 and management information circular dated August 22, 2024 (the “Circular“), both of which are available on SEDAR at www.sedarplus.ca. The risk factors identified in the MD&A and the Circular are not intended to represent a complete list of factors that could affect the Company.

Neither the TSX Venture Exchange nor its Regulation Services Provider (as that term is defined in the policies of the TSX-V) accepts responsibility for the adequacy or accuracy of this news release.

For further information: Shawn Khunkhun, CEO & Director, 1-604-609-5137, www.dollyvardensilver.com.

To view the source version of this press release, please visit https://www.newsfilecorp.com/release/228744

Categories
Base Metals Energy Junior Mining Metallic Group Metallic Minerals Precious Metals

Stillwater Critical Minerals Reports up to 1.13 g/t Rhodium in Drill Results from the Stillwater West PGE-Ni-Cu-Co + Au Project, Montana, USA, and Comments on Bipartisan Support for US Miners

VANCOUVER, BC / ACCESSWIRE / November 4, 2024 / Stillwater Critical Minerals Corp. (TSXV:PGE)(OTCQB:PGEZF)(FSE:J0G) (the “Company” or “Stillwater”) is pleased to announce results of rhodium (“Rh”) assays conducted on core from resource expansion drilling on its 100%-owned Stillwater West platinum group element, nickel, copper, cobalt, and gold (“PGE-Ni-Cu-Co + Au”) project in Montana, USA, adjacent to Sibanye-Stillwater’s world-class critical minerals mining operations.

Highlights include:

  • As shown in Table 1, widespread rhodium was returned in drill results at potentially significant co-product grades including:
    • 1.13 g/t Rh in an interval that totaled 7.96 g/t Pt+Pd+Au+Rh (“4E”) over 1.2 meters in CM2023-03, starting at 308.8 meters and set within 14.6 meters of1.38 g/t 4E including 0.118 g/t Rh; and
    • 0.162 g/t Rh over 3.7 meters in CM2023-01 starting at 407.8 meters within an interval of 0.99 g/t 4E.
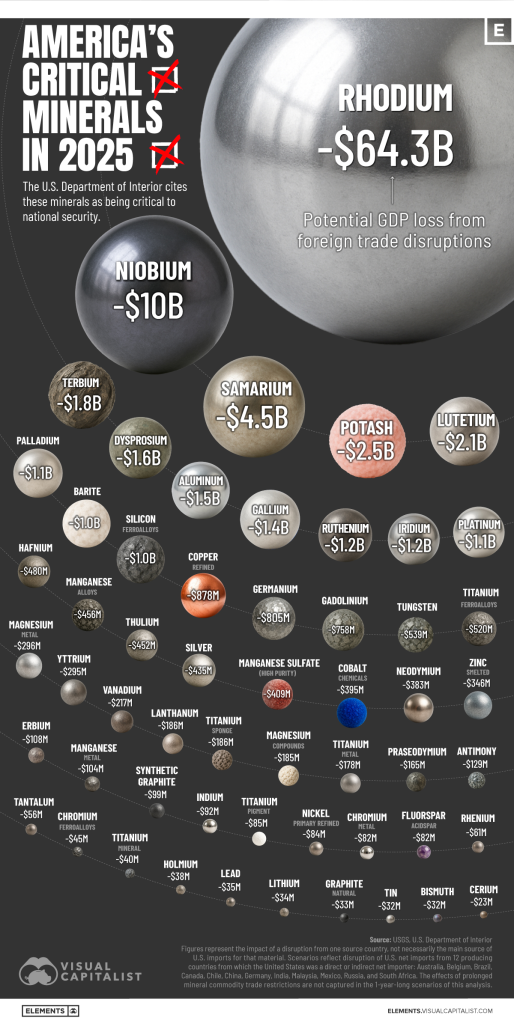
  • Supply constraints have resulted in elevated rhodium prices since 2017. At its current two-year average price of USD 6,500/oz, and three-year year average price of USD 9,500/oz, rhodium equates to more than five times the current value of palladium or platinum.
  • Results are expected to expand upon the 115,000 ounces of rhodium defined in the January 2023 Mineral Resource Estimate (“MRE”) and are similar to results from past campaigns which returned 0.103 g/t Rh over 7.9 meters in hole CM2020-05, and 0.100 g/t Rh over 6.1 meters in hole CM2007-02.
  • Rhodium is mined solely as a co-product at grades that are often below 0.1 g/t. South Africa dominates global production, and there is very little mine supply in North America.
  • Sibanye-Stillwater, adjacent to Stillwater’s Stillwater West project across 32 kilometers in the Stillwater Igneous Complex, is the primary US producer of Rh, mining the highest-grade PGE deposit in the world, the J-M Reef deposit.
  • Recent announcements concerning lay-offs and reduced production at Sibanye-Stillwater (as a result of depressed global palladium prices) have brought bipartisan support for mining jobs in Montana and US critical mineral supply from Senators Jon Tester (D) and Steve Daines (R), both of Montana, in addition to support from other local, state, and federal officials.
  • Rhodium has a high melting point, is highly corrosion resistant, and is critical in catalytic converters, along with platinum and palladium, for cleaner vehicle emissions.
  • Complete results from the expansion drill campaign, which focused on the west side of the DR and Hybrid deposits at Chrome Mountain, are being incorporated into updated block models driven by an updated 3D geologic model as announced October 16, 2024. Figure 1, updated from that release, demonstrates the impressive grade and scale of mineralization at the Stillwater West project with wide intervals at successively higher grades contained within very wide bulk-tonnage grade intervals across the 9.5-kilometer-long area that contains the current deposits, including:
    • 13.2 meters of 2.31% Ni, 0.35% Cu, 0.115% Co, and 1.51 g/t 4E starting at 37.6 meters and within 400.8 meters of continuous mineralization in hole CM2021-05;
    • 50.2 meters of 1.05 g/t 4E plus 0.19% Ni and other values within 728.1 meters of continuous mineralization in hole CM2021-01; and
    • 44.1 meters of 0.57% Ni, 0.34% Cu, 0.045% Co, and 0.74 g/t 4E starting at 32.8 meters and within 367.6 meters of continuous mineralization in hole CZ2021-01.
  • Metallurgical testing completed by AMAX confirmed recovery of rhodium along with palladium and platinum in preliminary bench-scale flotation testing at the CZ deposit area in the early 1970s.
  • Past work previously reported by the Company included surface sample results of up to 5.78 g/t Rh at the HGR target in the Iron Mountain area, and 1.07 g/t Rh at Chrome Mountain in reconnaissance-scale rock sample programs (see June 11, 2020, news release).
  • Early results for other rare PGEs show potential for additional value from iridium, osmium, and ruthenium which often occur along with platinum, palladium, and rhodium at Stillwater West.

Table 1 – Final results from resource expansion drilling including recent rhodium assay results.

Highlighted significant intercepts with grade-thickness values over 7 percent-meter recovered NiEq are presented above, except as noted. Recovered Nickel Equivalents (“NiEq”) are presented for comparative purposes using conservative long-term metal prices (all USD): $8.00/lb nickel (Ni), $4.00/lb copper (Cu), $22.00/lb cobalt (Co), $1,000/oz platinum (Pt), $1,950/oz palladium (Pd), $1,850/oz gold (Au), and $10,000/oz rhodium (Rh). NiEq is determined as follows: NiEq% = [Ni% x recovery] + [Cu% x recovery x Cu price/ Ni price] + [Co% x recovery x Co price / Ni price] + [Pt g/t x recovery / 31.103 x Pt price / Ni price / 2,204 x 100] + [Pd g/t x recovery / 31.103 x Pd price / Ni price / 2,204 x 100] + [Au g/t x recovery / 31.103 x Au price / Ni price / 2,204 x 100]. In the above calculations: 31.103 = grams per troy ounce, 2,204 = lbs per metric tonne, and 100 and 0.01 convert assay results reported in % and g/t. The following recoveries have been assumed for purposes of the above equivalent calculations: 85% for Ni and 90% for all other listed metals, based on recoveries at similar nearby operations. Total metal equivalent values include both base and precious metals. In terms of dollar value, 0.20% nickel equates to a copper value of 0.40%, or a palladium value of 0.48 g/t, using the above metal values. Intervals are reported as drilled widths and are believed to be representative of the actual width of mineralization.

Table 2 – Drill Hole Location and Depths

Michael Rowley, President and CEO, commented, “The strength and sheer scale of mineralization at Stillwater West continues to impress us as we add mineralization at several grade cut-offs, providing us with excellent optionality on potential mine methods as we advance towards our vision of becoming a primary source of critical minerals in the US. The polymetallic nature of our deposits is also strongly in our favor as the longest lived and most profitable mines in the world are almost without exception large and polymetallic. Anglo American’s Mogalakwena mines and Ivanhoe’s Platreef mine – our geologic parallels in South Africa’s Bushveld Complex – are excellent examples of large-scale polymetallic critical minerals mines in similar geology. Armed with these drill results and our new understanding of the layered geology of the Stillwater Complex per our updated 3D geologic model as announced recently, we now have the components necessary to update our current resource estimate. We look forward to further announcements from our flagship asset in addition to updates from our non-core assets.”

Dr. Danie Grobler, Vice-President of Exploration, commented, “The wealth of exploration drilling and assay data available on the Stillwater West project area greatly advanced our understanding of the mineralization controls and detailed geological interpretation. Recent drill results further support our geological models and understanding of mineralization controls within the main target areas. The current models now confirm continuity of the mineralized zones and their correlation with the A and B Chromitite horizons within the lower part of the Peridotite Zone. Both these chromite-rich horizons, viewed as thick stratiform ‘reef’- type horizons, are PGE-enriched and particularly rich in rhodium. More importantly, the reported high-grade rhodium results have now been confirmed to correlate with these two specific chromitite units and correspond to geochemical and geophysical anomalies associated with our existing resource areas defined during 2023. This largely confirms our understanding of their occurrence, and our ability to effectively target extensions and new areas”.

Recent Events in Global Platinum Group Elements Markets, Including US Government Support
In September 2024, Sibanye-Stillwater announced a substantial reduction in operations at the mines beside Stillwater West, primarily as a result of low global palladium prices. The response from the community and also local, state and federal governments was swift and supportive, with Senators Tester and Daines for example announcing bipartisan support for Montana mining jobs and US critical mineral production to bolster domestic supplies and counter foreign dumping with the intent to drive prices down. These actions were focused on palladium but similar comments and lobby efforts have been applied to nickel, cobalt, and other critical minerals in recent years, as a result of a flood of cheaper metal from Russia and Chinese-funded operations in Indonesia, the DRC, and other locations.

In October 2024, the US government approached the G-7 nations with a proposal for sanctions on Russian palladium in a further demonstration of the US’ desire to counter foreign supplies and allow its domestic resources to advance.

Most recently, Sibanye-Stillwater celebrated the publication of the final regulations for Section 45X of the Inflation Reduction Act from the US Department of the Treasury which clarified important points that will likely result in significant tax credits for production of critical minerals from their US operations.

The importance of having proactive and supportive government cannot be understated as the US looks to expand its supply chains of critical minerals.

The Company has been working with the US Geological Survey for over six years, is the industry partner on Department of Energy grants totaling USD 2.75M to date, and is actively pursuing additional government funding for critical mineral supply.

Figure 2 – Stillwater Critical Minerals President and CEO Michael Rowley with Federal politicians from Montana in May 2024 at the Hart Senate Office Building, Washington, DC. From L-R: Senator Jon Tester (D), Representative Matt Rosendale (R), Michael Rowley, Representative Ryan Zinke (R), and Senator Steve Daines (R).

Upcoming Events

Stillwater’s President and CEO, Michael Rowley, will be available for meetings and presenting at the following events:

  1. Precious Metals Summit – Zurich, CH, November 11-12, 2024. For more information, click here.
  2. 121 Mining Events – London, UK, November 14-15. For more information, click here.

About Stillwater Critical Minerals Corp.
Stillwater Critical Minerals (TSXV:PGE)(OTCQB:PGEZF)(FSE:J0G) is a mineral exploration company focused on its flagship Stillwater West Ni-PGE-Cu-Co + Au project in the iconic and famously productive Stillwater mining district in Montana, USA. With the addition of two renowned Bushveld and Platreef geologists to the team and strategic investments by Glencore plc, the Company is well positioned to advance the next phase of large-scale critical mineral supply from this world-class American district, building on past production of nickel, copper, and chromium, and the on-going production of platinum group, nickel, and other metals by neighboring Sibanye-Stillwater. An expanded NI 43-101 mineral resource estimate, released January 2023, positions Stillwater West with the largest nickel resource in an active US mining district as part of a compelling suite of nine minerals now listed as critical in the USA.

Stillwater also holds the high-grade Drayton-Black Lake- gold project adjacent to Nexgold Mining’s development-stage Goliath Gold Complex in northwest Ontario, currently under an earn-in agreement with Heritage Mining, and the Kluane PGE-Ni-Cu-Co critical minerals project on trend with Nickel Creek Platinum‘s Wellgreen deposit in Canada‘s Yukon Territory. The Company also holds the Duke Island Cu-Ni-PGE property in Alaska, now subject to an LOI towards an earn-in agreement with Granite Creek Copper, and maintains a back-in right on the high-grade past-producing Yankee-Dundee in BC, following its sale in 2013.

FOR FURTHER INFORMATION, PLEASE CONTACT:
Michael Rowley, President, CEO & Director – Stillwater Critical Minerals
Email: info@criticalminerals.com Phone: (604) 357 4790
Web: http://criticalminerals.com Toll Free: (888) 432 0075

Quality Control and Quality Assurance
2023 drill core samples were analyzed by ACT Labs in Vancouver, B.C. Sample preparation: crush (< 7 kg) up to 80% passing 2 mm, riffle split (250 g) and pulverize (mild steel) to 95% passing 105 µm included cleaner sand. Gold, platinum, and palladium were analyzed by fire assay (1C-OES) with ICP finish. Selected major and trace elements were analyzed by peroxide fusion with 8-Peroxide ICP-OES finish to insure complete dissolution of resistate minerals. Following industry QA/QC standards, blanks, duplicate samples, and certified standards were also assayed.

Mr. Mike Ostenson, P.Geo., Managing Geologist at Stillwater, is the qualified person for the purposes of National Instrument 43-101, and he has reviewed and approved the technical disclosure contained in this news release.

Forward-Looking Statements
This news release includes certain statements that may be deemed “forward-looking statements”. All statements in this release, other than statements of historical facts including, without limitation, statements regarding potential mineralization, historic production, estimation of mineral resources, the realization of mineral resource estimates, interpretation of prior exploration and potential exploration results, the timing and success of exploration activities generally, the timing and results of future resource estimates, permitting time lines, metal prices and currency exchange rates, availability of capital, government regulation of exploration operations, environmental risks, reclamation, title, and future plans and objectives of the company are forward-looking statements that involve various risks and uncertainties. Although Stillwater Critical Minerals believes the expectations expressed in such forward-looking statements are based on reasonable assumptions, such statements are not guarantees of future performance and actual results or developments may differ materially from those in the forward-looking statements. Forward-looking statements are based on a number of material factors and assumptions. Factors that could cause actual results to differ materially from those in forward-looking statements include failure to obtain necessary approvals, unsuccessful exploration results, changes in project parameters as plans continue to be refined, results of future resource estimates, future metal prices, availability of capital and financing on acceptable terms, general economic, market or business conditions, risks associated with regulatory changes, defects in title, availability of personnel, materials and equipment on a timely basis, accidents or equipment breakdowns, uninsured risks, delays in receiving government approvals, unanticipated environmental impacts on operations and costs to remedy same, and other exploration or other risks detailed herein and from time to time in the filings made by the companies with securities regulators. Readers are cautioned that mineral resources that are not mineral reserves do not have demonstrated economic viability. Mineral exploration and development of mines is an inherently risky business. Accordingly, the actual events may differ materially from those projected in the forward-looking statements. For more information on Stillwater Critical Minerals and the risks and challenges of their businesses, investors should review their annual filings that are available at www.sedar.com.

Neither the TSX Venture Exchange nor its Regulation Services Provider (as that term is defined in the policies of the TSX Venture Exchange) accepts responsibility for the adequacy or accuracy of this release.

SOURCE: Stillwater Critical Minerals Corp.


View the original press release on accesswire.com

Categories
Breaking Energy Junior Mining Precious Metals

Failed Bank Information for The First National Bank of Lindsay, Lindsay, OK

Home

https://youtu.be/u2hYF-a-IBY?si=EbsaByJNleV6SO62

CREDIT: Andy Schectman and David Morgan

On Friday, October 18, 2024, The First National Bank of Lindsay was closed by the Office of the Comptroller of the Currency. The Federal Deposit Insurance Corporation (FDIC) was named Receiver. No advance notice is given to the public when a financial institution is closed. All insured deposits have been transferred to First Bank & Trust Co., Duncan, OK.

Frequently Asked Questions

October 18, 2024 Official Press Release

A person using their phone to make a mobile deposit

If You Had a Deposit Account

The full balance of all insured deposit accounts has been transferred to First Bank & Trust Co.

In addition, based on the estimated recoveries of the failed bank assets, the FDIC will make 50 percent of uninsured funds available to those depositors on Monday, October 21, 2024. This amount could increase as the FDIC sells the assets of the failed bank.

You may continue to use your checks and ATM/Debit card to access your insured deposits. Direct deposits like paychecks and social security benefits will continue as usual. Please refer to the Banking Services section below for more details.

For accounts exceeding $250,000 and/or accounts that appear to be related and exceed this limit are reviewed by the FDIC to determine ownership and insurance coverage. To schedule an appointment with a Claims Agent, call Customer Service & Records Research in Dallas at 1-888-206-4662, Monday through Friday (excluding federal holidays) between 8:00 a.m. and 4:00 p.m. Central Time.

You can also visit the FDIC’s Failed Bank Customer Service Center (FBCSC) and register using Login.gov to review your insurance determination, schedule an appointment, and communicate about your account(s).

EDIE — Electronic Deposit Insurance Estimator
Calculate insurance coverage of deposit accounts

Facts for Depositors
General information explaining the role of FDIC

Two people being consulted by a loan officer

If You Had a Loan

You should continue to make payments, including escrow payments, as usual; the terms of your loan will not change. If your loan is currently in process or you had a line of credit, contact the FDIC.

If you are making escrow payments and receive notification that any portion of your taxes or insurance was not paid, contact the FDIC immediately.

If you received notice that the FDIC retained your loan, and you have questions, please visit the FDIC Information and Support Center.

Obtaining a Lien Release
Process on getting a release of lien

Borrower’s Guide to an FDIC Insured Bank Failure
Overview of how FDIC processes loans

Facts for Borrowers
General information explaining the role of FDIC

A couple reviewing papers and pointing at a computer

If You Are Owed Money for a Service or Product Provided

You may be eligible to file a claim against The First National Bank of Lindsay.

If you have not been paid for services rendered prior to October 18, 2024, please refer to the Filing Claims section below.

Facts for Creditors
General information explaining the role of FDIC

Publication Notice to Creditors and Depositors of The First National Bank of Lindsay

source: https://www.fdic.gov/bank-failures/failed-bank-list/first-national-bank-lindsay

Categories
Base Metals Energy Junior Mining Project Generators

F3 Announces Closing of Private Placement for Aggregate Gross Proceeds of C$8 Million

Kelowna, British Columbia–(Newsfile Corp. – October 31, 2024) – F3 Uranium Corp. (TSXV: FUU) (OTC Pink: FUUFF) (“F3 Uranium” or the “Company“) is pleased to announce the closing of its previously announced “bought deal” private placement (the “Offering“) for aggregate gross proceeds of C$8,000,000, which includes the full exercise of the Underwriters’ over-allotment option. Under the Offering, the Company sold 7,500,000 federal flow-through units of the Company (the “FFT Units“) at a price of C$0.375 per FFT Unit and 12,500,000 Saskatchewan flow-through units of the Company (the “SFT Units“, and together with the FFT Units, the “FT Units“) at a price of C$0.415 per SFT Unit, for an aggregate of 20,000,000 FT Units at a blended price of C$0.40 per FT Unit.

Red Cloud Securities Inc. acted as lead underwriter and sole bookrunner on behalf of a syndicate of underwriters that included Canaccord Genuity Corp., Haywood Securities Inc., SCP Resource Finance LP and Eight Capital (collectively, the “Underwriters“).

Each FT Unit consists of one common share of the Company (each, a “Common Share“) issued as a “flow-through share” within the meaning of subsection 66(15) of the Income Tax Act (Canada) (each, a “FT Share“) and one half of one Common Share purchase warrant (each whole warrant, a “Warrant“). Each whole Warrant shall entitle the holder to purchase one Common Share (each, a “Warrant Share“) at a price of C$0.40 at any time on or before October 31, 2026.

A total of 12,500,000 FT Units under the Offering (the “LIFE Units“), representing gross proceeds of C$5,000,000, were offered by way of the “listed issuer financing” exemption under Part 5A under National Instrument 45-106 – Prospectus Exemptions (“NI 45-106“) in all the provinces of Canada except for Quebec (the “Selling Jurisdictions“). The FT Shares and Warrant Shares issuable pursuant to the sale of the LIFE Units are immediately freely tradeable under applicable Canadian securities legislation if sold to purchasers’ resident in Canada. The remaining 7,500,000 FT Units sold under the Offering (the “Non-LIFE Units“) were offered by way of the “accredited investor” and “minimum amount investment” exemptions under NI 45-106 in the Selling Jurisdictions. The FT Shares and Warrant Shares issuable from the sale of the Non-LIFE Units are subject to a restricted period in Canada ending on March 1, 2025.

In connection with the Offering, the Company paid to the Underwriters an aggregate cash commission of C$431,860, equal to 5.5% of the gross proceeds raised in respect of the Offering (except for gross proceeds raised from the sale of FT Units sold to purchasers on a president’s list (the “President’s List“), which were subject to a reduced 2.75% cash commission). The Company also issued to the Underwriters a total of 1,079,650 warrants of the Company (the “Broker Warrants“), equal to 5.5% of the number of FT Units sold pursuant to the Offering (except for those FT Units sold to purchasers on the President’s List, which were subject to a reduced number of Broker Warrants equal to 2.75%). Each Broker Warrant entitles the holder thereof to purchase one Common Share at a price of C$0.32 at any time on or before October 31, 2026.

The proceeds of the Offering will be used by the Company to fund exploration of the Company’s projects in the Athabasca Basin. The Offering remains subject to the final approval of the TSX Venture Exchange.

About F3 Uranium Corp.

F3 Uranium is a uranium exploration company advancing its newly discovered high-grade JR Zone and exploring for additional mineralized zones on its 100%-owned Patterson Lake North (PLN) Project in the southwest Athabasca Basin. PLN is accessed by Provincial Highway 955, which transects the property, and the new JR Zone discovery is located ~25km northwest of Fission Uranium’s Triple R and NexGen Energy’s Arrow high-grade uranium deposits. This area is poised to become the next major area of development for new uranium operations in northern Saskatchewan. The PLN project is comprised of the PLN, Minto and Broach properties. The Broach property incorporates the former PW property which was obtained from CanAlaska as a result of a property swap.

The TSX Venture Exchange and the Canadian Securities Exchange have not reviewed, approved or disapproved the contents of this press release, and do not accept responsibility for the adequacy or accuracy of this release.

F3 Uranium Corp.
750-1620 Dickson Avenue
Kelowna, BC V1Y9Y2

Contact Information
Investor Relations
Telephone: 778 484 8030
Email: ir@f3uranium.com

ON BEHALF OF THE BOARD

“Dev Randhawa”
Dev Randhawa, CEO

Cautionary Statement: F3 Uranium Corp.

This press release contains “forward-looking information” within the meaning of applicable Canadian and United States securities laws, which is based upon the Company’s current internal expectations, estimates, projections, assumptions and beliefs. The forward-looking information included in this press release are made only as of the date of this press release. Such forward-looking statements and forward-looking information include, but are not limited to, statements concerning the Company’s expectations with respect to the Offering and the use of proceeds of the Offering. Forward-looking statements or forward-looking information relate to future events and future performance and include statements regarding the expectations and beliefs of management based on information currently available to the Company. Such forward-looking statements and forward-looking information often, but not always, can be identified by the use of words such as “plans”, “expects”, “potential”, “is expected”, “anticipated”, “is targeted”, “budget”, “scheduled”, “estimates”, “forecasts”, “intends”, “anticipates”, or “believes” or the negatives thereof or variations of such words and phrases or statements that certain actions, events or results “may”, “could”, “would”, “might” or “will” be taken, occur or be achieved.

Forward-looking statements or forward-looking information are subject to a variety of risks and uncertainties which could cause actual events or results to differ materially from those reflected in the forward-looking statements or forward-looking information, including, without limitation, risks and uncertainties relating to: general business and economic conditions; regulatory approval for the Offering; changes in commodity prices; the supply and demand for, deliveries of, and the level and volatility of the price of uranium and other metals; changes in project parameters as exploration plans continue to be refined; costs of exploration including labour and equipment costs; risks and uncertainties related to the ability to obtain or maintain necessary licenses, permits or surface rights; changes in credit market conditions and conditions in financial markets generally; the ability to procure equipment and operating supplies in sufficient quantities and on a timely basis; the availability of qualified employees and contractors; the impact of value of the Canadian dollar and U.S. dollar, foreign exchange rates on costs and financial results; market competition; exploration results not being consistent with the Company’s expectations; changes in taxation rates or policies; technical difficulties in connection with mining activities; changes in environmental regulation; environmental compliance issues; and other risks of the mining industry. Should one or more of these risks and uncertainties materialize, or should underlying assumptions prove incorrect, actual results may vary materially from those described in forward-looking statements or forward-looking information. Although the Company has attempted to identify important factors that could cause actual results to differ materially, there may be other factors that could cause results not to be as anticipated, estimated or intended. For more information on the Company and the risks and challenges of its business, investors should review the Company’s annual filings that are available at www.sedarplus.ca. The forward-looking statements included in this press release are made as of the date of this press release and F3 Uranium Corp. disclaims any intention or obligation to update or revise any forward-looking statements, whether as a result of new information, future events or otherwise, except as expressly required by applicable securities legislation.

To view the source version of this press release, please visit https://www.newsfilecorp.com/release/228374

Categories
Base Metals Emx Royalty Energy Junior Mining Precious Metals Project Generators

EMX Provides an Update on Exploration Successes at Viscaria

Vancouver, British Columbia–(Newsfile Corp. – October 31, 2024) – EMX Royalty Corporation (NYSE American: EMX) (TSX Venture: EMX) (FSE: 6E9) (the “Company” or “EMX”) is pleased to announce that the operator of the Viscaria copper-iron-silver project in Northern Sweden, where EMX holds a royalty interest, recently published new exploration results that appear to include discoveries of multiple new bodies of mineralization. Viscaria Gruvaktiebolag (“Viscaria”; formerly Copperstone Resources AB) is the operator of the Viscaria project and has been undertaking final permitting and recently commenced construction of its water treatment plant needed for the reopening of the past-producing mine. According to their disclosures, Viscaria expects to commence production on the project in 2026.

In parallel with its ongoing development work, Viscaria has been conducting its first “near mine” exploration drilling campaign, which commenced in spring of this year. According to Viscaria’s most recent exploration presentation and news release1, over 9,000 meters of drilling have been completed as part of this program. This has led to the recognition and definition of additional zones of mineralization that project downward from the currently defined “D” and “B” resource areas, as well as a new zone of drill-defined mineralization that lies beneath the “A” and “B” resource areas and has been named the “ABBA” zone (see Figures 1 and 2). Viscaria has described these new discoveries as “exceptional exploration results” which highlight the considerable upside potential and optionality that exists on the project.

Reported drill results are highlighted by[1]:

  • An intercept of 43.2m @ 1.12% Cu and 31.35% Fe from depths of 1107 to 1050.2 meters in hole VDD24055 (positioned just below the existing “D Zone” resources).
  • An intercept of 13.3m @ 2.42% Cu and 4.96 g/t Ag from depths of 498.1 to 511.4 meters in drill hole VDD23116 (adjacent to the “B Zone” resources).

EMX considers these results to be salient and important to the valuation of its royalty interest. Viscaria has also reported that it is working to complete a feasibility study by year end and is currently working to update and bring its resource estimates into compliance with PERC (2021) reporting standards. EMX congratulates Viscaria Gruvaktiebolag on these successes and their recent progress.

EMX’s current royalty footprint covers the A, B and D zones and consists of a 0.5% NSR royalty that escalates to an uncapped 1% NSR royalty after $12 million has been paid to the royalty holder.

About the Viscaria Copper-Iron-Silver deposit. The Viscaria deposit is located just west of LKAB’s Kiruna iron mine, the largest underground iron mine in the world. Viscaria is typically classified as a member of the Iron-Oxide-Copper-Gold (“IOCG”) deposit clan and is broadly associated with similar iron and copper systems elsewhere in the region. The Viscaria mine was initially owned and operated by LKAB, which commenced operations in 1983. Outokumpu OY acquired the mine in 1985 and operated it until closure in 1993. Phelps Dodge Sweden AB later acquired the project from Outokumpu and then sold the project to Avalon Viscaria AB in 2008 and kept a royalty over the project area as part of its consideration. Avalon Viscaria AB later became the current Viscaria Gruvaktiebolag. EMX acquired Phelps Dodge Sweden AB in 2009, including the Viscaria royalty.

Dr. Eric P. Jensen, CPG, a Qualified Person as defined by National Instrument 43-101 and employee of the Company, has reviewed, verified and approved the disclosure of the technical information contained in this news release.

Notes about reported drill intersections. EMX has not performed sufficient work to verify the reported drill data and intersections. However, the samples were collected and reported by Viscaria in accordance with PERC (2021) reporting standards. EMX considers the reported drill data to be reliable and relevant.

About EMX. EMX is a precious and base metals royalty company. EMX’s investors are provided with discovery, development, and commodity price optionality, while limiting exposure to risks inherent to operating companies. The Company’s common shares are listed on the NYSE American Exchange and TSX Venture Exchange under the symbol “EMX”. Please see www.EMXroyalty.com for more information.

For further information contact:

David M. Cole
President and CEO
Phone: (303) 973-8585
Dave@EMXroyalty.com

Isabel Belger
Investor Relations
Phone: +49 178 4909039
IBelger@EMXroyalty.com

Neither the TSX Venture Exchange nor its Regulation Services Provider (as that term is defined in policies of the TSX Venture Exchange) accepts responsibility for the adequacy or accuracy of this release

Forward-Looking Statements

This news release may contain “forward looking statements” that reflect the Company’s current expectations and projections about its future results. These forward-looking statements may include statements regarding perceived merit of properties, exploration results and budgets, mineral reserves and resource estimates, work programs, capital expenditures, timelines, strategic plans, market prices for precious and base metal, or other statements that are not statements of fact. When used in this news release, words such as “estimate,” “intend,” “expect,” “anticipate,” “will”, “believe”, “potential” and similar expressions are intended to identify forward-looking statements, which, by their very nature, are not guarantees of the Company’s future operational or financial performance, and are subject to risks and uncertainties and other factors that could cause the Company’s actual results, performance, prospects or opportunities to differ materially from those expressed in, or implied by, these forward-looking statements. These risks, uncertainties and factors may include, but are not limited to unavailability of financing, failure to identify commercially viable mineral reserves, fluctuations in the market valuation for commodities, difficulties in obtaining required approvals for the development of a mineral project, increased regulatory compliance costs, expectations of project funding by joint venture partners and other factors.

Readers are cautioned not to place undue reliance on these forward-looking statements, which speak only as of the date of this news release or as of the date otherwise specifically indicated herein. Due to risks and uncertainties, including the risks and uncertainties identified in this news release, and other risk factors and forward-looking statements listed in the Company’s MD&A for the quarter ended June 30, 2024 (the “MD&A”), and the most recently filed Annual Information Form (“AIF”) for the year ended December 31, 2023, actual events may differ materially from current expectations. More information about the Company, including the MD&A, the AIF and financial statements of the Company, is available on SEDAR at www.sedarplus.ca and on the SEC’s EDGAR website at www.sec.gov.

Figure 1: Project Location

To view an enhanced version of this graphic, please visit:
https://images.newsfilecorp.com/files/1508/228378_f3ef2546349febcf_002full.jpg

Figure 2: 3D models of resources and current exploration program at Viscaria

To view an enhanced version of this graphic, please visit:
https://images.newsfilecorp.com/files/1508/228378_f3ef2546349febcf_003full.jpg


[1] True widths stated as “unknown”. These results were reported by Viscaria according to PERC 2021 standards in “Exploration Results, PERC (2021) Reporting standard, Table 1” on September 2024, and in Viscaria’s exploration update presentation dated September 24, 2024: “Viscaria: the next Tier-1 copper deposit in the world-class Kiruna mining district”.

To view the source version of this press release, please visit https://www.newsfilecorp.com/release/228378

Categories
Base Metals Energy Junior Mining Precious Metals

Gold79 Starts Drilling at Gold Chain Project, Arizona

Ottawa, Ontario–(Newsfile Corp. – October 31, 2024) – Gold79 Mines Ltd. (TSXV: AUU) (OTCQB: AUSVF) (“Gold79” or the “Company”) is pleased to announce that it has commenced drilling at its Gold Chain Project in Arizona. This next phase of drilling is expected to consist of seven core holes totaling approximately 1,000m.

Derek Macpherson, Executive Chairman, CEO and Director stated, “We are excited to continue drilling at Gold Chain following up on the drilling success from 2023. Importantly, the first hole of this new program will test below Hole No. GC23-28, which returned 51.1 g/t Au over 9.1m within a broad zone of gold mineralization recorded from surface to the end of hole. Also, this core program coupled with the prior work completed should move the Company one step closer to delivering a maiden resource at Tyro.”

Figure 1: Drill Rig at Gold Chain Project, Arizona, starting hole GC24-29

To view an enhanced version of Figure 1, please visit:
https://images.newsfilecorp.com/files/5717/228425_figure1.jpg

Drill Program

Planned drilling consists of seven HQ core holes, totaling approximately 1,000 metres to test along the Tyro Main structure as well as to depth, within the Gold Chain project. The core drilling program has been designed to provide additional geologic context to previous reverse circulation drilling; surface and underground mapping/sampling; and, the recently completed trenching program. Core holes are intended to confirm the geologic model and grade continuity along the nearly 1km strike. Increased confidence in the geologic model will assist Gold79 in the design of additional drill holes proposed for early 2025 to advance this target toward a maiden resource (Figure 2).

The final hole of the 2023 drill program, GC23-28, intersected 51.1 g/t Au over 9.1m at the intersection of the Whitespar fault and the Tyro Main zone within a broad zone of gold mineralization recorded from surface to the end of hole depth of 85.3m. Trenching conducted by Gold79 in May 2024 across this intersection returned 39.7 metres at 1.14 g/t Au and corroborated a N-NW trend to the Whitespar chalcedony vein swarm.

The first hole of the current program, GC24-29, is designed to traverse this zone beneath GC23-28 about 80 metres below the surface exposures. There are also one or two additional holes planned to test the intersection of these two structures.

The balance of the drill holes are designed to test the northeast-trending Tyro Main Zone vein grades, density and orientations along the main zone. Most of the holes will test the 500m drilling gap between hole GC23-23 which returned 44.2m at 2.10 g/t Au and GC21-16 which returned 21.2m at 1.73 g/t Au. Historical mining, geologic mapping and trenching support continuity along this zone.

It is anticipated that the results from this drill program should provide the data required to design a follow-up drill program. The follow-up program is expected to be completed in Q1 2025, following which the Company plans to complete a maiden resource estimate.

Figure 2: Tyro Main Zone Plan View with Proposed Drill Holes

To view an enhanced version of Figure 2, please visit:
https://images.newsfilecorp.com/files/5717/228425_56b2868134e03ab5_002full.jpg

Qualified Person / Quality Control and Quality Assurance

Robert Johansing, M.Sc. Econ. Geol., P. Geo., the Company’s Vice President, Exploration is a qualified person (“QP”) as defined by NI 43-101 and has reviewed and approved the technical content of this press release. Mr. Johansing has been responsible for all phases of work conducted to date at Gold Chain by Gold79.

About Gold79 Mines Ltd.

Gold79 Mines Ltd. is a TSX-V listed company focused on building ounces in the Southwest USA. Gold79 has four gold projects, two of which are partnered with major gold producers (Kinross at Jefferson Canyon and Agnico at Greyhound). Gold79 is focused on establishing a maiden resource at its Gold Chain project in Arizona and advancing its Tip Top Project in Nevada.

For further information regarding this press release contact:
Derek Macpherson, Executive Chairman and CEO, Gold79
Phone: 416-294-6713
Email: dm@gold79mines.com

Or

Quentin Mai, President, Gold79
Phone: 604-638-5622
Email: quentin@gold79mines.com

Website: www.gold79mines.com.
Book a 30-minute meeting with Derek Macpherson here.

Stay Connected with Us:
Twitter: @Gold79Mines
Facebook: https://www.facebook.com/Gold79Mines
LinkedIn: https://www.linkedin.com/company/gold79-mines-ltd/

FORWARD-LOOKING STATEMENTS:

This press release may contain forward-looking statements that are made as of the date hereof and are based on current expectations, forecasts and assumptions which involve risks and uncertainties associated with our business including the proposed amalgamation transaction with Bullet Exploration Inc., any future tranches of the current private placement or future private placements, the uncertainty as to whether further exploration will result in the target(s) being delineated as a mineral resource, capital expenditures, operating costs, mineral resources, recovery rates, grades and prices, estimated goals, expansion and growth of the business and operations, plans and references to the Company’s future successes with its business and the economic environment in which the business operates. All such statements are made pursuant to the ‘safe harbour’ provisions of, and are intended to be forward-looking statements under, applicable Canadian securities legislation. Any statements contained herein that are statements of historical facts may be deemed to be forward-looking statements. By their nature, forward-looking statements require us to make assumptions and are subject to inherent risks and uncertainties. We caution readers of this news release not to place undue reliance on our forward-looking statements as a number of factors could cause actual results or conditions to differ materially from current expectations. Please refer to the risks set forth in the Company’s most recent annual MD&A and the Company’s continuous disclosure documents that can be found on SEDAR at www.sedar.com. Gold79 does not intend, and disclaims any obligation, except as required by law, to update or revise any forward-looking statements whether as a result of new information, future events or otherwise.

Neither the TSX Venture Exchange nor its Regulation Services Provider (as that term is defined in the policies of the TSX Venture Exchange) accepts responsibility for the adequacy or accuracy of this release.

To view the source version of this press release, please visit https://www.newsfilecorp.com/release/228425

Categories
Base Metals Energy Junior Mining Oil & Gas Precious Metals

BOB MORIARTY | Expert Says Secondary Metals Will Star in New Bull Market

Major periods of rising gold prices since 1971 have included the 1970s and the 2000s. Many experts believe we’ve started a new period of such expansion now.

Spot prices touched a new record of US$2,769.02 per ounce on Tuesday “as the run-up to the 2024 presidential election and uncertainty prior to upcoming economic data kept safe haven demand in play,” Investing.com reported.

Bob Moriarty of 321gold sat down with Francis Hunt of The Market Sniper recently to discuss the state of the commodities markets and the recent meeting of the BRICS nations in Russia.

He told Hunt that the most important mechanism in determining their prices is not the textbook answer you’ve always been given.

“Ignore demand, ignore supply, ignore the value of the dollar, ignore the geopolitical, none of those make any difference whatsoever,” Moriarty said in the interview, posted on YouTube. “The only thing that moves the price of anything is sentiment.”

Sentiment Changing Soon

The Investing.com article reported by Scott Kanowsky said the rise is coming from safe haven demand and a string of expected economic readings expected soon, “which are likely to factor into in the Federal Reserve’s plans for interest rates.”

However, Moriarty said the overall price of gold miners has devalued vs. the price of gold and is “at the bottom now.”

“From a relative position of sentiment, everybody hates the miners,” he said of environmental and ESG concerns that have affected the industry. “You can go to Canada, and there’s probably 1,500 stocks, and the number of stocks under 10 cents is absolutely staggering. I own probably 50 different stocks, and I would guess 40 of them are under 10 centers per share . . . You don’t have to know anything about investing if you understand the sentiment.”

And Moriarty expects that sentiment to change soon.

“We’re going to be in a bull market probably for the next 10 or 20 years,” he said. “It has just started the real bull face. You’re going to see it in the other metals, and you’re absolutely going to see it in the miners. And I believe there are a lot of stocks that are going to go up 100-fold.”

But Moriarty said it won’t be just gold; other metals like silver, rhodium, palladium, and platinum will benefit, sometimes even more.

“Gold is going to continue to go up, but just like with dancing, sometimes you lead, sometimes you follow,” he said. “And I think it’s the secondary metals that are going to lead now.”

Most Valuable Precious Metal on the Planet?

Like gold, silver has had a good year so far and is up 42.17%, according to USA Today. It was trading at US$34.02 per ounce on Tuesday, an increase of 1.26% in the previous 24 hours.  Platinum, which was US$1,025.65 per ounce on Monday, is up 3.84% on the year.

But in addition to gold, silver and platinum, the platinum group contains lesser-known metals like osmium, ruthenium, iridium, palladium, and rhodium.

The metals are all very rare and have high corrosion resistance, catalytic properties, and high melting points, according to How Stuff Works.

But Mack Hayden wrote for the site that rhodium, a silver-white metal, is “the most valuable precious metal on the planet.” The automotive industry uses nearly 80% of the world’s supply to make catalytic converters that help reduce toxic gas emissions. South Africa is the leading producer, contributing about 80% of the global supply. It is often found mixed with other platinum group metals and requires extensive processing to extract.

Trading Economics said rhodium has increased US$250 per ounce or 5.65% since the beginning of 2024. While it was US$4,675 per ounce on Monday, it reached an all-time high of US$29,800 per ounce in 2021 — nearly 10 times gold’s current record price.

Hunt pointed out that two of the major producers of platinum, palladium, and rhodium are Russia and South Africa, two members of the BRICS group of nations that met earlier this month in Russia.

“They control price; that’s a big deal,” Moriarty agreed. “We’re going to see some real financial shocks with silver, with rhodium, with palladium, and with platinum.”

BRICS Group Expanding

BRICS is an intergovernmental organization that includes Brazil, Russia, India, China, South Africa, Iran, Egypt, Ethiopia, and the United Arab Emirates. At its October meeting, it expanded to add 13 new “partner nations.”

At the meeting, China President Xi Jinping referred to BRICS as “a vanguard for advancing global governance reform” and “reform of the international financial architecture.”

Bolivian President Luis Arce said, “the shield of BRICS and multipolarity” can protect formerly colonized nations, helping them resist “Western unipolarity and the tyranny of the dollar.”

With gold hitting record highs and silver rising, the other platinum group metals are nowhere near their eventual highs, Moriarty said.

“The Russians understand this, and they’re going to start buying palladium, they’re going to start buying rhodium, and they’re going to start buying silver because those metals are going to move faster and higher than gold,” he said, predicting record highs for all three.

Source: https://www.streetwisereports.com/article/2024/10/30/expert-says-secondary-metals-will-star-in-new-bull-market.html

Categories
Base Metals Energy Junior Mining Oil & Gas Precious Metals

Euro zone inflation picks up, bolstering case for caution in rate cuts

Reuters

Thu, October 31, 2024 

FRANKFURT (Reuters) – Euro zone inflation accelerated more than expected in October and could still pick up further in the coming months, bolstering the case for caution in European Central Bank interest rate cuts as price growth is not yet fully tamed.

Inflation in the 20 countries sharing the euro currency accelerated to 2.0% from 1.7% in September mostly on higher food and energy costs, coming above expectations for 1.9% in a Reuters poll of economists.

A more closely watched figure which strips out volatile food and energy prices meanwhile held steady at 2.7%, above forecasts for 2.6%, Eurostat said on Thursday.

Inflation has fallen quickly since hitting double digit territory two years ago and most economists see it back at the European Central Bank’s 2% target basis sometime in the first half of next year after some volatility in the final months of 2024.

This relatively quick return to target has also fuelled a debate in recent weeks, with some ECB officials arguing there was a growing risk that price growth will actually fall below target and the ECB will have to start stimulating growth to prevent excessively low inflation.

Such a dim outlook could even force the ECB to accelerate the pace of rate cuts and bolster the case for a bigger than usual step in December, some said.

This argument has yet to gain significant traction, however, and conservatives, or policy hawks in central bank-speak, have pushed back, arguing for measured, incremental steps because a long list of factors could still push prices higher.

A key concern is that inflation in services, the biggest single item in the consumer price basket remains way too fast, holding steady at 3.9%.

Wage growth is also faster than the 3% rate the ECB considers consistent with its target and households are sitting on ample savings, which could bolster consumer savings and overall growth.

The labour market also remains tight with the jobless rate holding steady at an all-time low of 6.3% in September, separate Eurostat data showed on Thursday.

The policy doves’ argument that overall growth is simply too weak to sustain 2% inflation was also dealt a blow this week when fresh data showed the economy expanding at 0.4% in the third quarter, twice as fast as expected, with Germany, France and Spain all showing surprising resilience.

But economists also appear to agree that no meaningful rebound in growth was likely and the euro zone will continue to grow at a lukewarm pace, below what is considered its potential.

That is why further ECB rate cuts are almost assured and no policymaker has challenged the need to move again on Dec. 12, suggesting that the step is largely a done deal, unless major data surprises alter the outlook.

Financial investors are now betting that the ECB’s 3.25% deposit rate could dip to 2% or possibly below that by the end of 2025.

The biggest uncertainty, however, is likely to be the U.S. election, policymakers say, since it could have far reaching implications for trade, growth and inflation which may require policy action further down the road.

(Reporting by Balazs Koranyi; Editing by Toby Chopra)

Source: https://finance.yahoo.com/news/euro-zone-inflation-picks-bolstering-100558761.html