Cycles surround us. In markets, astronomy, and our lives.
Every day is a circadian cycle for us all. Our bodies move through phases based on our exposure to light or darkness.
Markets are also remarkably cyclical, responding to the environment around them. Interest rates, regulation, monetary policy and investor psychology all play important roles.
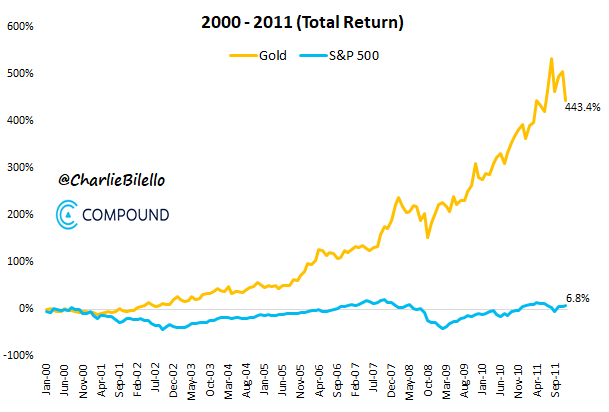
Precious metals are no different. The sector’s performance ebbs and flows over time.
An even better example is from 1972 to 1980 when gold returned 1,256% to the S&P 500’s 97%.
Of course, stocks take their turn in the spotlight too.
From 2012 to 2021, stocks returned 336% vs gold’s 16%. And from 1980 to 1999, stocks were absolutely dominant as gold went dormant for nearly two decades.
Over the past few years, both have done well.
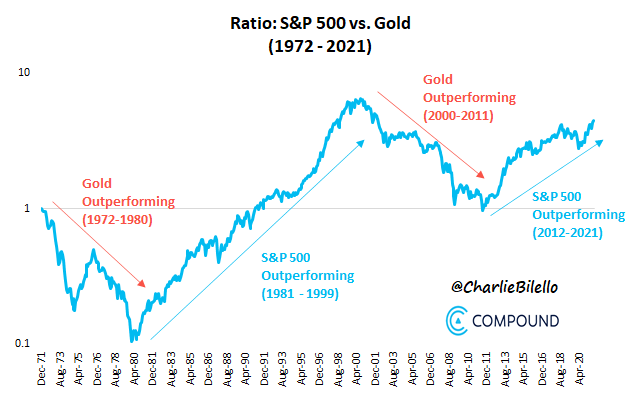
The point here is that it’s a cycle.
Just take a look at the chart below. It shows the ratio of S&P 500 performance vs gold through 2021.
I believe we switched back to precious metals mode at the beginning of this year. And if this is the beginning of a fresh cycle, we may be in for another 7-plus years of precious metals outperforming stocks.
Given the magnitude of what we’re facing, it could go on longer than that.
Catalysts and Causes
Periods where gold outperforms tend to be chaotic.
Past catalysts have included a crash at the end of a major bull market (1971 and 2000), and an inflationary shift in monetary policy (1971 and 2000).
Wars often play a part as well, as they did in the 1970s (Vietnam and others), and the early 2000s (War on Terror). Wars spike deficits and increase the monetary supply. They also drive safe-haven demand from both central banks and investors.
I believe our situation today fits the bill.
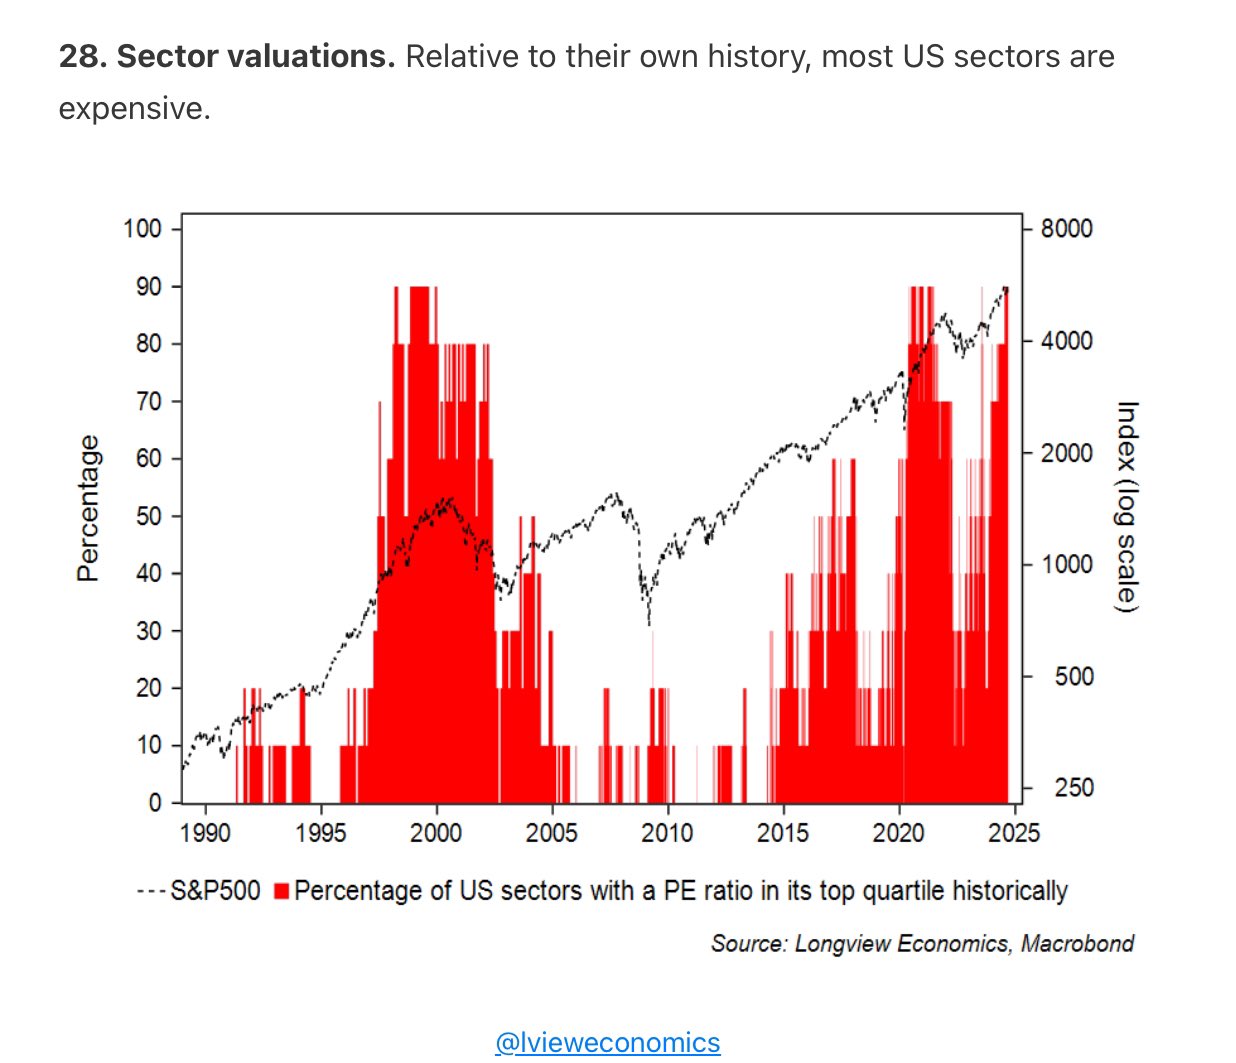
Stocks are still doing well, for now, but markets look expensive. The chart below, from Longview Economics, shows that 90% of U.S. stock sectors are in their top quartile (25%) of historical valuations.
Stocks are richly valued across almost the entire board. This tends to happen near market peaks. And I don’t see any positive catalysts hiding around the corner to drive sustainable real growth.
Of course, the broad bubble in U.S. stocks could go on for longer than we expect, but at this point, I’m more focused on precious metals and even certain foreign markets.
To be clear, I do own U.S. stocks and will continue to.
But during times like these, I lower that exposure and boost my allocation to alternatives, particularly gold and silver.
Macro Looks Bullish for Gold
The U.S. and many other countries are reaching a tipping point with debt. Total global debt just reached $315 trillion, which is 333% of global GDP.
The Federal Reserve just switched into easy-money mode and is likely to fire up formal QE in the near future. China’s central bank just injected massive liquidity to boost its sluggish economy. More countries will follow suit, and global liquidity is poised to surge.
In addition, we have multiple wars and conflicts raging in Yemen, Ukraine, Israel, Iran and beyond. Nascent proxy wars between the US and Russia are quietly breaking out in multiple African countries.
Military spending is booming, with Russia increasing its annual defense spending to 40% of its total budget. And China’s defense spending now rivals the U.S. in terms of purchasing power parity (PPP). Naturally, the U.S. is no slouch in this area and is also ramping up spending and production.
Durable Catalysts
The stage is set for a powerful precious metals bull market cycle. The problems facing the world are not going away anytime soon. Even if all the conflicts end tomorrow, and they won’t, we’re still facing a structural debt problem of unprecedented magnitude.
Further conflict and spending will just add gas to the fire.
For now, markets seem complacent that all is well with the economy. It won’t last forever. If we get a nice pullback in gold and silver here, and we may well, it’ll be an amazing opportunity to stack up. I will continue to buy on pullbacks.
Toronto, Ontario–(Newsfile Corp. – October 10, 2024) – Derek Macpherson of Toronto, Ontario acquired personally 240,000 units of Gold79 Mines Ltd. (“Gold79” or the “Company”) comprising 240,000 common shares and 120,000 warrants, at a price of $0.25 per unit for a purchase price of $60,000, in a private placement that closed on October 9, 2024. Each unit consists of one common share and one-half common share purchase warrant of the Company. Each whole warrant is exercisable for $0.40 per share until their expiry on October 9, 2026. All securities issued to Mr. Macpherson pursuant to the placement are subject to a statutory hold period which expires February 10, 2024.
Immediately prior to the private placement, Mr. Macpherson and joint actors Kanaga Capital Corp. and Olive Resource Capital Inc. owned 1,725,400 common shares of the Company, representing 7.7% of the then issued and outstanding common shares of the Company. As a result of the private placement, Mr. Macpherson’s and joint actors’ ownership of the issued and outstanding common shares of the Company decreased from 7.7% to 6.3% on an undiluted basis. In addition, if Mr. Macpherson and joint actors were to exercise all of their warrants and stock options of the Company, they would own 3,374,150 common shares of the Company, representing 10.4% of the issued and outstanding common shares of the Company on a partially-diluted basis, assuming no further common shares of the Company have been issued.
Mr. Macpherson acquired the securities for investment purposes. Mr. Macpherson may, depending on market and other conditions, increase or decrease his beneficial ownership of the Company’s securities, whether in the open market, by privately negotiated agreements or otherwise, subject to a number of factors, including general market conditions and other available investment and business opportunities.
The disclosure respecting Mr. Macpherson’s shareholdings contained in this press release is made pursuant to National Instrument 62-103 and a copy of the report in respect of the above acquisition will be filed with applicable securities commissions using the Canadian System for Electronic Document Analysis and Retrieval (SEDAR+) and will be available on Gold79’s SEDAR+ profile (www.sedarplus.ca). A copy may be obtained by contacting Gold79 as noted under “Contact” below.
For further information regarding this press release contact: Derek Macpherson, President & CEO of Gold79 Mines Ltd. Phone: 416-294-6713 Email: dm@gold79mines.com
elowna, British Columbia–(Newsfile Corp. – October 10, 2024) – F3 Uranium Corp. (TSXV: FUU) (OTC Pink: FUUFF) (“F3 Uranium” or the “Company“) is pleased to announce that due to significant investor demand, the Company has increased the gross proceeds of its previously announced private placement (the “Underwritten Offering“) to C$7,000,000. Under the revised Underwritten Offering, the Underwriters (as defined herein) have agreed to purchase for resale 17,500,000 flow-through units of the Company to be sold to charitable purchasers (each, a “Charity FT Unit“) at a price of C$0.40 per Charity FT Unit (the “Offering Price“) on a “bought deal” basis. Red Cloud Securities Inc. is acting as lead underwriter and sole bookrunner on behalf of a syndicate of underwriters (collectively, the “Underwriters“).
Each Charity FT Unit will consist of one common share of the Company (each, a “Common Share“) to be issued as a “flow-through share” within the meaning of subsection 66(15) of the Income Tax Act (Canada) (each, a “FT Share“) and one half of one Common Share purchase warrant (each whole warrant, a “Warrant“). Each whole Warrant shall entitle the holder to purchase one Common Share (each, a “Warrant Share“) at a price of C$0.40 at any time on or before that date which is 24 months after the Closing Date (as herein defined).
The Company will grant to the Underwriters an option, exercisable up to 48 hours prior to the Closing Date, to purchase for resale up to an additional 2,500,000 Charity FT Units at the Offering Price for additional gross proceeds of up to C$1,000,000 (the “Over-Allotment Option“, and together with the Underwritten Offering, the “Offering“).
The Company shall have the right to include a list of subscribers to purchase up to 1,250,000 Charity FT Units at the Offering Price for gross proceeds of up to C$500,000 under the Offering (the “President’s List“). The President’s List shall be allocated under the Over-Allotment Option and, for greater certainty, all purchasers under the Over-Allotment Option shall receive Non-LIFE CFT Units (as defined herein) on the terms of the Offering and subject to the resale restrictions noted herein.
Up to 12,500,000 Charity FT Units sold pursuant to the Underwritten Offering (the “LIFE CFT Units“), representing gross proceeds of C$5,000,000, will be offered by way of the “listed issuer financing” exemption under Part 5A (the “LIFE Exemption“) under National Instrument 45-106 – Prospectus Exemptions (“NI 45-106“) in all the provinces of Canada with the exception of Quebec (the “Selling Jurisdictions“). The FT Shares and Warrant Shares issuable pursuant to the sale of the LIFE CFT Units are expected to be immediately freely tradeable under applicable Canadian securities legislation if sold to purchasers resident in Canada. The remaining 5,000,000 Charity FT Units sold pursuant to the Underwritten Offering as well as the Charity FT Units that may be sold under the Over-Allotment Option (collectively, the “Non-LIFE CFT Units“), which includes the Charity FT Units sold under the President’s List, will be offered by way of the “accredited investor” and “minimum amount investment” exemptions under NI 45-106 in the Selling Jurisdictions. The FT Shares and Warrant Shares issuable pursuant to the sale of Non-LIFE CFT Units will be subject to a hold period in Canada ending on the date that is four months plus one day following the closing of the Offering as defined in Subsection 2.5(2) of Multilateral Instrument 45-102 – Resale of Securities.
The Offering is expected to close on October 31, 2024 (the “Closing Date“). The proceeds of the Offering will be used by the Company to fund the exploration of the Company’s projects in the Athabasca Basin.
There is an offering document related to the Offering that can be accessed under the Company’s profile at www.sedarplus.ca and at the Company’s website at www.f3uranium.com. Prospective investors should read this offering document before making an investment decision.
About F3 Uranium Corp.
F3 Uranium is a uranium exploration company advancing its newly discovered high-grade JR Zone and exploring for additional mineralized zones on its 100%-owned Patterson Lake North (PLN) Project in the southwest Athabasca Basin. PLN is accessed by Provincial Highway 955, which transects the property, and the new JR Zone discovery is located ~25km northwest of Fission Uranium’s Triple R and NexGen Energy’s Arrow high-grade uranium deposits. This area is poised to become the next major area of development for new uranium operations in northern Saskatchewan. The PLN project is comprised of the PLN, Minto and Broach properties. The Broach property incorporates the former PW property which was obtained from CanAlaska as a result of a property swap.
The TSX Venture Exchange has not reviewed, approved or disapproved the contents of this press release, and do not accept responsibility for the adequacy or accuracy of this release.
F3 Uranium Corp. 750-1620 Dickson Avenue Kelowna, BC V1Y9Y2
Contact Information Investor Relations Telephone: 778 484 8030 Email: ir@f3uranium.com
ON BEHALF OF THE BOARD
“Dev Randhawa” Dev Randhawa, CEO
Cautionary Statement:F3 Uranium Corp.
This press release contains “forward-looking information” within the meaning of applicable Canadian and United States securities laws, which is based upon the Company’s current internal expectations, estimates, projections, assumptions and beliefs. The forward-looking information included in this press release are made only as of the date of this press release. Such forward-looking statements and forward-looking information include, but are not limited to, statements concerning the Company’s expectations with respect to the Offering; the use of proceeds of the Offering; completion of the Offering and the date of such completion. Forward-looking statements or forward-looking information relate to future events and future performance and include statements regarding the expectations and beliefs of management based on information currently available to the Company. Such forward-looking statements and forward-looking information often, but not always, can be identified by the use of words such as “plans”, “expects”, “potential”, “is expected”, “anticipated”, “is targeted”, “budget”, “scheduled”, “estimates”, “forecasts”, “intends”, “anticipates”, or “believes” or the negatives thereof or variations of such words and phrases or statements that certain actions, events or results “may”, “could”, “would”, “might” or “will” be taken, occur or be achieved.
Forward-looking statements or forward-looking information are subject to a variety of risks and uncertainties which could cause actual events or results to differ materially from those reflected in the forward-looking statements or forward-looking information, including, without limitation, risks and uncertainties relating to: general business and economic conditions; regulatory approval for the Offering; completion of the Offering; changes in commodity prices; the supply and demand for, deliveries of, and the level and volatility of the price of uranium and other metals; changes in project parameters as exploration plans continue to be refined; costs of exploration including labour and equipment costs; risks and uncertainties related to the ability to obtain or maintain necessary licenses, permits or surface rights; changes in credit market conditions and conditions in financial markets generally; the ability to procure equipment and operating supplies in sufficient quantities and on a timely basis; the availability of qualified employees and contractors; the impact of value of the Canadian dollar and U.S. dollar, foreign exchange rates on costs and financial results; market competition; exploration results not being consistent with the Company’s expectations; changes in taxation rates or policies; technical difficulties in connection with mining activities; changes in environmental regulation; environmental compliance issues; other risks of the mining industry; and risks related to the effects of COVID-19. Should one or more of these risks and uncertainties materialize, or should underlying assumptions prove incorrect, actual results may vary materially from those described in forward-looking statements or forward-looking information. Although the Company has attempted to identify important factors that could cause actual results to differ materially, there may be other factors that could cause results not to be as anticipated, estimated or intended. For more information on the Company and the risks and challenges of its business, investors should review the Company’s annual filings that are available at www.sedarplus.ca. The forward-looking statements included in this press release are made as of the date of this press release and F3 Uranium Corp. disclaim any intention or obligation to update or revise any forward-looking statements, whether as a result of new information, future events or otherwise, except as expressly required by applicable securities legislation.
Ottawa, Ontario–(Newsfile Corp. – October 10, 2024) – Gold79 Mines Ltd. (TSXV: AUU) (OTCQB: AUSVF) (“Gold79” or the “Company”) is pleased to announce the closing of a first tranche of its previously announced $4,000,000 non-brokered private placement financing (the “Offering”), raising gross proceeds of $2,190,000 through the issuance of 8,760,000 units at $0.25 per unit.
Each unit consists of one common share of the Company and one-half common share purchase warrant. A total of 4,380,000 whole warrants were issued, with each warrant entitling the holder to purchase one common share of the Company at a price of $0.40 per share until October 9, 2026. The warrants are callable, at the option of the Company, in the event that the 20-day volume-weighted average price of the Company’s common share meets or exceeds $0.60 for ten consecutive trading days based on trades on the TSX Venture Exchange (“TSX-V”) and Alternative Trading Systems. Subscribers will be notified of the call provision being triggered and will have a 30-day period to exercise the warrants.
Warrants will contain provisions that prohibit the exercise by the holder, together with its affiliates, which would result in the holder, together with its affiliate, beneficially owning in excess of 9.99% of the issued and outstanding common shares of the Company immediately after giving effect to such exercise of the Warrant.
“We are pleased to close the first tranche of this financing allowing us to resume drilling at Gold Chain this month. Importantly, with the first hole of this new drill program, we plan to follow up hole GC23-28 at Tyro, which returned 9.1m at 51.1 g/t Au”, Derek Macpherson, President, CEO & Director stated. “The closing of this first tranche of the financing represents an exciting turning point for Gold79, and the completion of the balance of this financing and the transaction with Bullet Exploration Inc. will allow us to advance the Company’s projects, in particular Gold Chain, more aggressively.”
Additionally, the Company is pleased to announce that as a result of closing this first tranche of the financing it has begun preparation for a 1,000m core drilling campaign at its Gold Chain project in northwest Arizona.
This program represents the next step in the Company’s efforts to define a maiden resource at the Tyro Main Zone. Drilling is expected to commence later this month and will be completed in Q4 2024. In Figure 1, the Company has outlined the tentatively planned hole locations at Tyro. The Company will provide further updates on the drill program as work progresses.
Figure 1: Tyro Main Zone Plan View with Proposed Drill Holes
In connection with this first tranche closing of the Offering, cash finder’s fees of $37,800 were paid, and 151,200 finder warrants were issued. The finder warrants are exercisable at $0.40 per share and expire October 9, 2026.
This private placement is subject to the final approval of the TSX-V. All securities issued in the first tranche of the placement are subject to a statutory hold period until February 10, 2025. It is expected that the next and potentially final tranche of the Offering would be closed later this month.
Officers and directors of the Company participated in the private placement and acquired 600,000 units for $150,000. The participation of these insiders in the private placement constitutes a Related Party Transaction within the meaning of Multilateral Instrument 61-101 Protection of Minority Security Holders in Special Transactions (“MI 61-101”). The board of directors of the Company, with participating directors abstaining, determined that the transaction is exempt from the formal valuation and minority shareholder approval requirements contained in sections 5.5(a) and 5.7(1)(a) of MI 61-101 for the related party transaction, as neither the fair market value of securities issued to the insiders nor the consideration paid by the insiders exceeded 25 percent of the Company’s market capitalization. The Company did not file a material change report in respect of the transaction 21 days in advance of the closing of the private placement because insider participation had not been confirmed. The shorter period was necessary in order to permit the Company to close the private placement in a timeframe consistent with usual market practice for transactions of this nature.
Proceeds raised in the placement will be used for exploration expenditures related to the Gold Chain, Arizona, project; property claim costs and contractual property payments; costs associated with the transaction with Bullet Exploration Inc., assuming the closing of the transaction with Bullet Exploration Inc. exploration expenditures related to the Jefferson North, Nevada, project and, for working capital and general corporate purposes.
The securities issued in the private placement will not be registered under the United States Securities Act of 1933, as amended (the “U.S. Securities Act”) and may not be offered or sold within the United States or to or for the account or benefit of U.S. persons, except in certain transactions exempt from the registration requirements of the U.S. Securities Act. This press release does not constitute an offer to sell, or the solicitation of an offer to buy, securities of the Company in the United States.
Transaction Summary
Gold79 is pursuing the Offering for $4,000,000 in total in connection with its previously announced proposed amalgamation agreement with its wholly-owned subsidiary and Bullet Exploration Inc. (“Bullet”) to acquire all of the issued and outstanding shares of Bullet (the “Transaction”). The Transaction and the Offering are expected to create a well-funded gold exploration company focused on the southwest United States
Pursuant to the Transaction, Bullet shareholders will receive one (1) Gold79 common share for every three (3) Bullet common shares held. Existing shareholders of Gold79 and Bullet will hold approximately 54% and 46%, respectively, of the outstanding Gold79 shares on closing of the Transaction on a fully diluted, in-the-money basis (but prior to the completion of the Offering).
Additional details relating to the Transaction can be found in Gold79’s September 4, 2024 press release. Full details of the Transaction will be provided in the management information circular of Bullet to be prepared and filed in respect of the annual and special meeting of the Bullet shareholders to be held on November 25, 2024.
The closing of one or more tranches of the Offering are not contingent upon the closing of the Transaction. There can be no assurances that the Transaction will be completed and the proceeds from the Offering may be used entirely by Gold79 whether or not the Transaction is completed.
About Gold79 Mines Ltd.
Gold79 Mines Ltd. is a TSX-V listed company focused on building ounces in the Southwest USA. Gold79 has four gold projects, two of which are partnered with major gold producers (Kinross at Jefferson Canyon and Agnico at Greyhound). Gold79 is focused on establishing a maiden resource at its Gold Chain project in Arizona and advancing its Tip Top Project in Nevada.
For further information regarding this press release contact: Derek Macpherson, President & CEO Phone: 416-294-6713 Email: dm@gold79mines.com Website: www.gold79mines.com.
This press release may contain forward looking statements that are made as of the date hereof and are based on current expectations, forecasts and assumptions which involve risks and uncertainties associated with our business including the proposed Transaction, any future tranches of the current private placement or future private placements, the uncertainty as to whether further exploration will result in the target(s) being delineated as a mineral resource, capital expenditures, operating costs, mineral resources, recovery rates, grades and prices, estimated goals, expansion and growth of the business and operations, plans and references to the Company’s future successes with its business and the economic environment in which the business operates. All such statements are made pursuant to the ‘safe harbour’ provisions of, and are intended to be forward-looking statements under, applicable Canadian securities legislation. Any statements contained herein that are statements of historical facts may be deemed to be forward-looking statements. By their nature, forward-looking statements require us to make assumptions and are subject to inherent risks and uncertainties. We caution readers of this news release not to place undue reliance on our forward-looking statements as a number of factors could cause actual results or conditions to differ materially from current expectations. Please refer to the risks set forth in the Company’s most recent annual MD&A and the Company’s continuous disclosure documents that can be found on SEDAR at www.sedar.com. Gold79 does not intend, and disclaims any obligation, except as required by law, to update or revise any forward-looking statements whether as a result of new information, future events or otherwise.
Neither the TSX Venture Exchange nor its Regulation Services Provider (as that term is defined in the policies of the TSX Venture Exchange) accepts responsibility for the adequacy or accuracy of this release.
NOT FOR RELEASE OR DISTRIBUTION IN THE UNITED STATES OR FOR DISSEMINATION TO U.S NEWS WIRE SERVICES
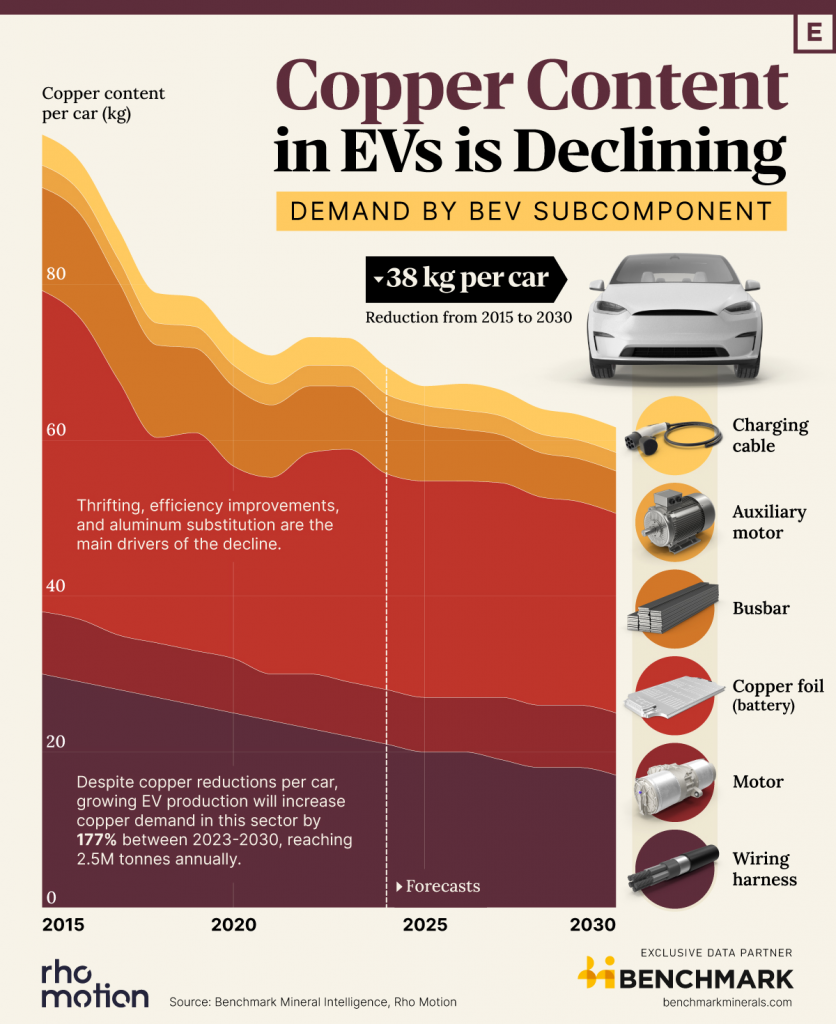
Copper intensity in passenger battery electric vehicles (BEVs) has steadily decreased over the last decade, driven by numerous technological advancements alongside increasing usage of alternative materials such as aluminum.
In this graphic, we visualize the evolution of copper demand in various subcomponents of passenger battery electric vehicles (BEVs) from 2015 to 2030F, along with total global copper demand driven by EVs for the same period. This data comes exclusively from Benchmark Mineral Intelligence.
Year
Wiring
Motor
Copper Foil
Busbar
Auxiliary Motor
Charging Cable
Total
2015
30
8
41.26
13.23
2.87
3.96
99.32
2016
29
8
38.68
13.37
2.85
3.92
95.82
2017
28
7
32.67
12.72
2.84
3.90
87.13
2018
27
7
26.39
11.87
2.82
3.88
78.96
2019
26
7
28.00
10.85
2.78
3.82
78.45
2020
25
7
24.71
10.24
2.73
3.76
73.44
2021
24
6
25.27
9.29
2.69
3.70
70.95
2022
23
7
28.44
8.56
2.65
3.64
73.29
2023
22
7
29.87
8.12
2.61
3.58
73.18
2024F
21
7
27.73
7.67
2.56
3.52
69.48
2025F
20
7
27.79
7.19
2.52
2.51
67.01
2026F
20
7
27.78
6.63
2.48
3.41
67.30
2027F
19
8
27.55
6.15
2.44
3.35
66.49
2028F
18
8
26.77
5.70
2.40
3.30
64.17
2029F
18
8
26.17
5.51
2.39
3.28
63.35
2030F
17
8
25.63
5.44
2.37
3.26
61.70
Copper Intensity Per Car
According to Benchmark Mineral Intelligence, the copper intensity per vehicle is expected to decline by almost 38 kg, from 99 kg in 2015 to 62 kg by 2030.
One of the most significant factors driving this decline is thrifting, where engineers and manufacturers continuously improve the efficiency and performance of various components, leading to reduced copper usage. A key example of this is in battery production, where the thickness of copper foil used in battery anodes has significantly decreased.
In 2015, Benchmark estimated copper foil usage was just over 41 kg per vehicle (at an average thickness of 10 microns), but by 2030, it is projected to fall to 26 kg as manufacturers continue to adopt thinner foils.
Similarly, automotive wiring systems have become more localized, with advances in high-voltage wiring and modular integration allowing for reduced copper content in wiring harnesses.
Copper used in wiring has dropped from 30 kg per vehicle in 2015 to a projected 17 kg by 2030.
Newer, more compact power electronics and improved thermal management in motors and charging cables have also contributed to the reduction in copper usage.
Substitution has also played a role, with alternatives such as aluminum increasingly being used in components like busbars, wiring harnesses, and charging cable applications.
Aluminum’s lighter weight and lower cost have made it a practical alternative to copper in specific applications, though the additional space required to achieve the same level of conductivity can limit its use in certain cases.
Benchmark estimates that copper used in automotive wire harnesses has declined by 30% between 2015 and 2024.
The Road Ahead
Despite reductions in per-vehicle copper usage, the outlook for copper demand from the EV sector remains strong due to the sector’s growth.
Year
EV Sector Copper Demand (tonnes)
2015
56K
2016
82K
2017
111K
2018
166K
2019
179K
2020
237K
2021
447K
2022
696K
2023
902K
2024F
1.0M
2025F
1.2M
2026F
1.5M
2027F
1.7M
2028F
2.0M
2029F
2.2M
2030F
2.5M
Benchmark’s analysis indicates that by 2030, copper demand driven by EVs alone will exceed 2.5 million tonnes, securing copper’s critical role in the transition to a low-carbon future.
Kelowna, British Columbia–(Newsfile Corp. – October 9, 2024) – F3 Uranium Corp. (TSXV: FUU) (OTC Pink: FUUFF), Dev Randhawa, Chairman & CEO, is pleased to announce that the company will be presenting at Red Cloud’s Fall Mining Showcase. We invite our shareholders and all interested parties to join us there.
The annual conference will be hosted in-person, at the Sheraton Centre Toronto Hotel on October 16 & 17, 2024.
Management from F3 Uranium Corp. will be holding one-on-one investor meetings throughout the three-day conference.
F3 Uranium is a uranium exploration company advancing its newly discovered high-grade JR Zone and exploring for additional mineralized zones on its 100%-owned Patterson Lake North (PLN) Project in the southwest Athabasca Basin. PLN is accessed by Provincial Highway 955, which transects the property, and the new JR Zone discovery is located ~25km northwest of Fission Uranium’s Triple R and NexGen Energy’s Arrow high-grade uranium deposits. This area is poised to become the next major area of development for new uranium operations in northern Saskatchewan.
Kelowna, British Columbia–(Newsfile Corp. – October 9, 2024) – Strathmore Uranium Corp, (TSXV: SUU) (OTCQB: SUUFF), Strathmore Uranium, is pleased to announce that the company will be presenting at Red Cloud’s Fall Mining Showcase. We invite our shareholders and all interested parties to join us there.
The annual conference will be hosted in-person, at the Sheraton Centre Toronto Hotel on October 16 & 17, 2024.
Dev Randhawa – Chairman & CEO will be presenting on October 17th at 4:00 PM Eastern Standard time.
Strathmore has three permitted uranium projects in Wyoming. Agate, Beaver Rim, and Night Owl. The Agate and Beaver Rim properties contain uranium mineralization in typical Wyoming-type roll front deposits based on historical and recent drilling data. The Night Owl property is a former producing surface mine that was in production in the early 1960s.
Vancouver, British Columbia–(Newsfile Corp. – October 4, 2024) – EMX Royalty Corporation (NYSE American: EMX) (TSXV: EMX) (FSE: 6E9) (the “Company” or “EMX“) is pleased to announce it has recently repurchased shares in a block trade from an undisclosed seller via its existing Normal Course Issuer Bid (“NCIB”) in the amount of two million shares at a price of C$2.05, totaling C$4.1 million or approximately US$3.0M. Since the NCIB was announced on February 7, 2024, EMX has purchased a total of 2,805,346 shares at an average price of C$2.15, totaling approximately C$6.0M. EMX may purchase a remaining 2,194,654 shares under the current NCIB program expiring February 13, 2025.
EMX CEO Dave Cole commented “EMX is committed to astute allocation of capital. We believe EMX shares are undervalued. Buybacks at these levels should provide exceptional risk-adjusted returns on capital.”
About EMX – EMX is a precious and base metals royalty company. EMX’s investors are provided with discovery, development, and commodity price optionality, while limiting exposure to risks inherent to operating companies. The Company’s common shares are listed on the NYSE American Exchange and TSX Venture Exchange under the symbol “EMX”. Please see www.EMXroyalty.com for more information.
Neither the TSX Venture Exchange nor its Regulation Services Provider (as that term is defined in policies of the TSX Venture Exchange) accepts responsibility for the adequacy or accuracy of this release
Forward-Looking Statements
This news release may contain “forward-looking statements” that reflect the Company’s current expectations and projections about its future results, but which are not statements of fact. When used in this news release, words such as “estimate,” “intend,” “expect,” “anticipate,” “will”, “believe”, “potential” and similar expressions are intended to identify forward-looking statements, which, by their very nature, are not guarantees of the Company’s future operational or financial performance, and are subject to risks and uncertainties and other factors that could cause the Company’s actual results, performance, prospects or opportunities to differ materially from those expressed in, or implied by, these forward-looking statements. These risks, uncertainties and factors may include, but are not limited to the Company being unable to comply with the covenants under the Credit Agreement, including the repayment of any amounts owing under the Loan, and other factors.
Readers are cautioned not to place undue reliance on these forward-looking statements, which speak only as of the date of this news release or as of the date otherwise specifically indicated herein. Due to risks and uncertainties, including the risks and uncertainties identified in this news release, and other risk factors and forward-looking statements listed in the Company’s MD&A for the quarter ended June 30, 2024 (the “MD&A”), and the most recently filed Annual Information Form (“AIF”) for the year ended December 31, 2023, actual events may differ materially from current expectations. More information about the Company, including the MD&A, the AIF and financial statements of the Company, is available on SEDAR+ at www.sedarplus.caand on the SEC’s EDGAR website atwww.sec.gov.
VANCOUVER, BC / ACCESSWIRE / October 3, 2024 / Granite Creek Copper Ltd. (TSXV:GCX)(OTCQB:GCXXF) (“Granite Creek” or the “Company”) is pleased to announce that the now completed 2024 drill campaign on at its wholly owned Carmacks copper-gold-silver project located in central Yukon, Canada yielded the discovery of a new mineralized zone.
The drill program consisted of 1420 metres in four drill holes, designed to test new targets adjacent to existing high-grade, pit-constrained resources, and was successful in locating and partially delineating the Gap Zone. The newly discovered zone was traced for approximately 170 meters and remains open along strike and at depth, with copper mineralisation observed in three of four drill holes. The Gap Zone lies between the proposed 147 and 2000S pits and was first identified by a 2022 geophysical IP survey (see news release dated November 21, 2022). Likely representing a fault offset from the main 147 Zone, the Gap Zone has the potential to add significant tonnage and extend the mine life envisioned by the 2023 Preliminary Economic Assessment (see news release dated January 19, 2023)
Mineralized sections have been sampled and delivered to the lab for analysis with results pending. Observed mineralization and host rocks were similar in appearance to known ore zones on the property.
Figure 1 – Gap Zone plan view showing drill locations and trace
Granite Creek President and CEO, Timothy Johnson, stated, “We are pleased to confirm the effectiveness of the induced polarity geophysical technique in predictive targeting of mineralization at the Carmacks project. Despite a long history of exploration on the project primarily focused on the 147 Zone, new discoveries can and will continue to be made on our Carmacks copper-gold-silver project. The project hosts significant copper-gold-silver resources and has the potential for expansion throughout the 177 square kilometre land package in this top mining jurisdiction.”
Carmacks Deposit
The 177 sq km, Carmacks project contains over 824 Mlbs Measured and Indicated and 29 Mlbs Inferred copper equivalent (“CuEq”) metal within a National Instrument 43-101-compliant, high-grade resource of 36.2 million tonnes grading 1.07 % CuEq (0.81% Cu, 0.31 g/t Au, 3.41 Ag)1. The road accessible project is located along the Freegold Road, a Resource Gateway Road currently being upgraded by the Yukon government and is within 20 km of the Yukon electrical grid. The project is also situated within the Minto Copper Belt, a roughly 80 km long belt of rocks known for high grade occurrences of copper-gold-silver mineralisation.
The 2022 Carmacks Preliminary Economic Assessment (“PEA”), completed by SGS Canada, identified increased resources along with improved recovery as prime means of increasing the Net Present Value (“NPV”) of the project. Work completed this year by Kemetco Research (see news release dated January 17, 2024) demonstrated that recoveries exceeding the target outlined in the PEA can be achieved. The just completed drill program was designed to show that significant resource expansion is possible and was specifically targeting areas that could lead to an expanded mine life as envisioned by the PEA.
LS Molybdenum Project
The vendors of LS molybdenum project have agreed to defer work commitment the Company needed to complete for the calendar year for 2024. 750,000 shares have been issued to the vendors per the terms of the earn in agreement (see news release dated March 23, 2023).
About Granite Creek Copper
Granite Creek Copper, a member of the Metallic Group of Companies, is a focused on the exploration and development of critical minerals projects in North America. The Company’s projects consist of its flagship 177 square kilometer Carmacks project in the Minto copper district of Canada’s Yukon Territory on trend with the formerly operating, high-grade Minto copper-gold mine and the advanced stage LS molybdenum project and the Star copper-nickel-PGM project, both located in central British Columbia. More information about Granite Creek Copper can be viewed on the Company’s website at www.gcxcopper.com.
FOR FURTHER INFORMATION PLEASE CONTACT: Timothy Johnson, President & CEO Telephone: 1 (604) 235-1982 Toll Free: 1 (888) 361-3494 E-mail: info@gcxcopper.com Website: www.gcxcopper.com
Qualified Person
Debbie James P.Geo, has reviewed and approved the technical information contained in this news release. Ms. James is a Qualified Person as defined in NI 43-101 and supervised the 2024 drilling program
1Mineral Resources are reported within a conceptual constraining pit shell that includes the following input parameters: Metal prices of $3.60/lb Cu, $1,750/Au, $22/oz Ag, $14/lb Mo and pit slope angles that vary from 35° for overburden to 55°for granodiorite host, metal prices are in US$. Metallurgical recoveries reflective of prior test work that averages: 85% Cu, 85% Au, 65% Ag in the oxide domain and 90% Cu, 76% Au, 65% Ag in the sulphide domain. Mo recovery is assumed to be 70% in both oxide and sulphide domain. Totals and Metal content may not sum due to rounding and significant digits used in calculations. Cu Eq calculation is based on 100% recovery of all metals using the same metal prices used in the resource calculation: $3.60/lb Cu, $1,750/Au, $22/oz Ag, $14/lb Mo.
Forward-Looking Statements
Forward Looking Statements: This news release includes certain statements that may be deemed “forward-looking statements” or “forward-looking information”. All statements in this release, other than statements of historical facts including, without limitation, statements regarding expected use of proceeds from the private placement and future plans and objectives of the company are forward-looking statements that involve various risks and uncertainties. Although Granite Creek Copper believes the expectations expressed in such forward-looking statements are based on reasonable assumptions, such statements are not guarantees of future performance and actual results or developments may differ materially from those in the forward-looking statements. Forward-looking statements are based on a number of material factors and assumptions. Factors that could cause actual results to differ materially from those in forward-looking statements include failure to obtain necessary approvals, unsuccessful exploration results, changes in project parameters as plans continue to be refined, results of future resource estimates, future metal prices, availability of capital and financing on acceptable terms, general economic, market or business conditions, risks associated with regulatory changes, defects in title, availability of personnel, materials and equipment on a timely basis, accidents or equipment breakdowns, uninsured risks, delays in receiving government approvals, unanticipated environmental impacts on operations and costs to remedy same, and other exploration or other risks detailed herein and from time to time in the filings made by the companies with securities regulators. Readers are cautioned that mineral resources that are not mineral reserves do not have demonstrated economic viability. Mineral exploration and development of mines is an inherently risky business. Accordingly, the actual events may differ materially from those projected in the forward-looking statements. For more information on Granite Creek Copper and the risks and challenges of their businesses, investors should review their annual filings that are available at www.sedarplus.ca.
Neither the TSX Venture Exchange nor its Regulation Services Provider (as that term is defined in the policies of the TSX Venture Exchange) accepts responsibility for the adequacy or accuracy of this release.
TORONTO, Oct. 3, 2024 /PRNewswire/ – Collective Mining Ltd. (NYSE: CNL) (TSX: CNL) (“Collective” or the “Company”) is pleased to announce results from recent cyanidation tests conducted on representative samples from both shallow and deeper areas of its Apollo system (“Apollo”) at the Guayabales Project in Caldas, Colombia. The test results have yielded an average gold dissolution of 94.3% from seven new variability samples and confirm and corroborate previously announced cyanidation gold recoveries (see press release dated October 17, 2023). Furthermore, optimization test work on a flotation concentrate returned substantial improvements in recoveries for gold and silver over those previously reported on April 11, 2024.
Collective Mining Ltd. logo (CNW Group/Collective Mining Ltd.)
As a reminder, based on previous work completed, the Company envisions a conventional split circuit for processing material from Apollo with the copper rich stream (more than 0.15% copper) being treated through a flotation circuit and the copper poor stream (less than 0.15% copper) being treated through a precious metal focused cyanidation circuit to produce doré. The Company also now expects that a gravity circuit will be included after flotation for recovery of the high-grade tungsten mineralization.
The Company has five diamond drill rigs in operation as part of its fully funded 40,000 metres drill program for 2024, with two rigs drilling at Apollo, two rigs drilling at the Trap system and one rig drilling at the Plutus Target.
Ari Sussman, Executive Chairman commented: “The comprehensive metallurgical test work completed on Apollo confirms the simple nature of achieving high recovery rates of valuable metals from the system using conventional technologies.”
Details
Table 1: New Cyanidation Bottle Roll Leaching Variability Test Work Results
Seven variability samples with representative copper poor sulfide mineralization distributed across the Apollo system:
Variability Sample
Head Grade
Dissolution
Au, g/t
Ag, g/t
%Cu
Gold %
Silver %
BAM002
1.28
6.77
0.03
95.7
62.1
BAM003
1.22
43.19
0.12
92.9
73.8
BAM004
1.52
5.76
0.02
94.2
67.4
BAM005
0.39
6.44
0.02
95.0
54.4
BAM006
1.12
11.27
0.04
90.5
69.3
BAM007
0.39
3.96
0.01
95.0
61.7
BAM008
1.10
4.72
0.01
96.8
57.4
Average
1.00
11.73
0.03
94.3
63.7
New cyanidation variability tests undertaken in SGS Lima, Peru returned average gold and silver recoveries of 94.3% and 63.7%, respectively. The seven samples are widely distributed throughout both shallow and deeper portions of Apollo and are representative of the copper poor, sulfide material planned to be treated through a cyanidation circuit to produce doré. The samples were specifically selected to reflect lower grades (average 1.0 g/t Au and 11.7 g/t Ag, see Table 1) than previously tested. The results corroborate previous cyanidation test work recoveries (see press release dated October 17, 2023) and confirm the amenability of material from Apollo to yield high dissolution of gold over a wide range of grades.
Table 2: The Locked Cycle Cleaner Tailing Cyanidation Bottle Roll Leach Test Work Results
The composite with representative grade profile of copper-rich mineralization from Apollo, weighed 20 kilograms and was floated in a Locked Cycle Test to produce 600 grams of cleaner tailings which were subsequently subjected to cyanidation at ALS Laboratories in Kamloops, Canada. The overall flotation recovery rates and grades are presented below:
Bulk Flotation Test
Additional Recovery from Cyanidation of Cleaner Tailings
Overall Recoveries
Grade
Recovery
Copper
21.3 %
94.4 %
–
94.4 %
Gold
49.4 g/t
84.3 %
5 %
89.4 %
Silver
961 g/t
82.7 %
3 %
85.2 %
Results confirm a significant improvement of the overall gold and silver recoveries to 89.4% and 85.2% respectively when compared to previous recoveries of 84.3% Au and 82.7% Ag (see press release dated April 11, 2024). These results demonstrate significant improvements in metal recovery of approximately 5% for gold and 3% for silver while maintaining copper recovery at 94% in the copper rich material to be treated through a flotation circuit.
The results announced in this press release and those previously announced in the cyanidation and flotation press releases complete a comprehensive metallurgical test work program resulting in optimization of recoveries for the gold, silver, copper and tungsten in the Apollo system. These studies can now be utilized to outline an initial process design and assist in optimizing conditions for cyanidation and flotation facilities with respect to copper rich and copper poor streams.
About Collective Mining Ltd.
To see our latest corporate presentation and related information, please visit www.collectivemining.com
Founded by the team that developed and sold Continental Gold Inc. to Zijin Mining for approximately $2 billion in enterprise value, Collective is a copper, silver, gold and tungsten exploration company with projects in Caldas, Colombia. The Company has options to acquire 100% interests in two projects located directly within an established mining camp with ten fully permitted and operating mines.
The Company’s flagship project, Guayabales, is anchored by the Apollo system, which hosts the large-scale, bulk-tonnage and high-grade copper-silver-gold-tungsten Apollo porphyry system. The Company’s 2024 objective is to expand the Apollo system, step out along strike to expand the recently discovered Trap system and make a new discovery at either the Tower, X or Plutus targets.
Management, insiders, a strategic investor and close family and friends own nearly 50% of the outstanding shares of the Company and as a result are fully aligned with shareholders. The Company is listed on the NYSE under the trading symbol “CNL”, on the TSX under the trading symbol “CNL” and on the FSE under the trading symbol “GG1”.
Qualified Person (QP) and NI43-101 Disclosure
John Wells is the designated Qualified Person for this news release within the meaning of National Instrument 43-101 (“NI 43-101”) and has reviewed and verified that the technical information contained herein is accurate and approves of the written disclosure of same. Mr Wells is a graduate of the Royal School of Mines in the UK, has over 50 years of experience in mineral processing and is a Fellow of the SAIMM (South African Institute of Mines and Metallurgy) and is a member of CIM (Canadian Institute of Mining and Metallurgy).
Technical Information
The Cyanidation Bottle Roll Leaching Variability samples were prepared and analyzed at the SGS facilities in Callao, Peru. The composites were produced from the remaining half drill core taken over different lengths of seven drillholes completed at Apollo. Leaching kinetics were conducted in bottles on laboratory rolls for 72 hours. 60μm feeds and 1000 ppm NaCN, 10.5 – 11.0 pH and 40% Solids. Bottle rolling was suspended briefly after 6, 12, 24, 48, and 72 hours and slurry samples were taken and filtered to collect pregnant solution for gold, silver and copper analyzes. SGS conforms to the requirements of ISO/IEC 17025, the global benchmark for laboratory quality management systems and ensures competent and valid outcomes to facilitate trust in these results.
The Locked Cycle Cleaner Tailing Cyanidation Bottle Roll Leach sample was prepared and analyzed at ALS Canada Ltd.’s Kamloops facilities in British Colombia, Canada. The composite was produced from the remaining half drill core taken over different lengths of four drillholes completed at Apollo. 21-23μm feeds and 1000 ppm NaCN, 11.0 pH and 20-24% Solids and O2 sparged. Bottle rolling was suspended briefly after 2, 6, 24, and 48 hours and slurry samples were taken and filtered to collect pregnant solution for gold and silver analyzes. ALS conforms to the requirements of ISO/IEC 17025 and is accredited by the Standards Council of Canada for the specific tests undertaken.
Information Contact: Follow Executive Chairman Ari Sussman (@Ariski73) on X
This news release contains “forward-looking statements” and “forward-looking information” within the meaning of applicable securities legislation (collectively, “forward-looking statements”). All statements, other than statements of historical fact, are forward-looking statements and are based on expectations, estimates and projections as at the date of this news release. Any statement that involves discussion with respect to predictions, expectations, beliefs, plans, projections, objectives, assumptions, future events or performance (often, but not always using phrases such as “plans”, “expects”, “is expected”, “budget”, “scheduled”, “estimates”, “forecasts”, “intends”, “anticipates”, or “believes” or variations (including negative variations) of such words and phrases, or state that certain actions, events or results “may”, “could”, “would”, “might” or “will” be taken, occur or be achieved) are not statements of historical fact and may be forward-looking statements. In this news release, forward-looking statements relate, among other things, to: the anticipated advancement of mineral properties or programs; future operations; future recovery metal recovery rates; future growth potential of Collective; and future development plans.
These forward-looking statements, and any assumptions upon which they are based, are made in good faith and reflect our current judgment regarding future events including final listing mechanics and the direction of our business. Management believes that these assumptions are reasonable. Forward-looking statements involve known and unknown risks, uncertainties and other factors which may cause the actual results, performance or achievements of the Company to be materially different from any future results, performance or achievements expressed or implied by the forward-looking statements. Such factors include, among others: risks related to the speculative nature of the Company’s business; the Company’s formative stage of development; the Company’s financial position; possible variations in mineralization, grade or recovery rates; actual results of current exploration activities; conclusions of future economic evaluations; fluctuations in general macroeconomic conditions; fluctuations in securities markets; fluctuations in spot and forward prices of gold, precious and base metals or certain other commodities; fluctuations in currency markets; change in national and local government, legislation, taxation, controls regulations and political or economic developments; risks and hazards associated with the business of mineral exploration, development and mining (including environmental hazards, industrial accidents, unusual or unexpected formation pressures, cave-ins and flooding); inability to obtain adequate insurance to cover risks and hazards; the presence of laws and regulations that may impose restrictions on mining; employee relations; relationships with and claims by local communities and indigenous populations; availability of increasing costs associated with mining inputs and labour; the speculative nature of mineral exploration and development (including the risks of obtaining necessary licenses, permits and approvals from government authorities); and title to properties, as well as those risk factors discussed or referred to in the annual information form of the Company dated March 27, 2024. Forward-looking statements contained herein are made as of the date of this news release and the Company disclaims any obligation to update any forward-looking statements, whether as a result of new information, future events or results, except as may be required by applicable securities laws. There can be no assurance that forward-looking statements will prove to be accurate, as actual results and future events could differ materially from those anticipated in such statements and there may be other factors that cause results not to be anticipated, estimated or intended. Accordingly, readers should not place undue reliance on forward-looking statements.