We are pleased to invite you to an upcoming webinar hosted by John Tumazos Very Independent Research, featuring a presentation and Q&A with Dave Cole, President and CEO of EMX Royalty Corporation.
Mr. Cole will provide an update on the Company’s recent developments, portfolio performance, and strategic outlook, while addressing investor questions in conversation with John Tumazos.
We encourage you to register in advance and mark your calendar. This is an excellent opportunity to stay informed about EMX’s progress and plans for the remainder of 2025.
Should you have any questions ahead of the webinar, please don’t hesitate to reach out.
We believe the next leg up for gold will be driven by a loss of confidence in mainstream positioning in equities, high-yield bonds and private equity. Concerns over tariffs may well have become a contributing factor to the gathering deflation of the financial asset bubble, but overanalyzing their possible impact obscures focus on market forces that were in motion long before “Liberation Day.”
The run to record gold bullion prices in 2024 and year-to-date 2025 has been mainly driven by official sector investment motivated in part by the gradual disintegration of the U.S. dollar-based system of international trade and the shakeup of the geopolitical landscape. Official sector demand has been augmented by record Asian and especially Chinese investment buying. These developments have been all but ignored by American and European retail and institutional investors captivated instead by overvalued technology and artificial intelligence (AI) stocks. We believe investor exposure to gold, by several measures, is at historic lows.
As capital flees overvalued assets, gold’s scarcity and safe-haven appeal could drive its price higher.
The essence of a bear market1 is overvaluation and incorrect positioning. The shift in psychology that results from bear market losses may lead to a search for investment alternatives. We believe safe-haven assets, including gold, will capture resulting capital flows.
Gold’s capacity to absorb new inflows is limited by its tiny “float”2 relative to the scale of financial markets denominated in U.S. dollars. Gold-backed exchange traded funds (ETFs) are likely recipients of the shift in capital flows we anticipate. Expanded flows into most gold ETFs must be accommodated by the purchase of physical metal. The migration of capital to gold and possibly other monetary metals could result in a price that is multiples of the current price of $3,000 per ounce.
We believe gold mining equities remain significantly undervalued and stand to benefit from further advances in metal prices. Mining profitability is leveraged to changes in gold prices, which move more quickly than costs. Therefore, in our view, mining shares offer significant torque potential relative to physical gold.
The Equity Bear Market is Not Caused by Tariffs Alone
Even as the Trump administration walks back its stance on tariffs, the contraction in equity market valuations likely has further to run. On April 6, 2025, veteran market analyst and technician Stan Weinstein stated:
“While many traders and investors incorrectly think that this devastating selloff is simply the result of ‘the tariffs,’ as we showed you in detail in last weekend’s update, ‘termites’ have been at work, weakening the market’s technical structure, for the past few months, even as several of the indexes (such as the S&P 500 Index3) were making new highs (and this was being ‘camouflaged’ by the narrow strength of the ‘Magnificent 7,’4just as was the case in late 1999-early 2000, before the internet bubble ‘popped,’ and in 1973 when the ‘Nifty Fifty’ 5of that era was ‘all the rage’ – but, in each and every case, the Advance-Decline Line6 had topped out well before the market reached those respective peaks). So what is really happening is that the upsetting fundamental ‘news’ is colliding with an already-weakened technical structure that was getting ready to collapse (so it most definitely couldn’t handle the added ‘worries’) – and, very simply, that ‘perfect storm’ combination has resulted in this ‘crash’!”
Market strategist Michael Belkin, who has correctly called major turning points in the stock market over many decades, noted in his report on March 24, 2025, that the fuel for a market decline could be seen in the record level of margin debt.
“The January margin debt level was $937 billion, equal to the Oct 2021 peak of $936 billion…. Margin debt is a great indication of animal spirits… It’s not what people think about the market (like the AAII Individual Investor Sentiment Index), it’s a measure of how much stock market risk they are willing to take on with leverage.”
You can access more insights from Michael Belkin by listening to our Sprott Radio podcast, The New Sector Rotation.
Carter Worth, a savvy market analyst and eponym of Worth Charting, noted in an April 6, 2025, commentary that the typical stock in the Russell 3000 Index, representing 98% of all investible capital in U.S. equity markets, peaked in October well before “tariffs” was on the tip of everyone’s tongue. Roughly 50% of the stocks in that Index are down 35% or more (as of March 31, 2025), giving the lie to Treasury Secretary Bessent’s recent comment that the market carnage was confined mainly to the “Magnificent 7” names. The bear market is pervasive throughout all market sectors based on Worth’s analysis.
In our opinion, the current generation of investors has never experienced a genuine bear market. The notion that a bear market is simply a decline of 20% or more from the trading peak is overly superficial. The bear market of the 1970s was a grinding multi-year affair whose duration was sufficient to suffocate speculative psychology well into the 1980s.
It remains to be seen whether the current bear market will resemble one of the 1970s or of the post-2000 variety, which were mostly ended by Federal Reserve bailouts. History demonstrates that either outcome will be positive for gold.
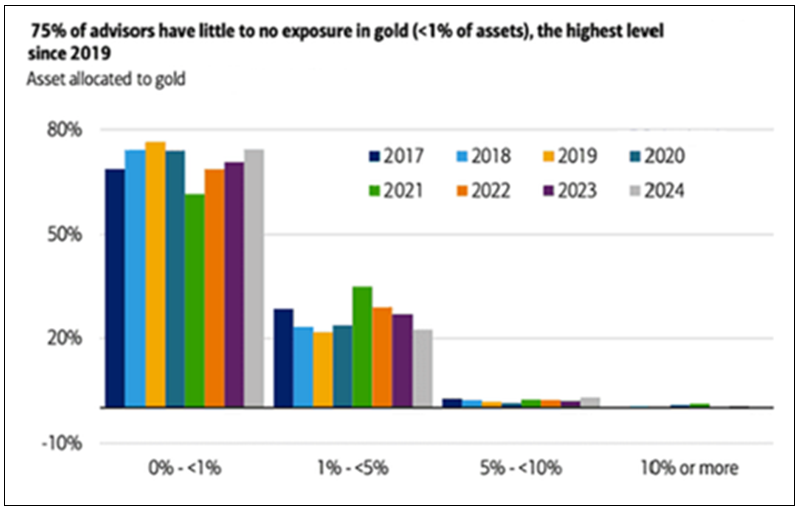
Gold Positioning by Western Investors is Minimal
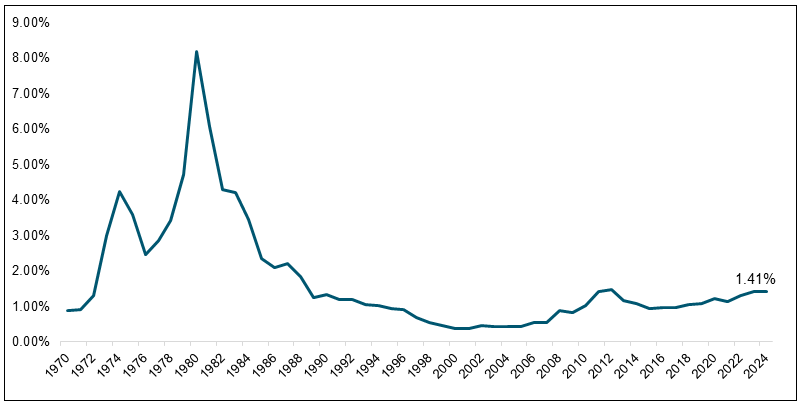
As of year-end 2024, financial advisors recorded the lowest exposure to gold since 2019.
Figure 1: Financial Advisor Allocations to Gold
Source: BofA Global Research. Data as of 2/26/2024.
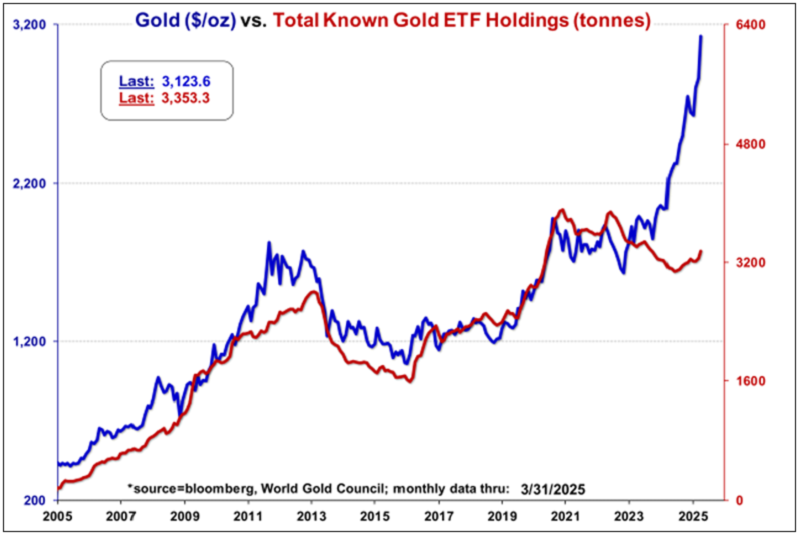
Since 2020, holdings of gold-backed ETFs have declined by 585 metric tonnes, or 17.51% of total assets at year-end 2020. In 2024, holdings rose by 159 tonnes, leaving aggregate AUM by weight nearly 20% below the 2020 peak.
Figure 2: Gold-Backed ETF Holdings Have Declined Since 2019 Peak
Source: Meridian Macro Research. Data as of 3/31/2025.
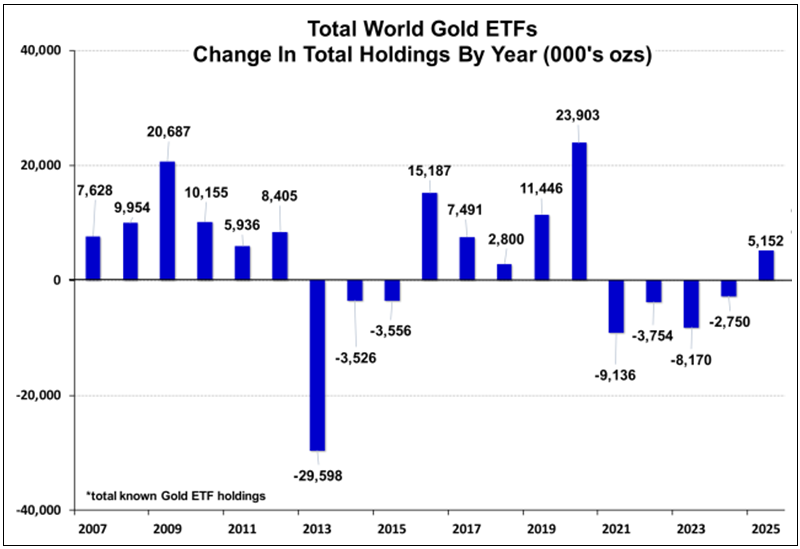
Figure 3. Total World Gold ETFs, Change in Total Holdings by Year
Source: Meridian Macro Research. Data as of 3/31/2025.
Gold is Still Contrarian
Gold, long a Wall Street pariah, has only recently become popular as major investment firms jump on the bandwagon to make gold price forecasts undreamed of only six months ago. Bullion’s newfound popularity may have resulted in a short-term overbought condition, but we believe it has been remedied by the market meltdown.
On Saturday, April 5, 2025, the Financial Times reported that hedge funds had been hit with the largest margin calls since the 2020 COVID crisis. Gold may be temporarily caught up in this “sell everything” scenario. We believe gold’s checkback will prove to be temporary and will serve to correct recent overbought sentiment readings.
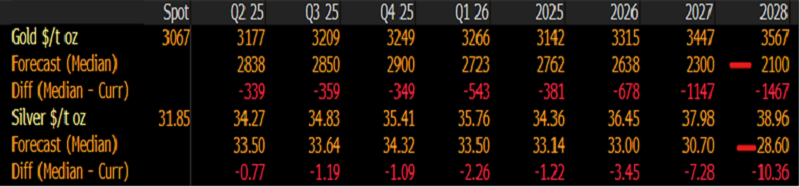
A bullish outlook7 for gold is still contrarian. The longer-term consensus forecast among investment firms polled by Bloomberg is for gold prices to decline steeply to $2,100 in 2028 (see Figure 4). We regard this groupthink as a positive sign that strategists see no appeal for metal exposure other than a tactical one beyond the very short term. Another way to put this bearish gold forecast into perspective is the unanimity of bullish calls from leading brokerage firms for the stock market at the beginning of 2025. Example forecasts for the S&P 500 Index include Deutsche Bank (7100), BMO and HSBC (6700), and Goldman Sachs, Morgan Stanley, JP Morgan and Citi (all at 6500).
Figure 4. Consensus Forecasts on Gold Prices to 2028
Source: Bloomberg. Data as of March 31, 2025.
With Trump’s detonation of the “pax Americana” liberal world order in place since the end of World War II, “the U.S. dollar becomes a choice, not a necessity, and debt issuance on everything and everywhere — not just by the U.S. Treasury — becomes more risky and expensive” (from “Crashing the Car of Pax Americana Epsilon Theory”). The potential scope for reallocation to gold is suggested by the chart below:
Figure 5. Gold’s Share of Global Equity and Bond Securities
Source: BIS, ICE Benchmark Administration, Metals Focus, Refinitiv GFMS, World Bank, World Federation of Exchanges, World Gold Council.
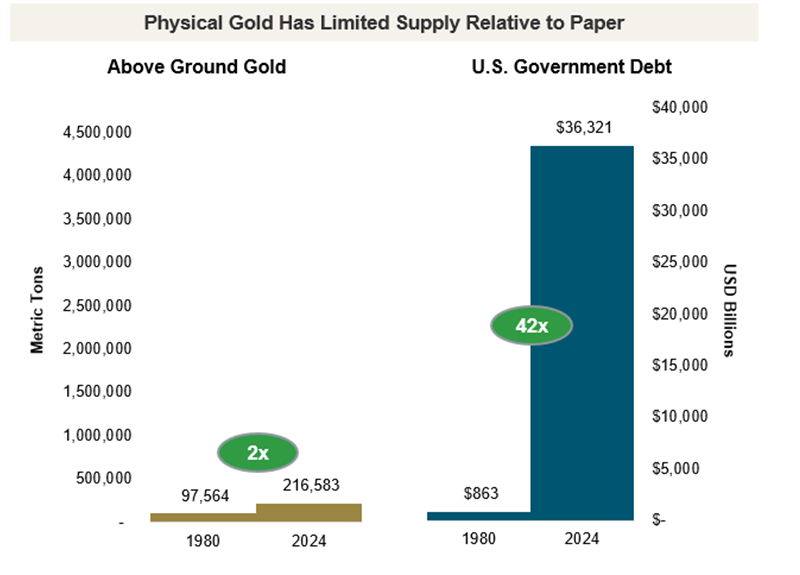
Gold is Scarce Relative to Financial Assets
Figure 6.
Source: Bloomberg and World Gold Council as of 2024.
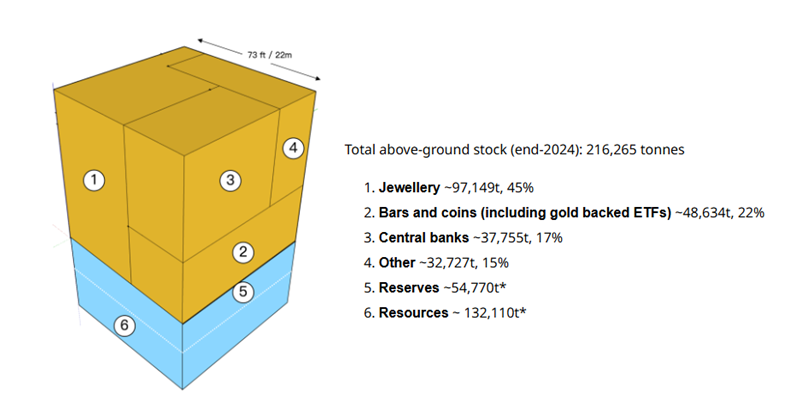
The apocryphal tale that every molecule of gold ever mined remains above ground as potential supply (due to recycling, preservation in works of art, high-end jewelry, coins, hoarding and storage as a monetary reserve by central banks) is deeply flawed. As calculated and shown in the gold cube illustration in Figure 7, that quantity is 216,583 metric tonnes, which, for the sake of this exercise, equals $22 trillion at $3,000/oz.
However, only a small fraction of that quantity is potentially in play as “supply”. The gold cube illustration suggests the application of a 72% haircut to arrive at a number for physical gold that could be quasi-tradeable. That would include coins, low-end jewelry (think Middle Eastern souks) and assorted shapes and units not acceptable as good delivery by the London Bullion Market Association (LBMA), Commodity Exchange (COMEX) or Shanghai Gold Exchange (SGE). A tally of metal stored in London, COMEX or Shanghai Gold Exchange inventories results in a tradeable float of approximately $1 trillion.
Figure 7. Estimated Above-Ground Gold Holdings by Demand Categories
Source: Data as of 2/11/2025. Financial investment includes over-the-counter (OTC) and gold ETFs. World Gold Council, Metals Focus, Refinitiv GFMS.
This exercise leads to three conclusions:
First, the dollar amount of all gold is a small fraction of wealth denominated in U.S. dollars (USD), $100 trillion in global equities and $315 trillion of debt (Source: Institute of International Finance) as of year-end 2024. A small reallocation from liquid financial assets into gold, most easily accessed via gold-backed ETFs, could significantly increase the USD gold price.
Second, the recent scramble to relocate physical gold from London to New York ahead of tariffs illustrated the stark illiquidity of even the tradeable gold float. Following Trump’s victory, COMEX inventories rose 2.6x from approximately 17,000 to 40,000 ounces within a few months. The premium of New York versus London gold prices rose as high as $45 (1.5%) during that period as bullion banks and their clients hurried to withdraw London 400 ounce gold bars to be refined into 100 ounce COMEX good delivery, hardly the indication of a liquid market.
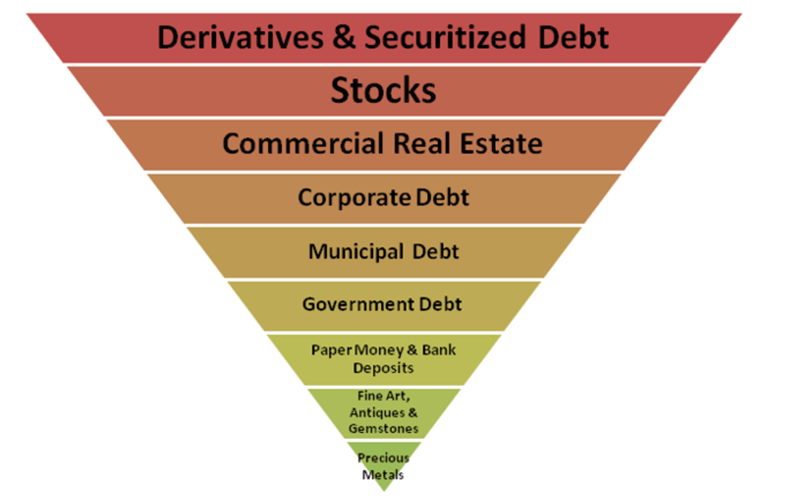
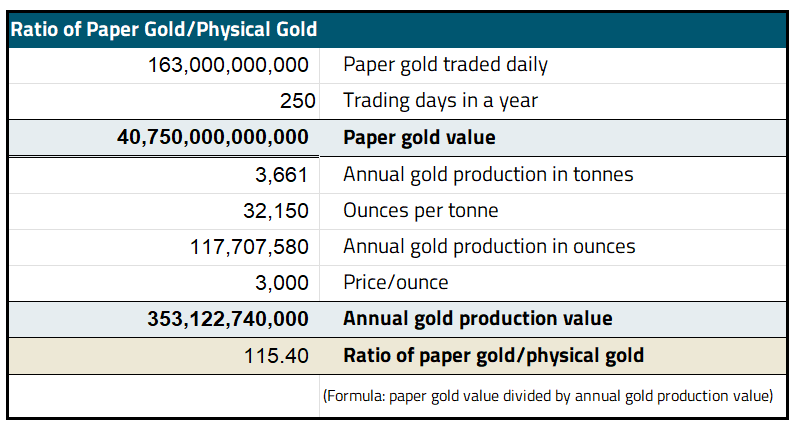
Third, the highly liquid paper gold trade rests on a shaky foundation, best imagined by John Exter*, as an inverted pyramid (see Figure 8). Paper gold includes all contracts traded between bullion banks and their clients in the form of swaps, options, futures and other derivatives. According to the LBMA, the daily trading volume of gold in 2024 was 33 million ounces or $80 billion compared to annual gold production of 120,000,000 ounces or $324 billion (2024 prices).
We reckon that the ratio of paper to physical trading is approximately 115 to 1 (based on LBMA and COMEX futures; see Figure 9). It is unclear, but unlikely, that the opaque LBMA market statistics include unreported over-the-counter derivative trades. The tariff scare illustrates the fragility of arrangements underlying the paper gold trade. In our opinion, the extension of credit among bullion banks and their clients will be more cautious following this episode. Our long-held belief (almost 30 years, as shown by my 1999 quote in the Appendix) is that any diminution of the paper gold trade will lead to improved price discovery for physical metal.
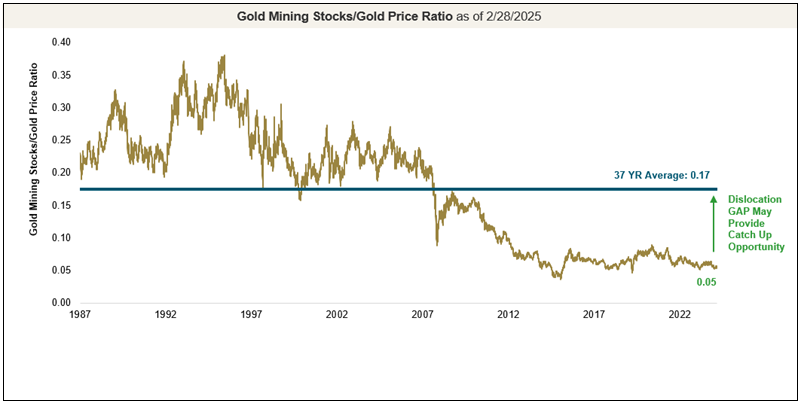
During Q1 2025, gold stocks (using GDX8 as a proxy) outperformed gold bullion with a gain of 35.56% compared to 19.02% for the metal. For many years, miners have underperformed the metal:
Figure 10. Gold Miners Offering Deep Value versus Gold Bullion
Source: Bloomberg as of 2/28/2025 (reflects past 37 years). Gold is measured by the GOLDS Comdty Spot Price and gold equities by the Philadelphia (PHLX) Stock Exchange Gold and Silver Sector Index (XAU). The Philadelphia (PHLX) Stock Exchange Gold and Silver Index (XAU) is used versus the Philadelphia (PHLX) Stock Exchange Gold and Silver Sector Total Return Index (XXAU) for its longer historical track record. You cannot invest directly in an index.
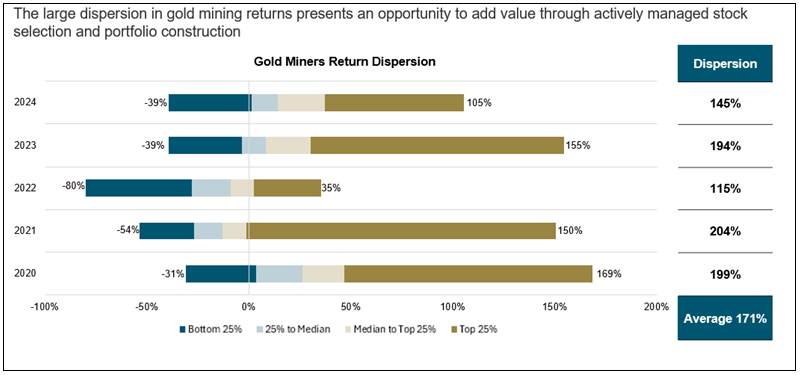
However, value investors and stock pickers, please take note: it would be ill-advised to take a jaundiced view of each and every gold stock. There are many success stories within the sector. A better perspective can be seen from the wide dispersion of returns:
Figure 11. Gold Miners: A Dispersion of Returns
Source: Bloomberg and FactSet as of 12/31/2024. Gold Miners (GDM) represents the NYSE Arca Gold Miners Index (GDMNTR INDEX) and the constituents of GDX US Equity, which tracks the GDMNTR Index. You cannot invest directly in an index.
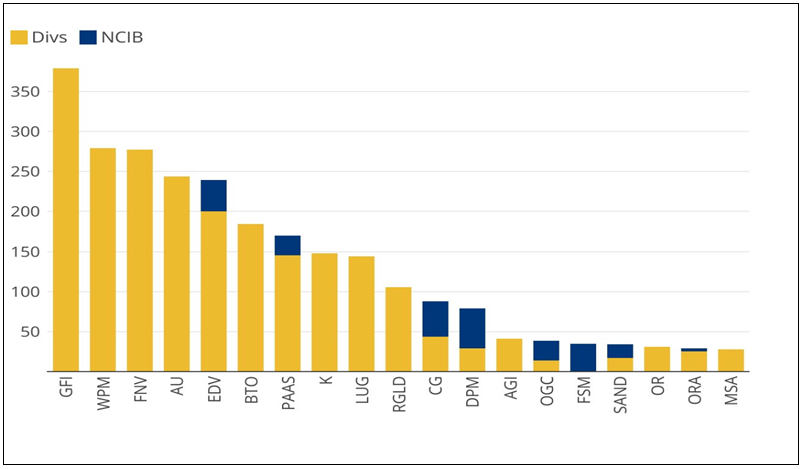
While not universal, we see growing evidence of intelligent deployment of capital, resistance to the siren call of investment bankers that “bigger is better” and recognition of the need to return capital to shareholders during this period of prosperity for the industry. More enlightened management teams are beginning to think in terms of returns on invested capital (see Figure 12), accountability in terms of per-share metrics and judicious deal making.
Figure 12. Gold Mining Companies Returns to Shareholders, Ex Big 3 (US$M)
Source: Mining Journal. Data as of 12/31/2024. “Ex Big 3” refers to Newmont, Barrick Gold and Agnico Eagle Mines. A Normal Course Issuer Bid (NCIB), also known as a stock repurchase program, is a company’s plan to buy back its own outstanding shares from the market, usually over an extended period, and is subject to regulatory approval.
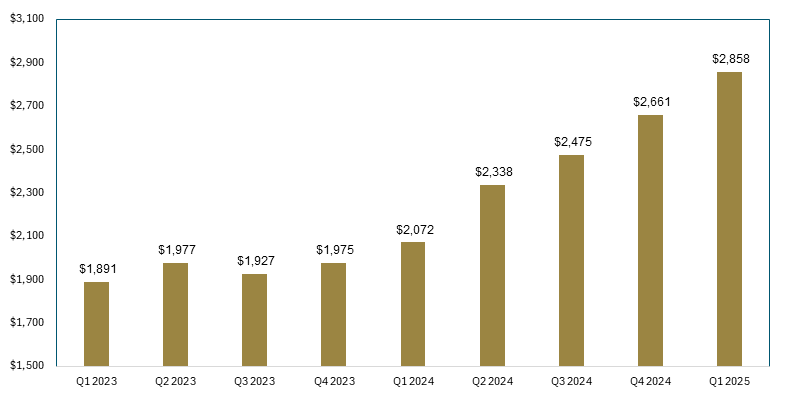
While many investors trade mining stocks according to every twitch and jiggle in the daily price, we believe a better guide is the average gold price received on a quarterly basis.
Figure 13. Average Gold Price (2023-2025)
Source: Bloomberg. Data as of March 31, 2025.
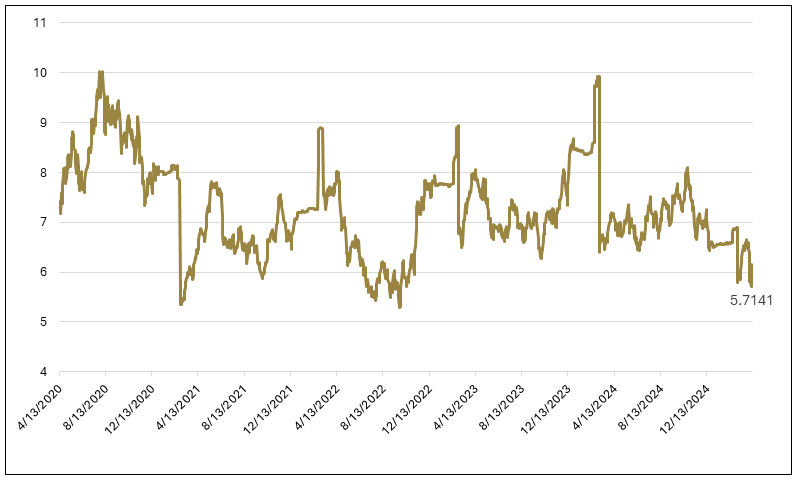
And for die-hard value investors, as we are, it is hard to find a more enticing sector in terms of EV/EBITDA9. What is especially appealing is that mining fundamentals, the main component of which is future gold prices, have fared relatively well in periods of recession and inflation.
Figure 14: Gold Miners Appear Undervalued Based on EV/EBITDA (2019-2025)
Source: Bloomberg. Data as of March 31, 2025.
Trend Acceleration Ahead?
We concluded our 2024 commentary with the same heading as above. We hypothesized that the catalysts for a step change in the advance of gold prices would be: “a bear market; a steep, lengthy retreat in cryptocurrencies; bond market disruption with interest rate risk morphing into credit risk; and unwanted, persistent U.S. dollar strength that threatens economic instability.”
We are batting about 75% on those calls. The retreat in cryptocurrencies has been steep, but it is too early to call it lengthy. Treasuries have thus far failed to serve as a safe haven and credit risk seems to be furiously springing leaks. The U.S. dollar has weakened instead of strengthening as a corollary of the “Trump trade” that we envisioned. However, an entrenched bear market and spreading credit risk are enough, in our opinion, to drive the gold price substantially higher. Mining stocks, especially those well-managed and positioned, stand to benefit most from the step change in the rate of gold’s advance that we envision.
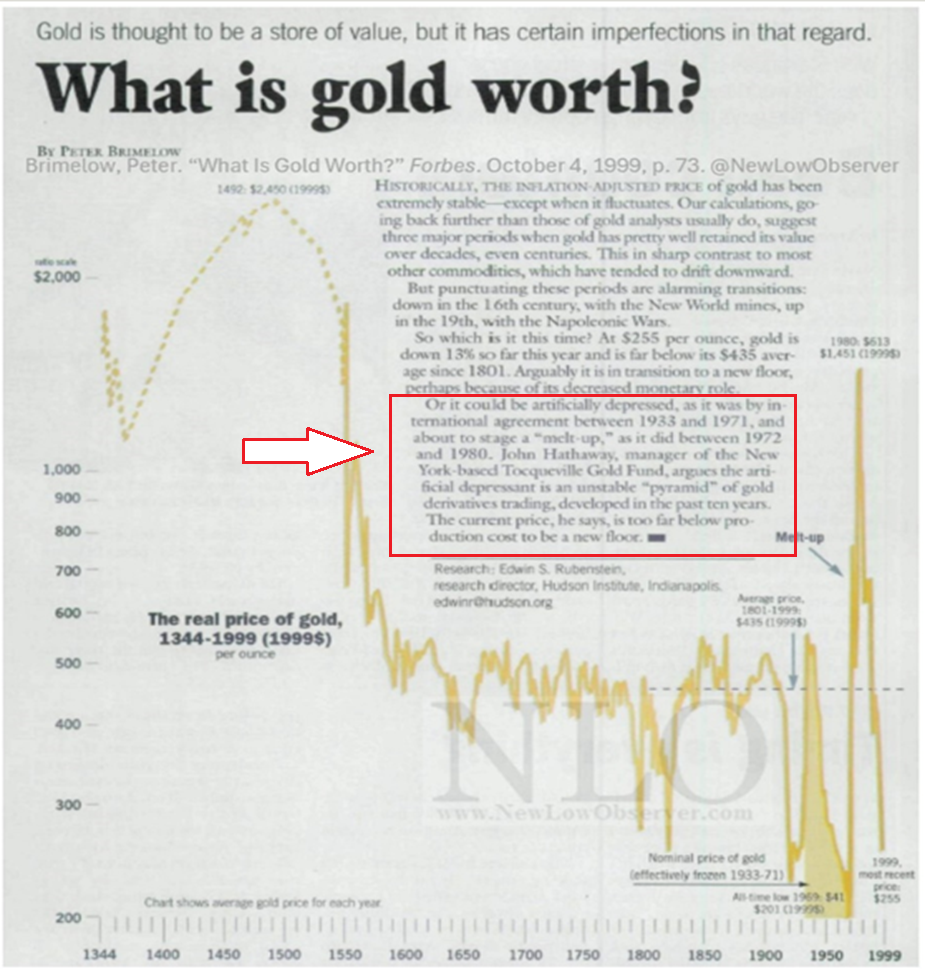
Appendix
From the dustbin.
For illustrative purposes only.
Footnotes
1
A bear market is often characterized by negative investor sentiment, leading to a downward trend in market performance over time.
2
The gold “float” is the amount of gold readily available for trading in the market.
3
The S&P 500 Index (Standard & Poor’s 500) is a stock market index that tracks the performance of 500 of the largest publicly traded companies in the United States.
4
The Magnificent 7 refers to a group of seven major tech companies known for their significant stock growth and market influence.
5
The term Nifty Fifty was an informal designation for a group of roughly fifty large-cap stocks on the New York Stock Exchange during the 1960s and 1970s, known for their consistent earnings, considered solid buy-and-hold growth stocks.
6
The advance-decline line (A/D line) is a technical indicator used in stock market analysis to measure market breadth. It tracks the difference between the number of stocks that are rising in price (advancing) and the number of stocks that are falling in price (declining) on a given day.
7
A bull market is characterized by rising prices and investor optimism.
8
VanEck Gold Miners ETF (GDX®) seeks to replicate as closely as possible, before fees and expenses, the price and yield performance of the NYSE Arca Gold Miners Index (GDMNTR), which is intended to track the overall performance of companies involved in the gold mining industry.
9
EV/EBITDA, a popular valuation metric, compares a company’s enterprise value (EV) to its earnings before interest, taxes, depreciation, and amortization (EBITDA) to assess its value and profitability.
Vancouver, British Columbia–(Newsfile Corp. – April 10, 2025) – EMX Royalty Corporation (NYSE American: EMX) (TSXV: EMX) (the “Company” or “EMX”) is pleased to announce that it has received an early final property payment from AbraSilver Resource Corp. (“AbraSilver”) totaling US$6.85 million. This payment, originally due by July 31, 2025, was completed ahead of schedule in exchange for a reduced total obligation from the original US$7.0 million.
EMX retains a 1% NSR on AbraSilver’s Diablillos project, an advanced silver and gold project in Argentina. EMX congratulates AbraSilver on its recent C$58.5 million equity financing to accelerate advancement of Diablillos.
EMX will use the proceeds of the early property payment, together with cash on hand, to make a US$10 million principal payment toward its senior secured term loan facility due to Franco-Nevada Corporation. Following this early principal payment, EMX’s total long-term debt outstanding will be reduced from US$35 million to US$25 million.
About EMX – EMX is a precious and base metals royalty company. EMX’s investors are provided with discovery, development, and commodity price optionality, while limiting exposure to risks inherent to operating companies. The Company’s common shares are listed on the NYSE American Exchange and TSX Venture Exchange under the symbol “EMX”. Please see www.EMXroyalty.com for more information.
Neither the TSX Venture Exchange nor its Regulation Services Provider (as that term is defined in policies of the TSX Venture Exchange) accepts responsibility for the adequacy or accuracy of this release.
Forward-Looking Statements
This news release may contain “forward-looking statements” that reflect the Company’s current expectations and projections about its future results. These forward-looking statements may include statements regarding perceived merit of properties, exploration results and budgets, mineral reserves and resource estimates, work programs, capital expenditures, timelines, strategic plans, market prices for precious and base metal, or other statements that are not statements of fact. When used in this news release, words such as “estimate,” “intend,” “expect,” “anticipate,” “will”, “believe”, “potential” and similar expressions are intended to identify forward-looking statements, which, by their very nature, are not guarantees of the Company’s future operational or financial performance, and are subject to risks and uncertainties and other factors that could cause the Company’s actual results, performance, prospects or opportunities to differ materially from those expressed in, or implied by, these forward-looking statements. These risks, uncertainties and factors may include, but are not limited to unavailability of financing, failure to identify commercially viable mineral reserves, fluctuations in the market valuation for commodities, difficulties in obtaining required approvals for the development of a mineral project, increased regulatory compliance costs, expectations of project funding by joint venture partners and other factors.
Readers are cautioned not to place undue reliance on these forward-looking statements, which speak only as of the date of this news release or as of the date otherwise specifically indicated herein. Due to risks and uncertainties, including the risks and uncertainties identified in this news release, and other risk factors and forward-looking statements listed in the Company’s MD&A for the quarter ended December 31, 2024 (the “MD&A”), and the most recently filed Annual Information Form (“AIF”) for the year ended December 31, 2024, actual events may differ materially from current expectations. More information about the Company, including the MD&A, the AIF and financial statements of the Company, is available on SEDAR at www.sedarplus.ca and on the SEC’s EDGAR website at www.sec.gov.
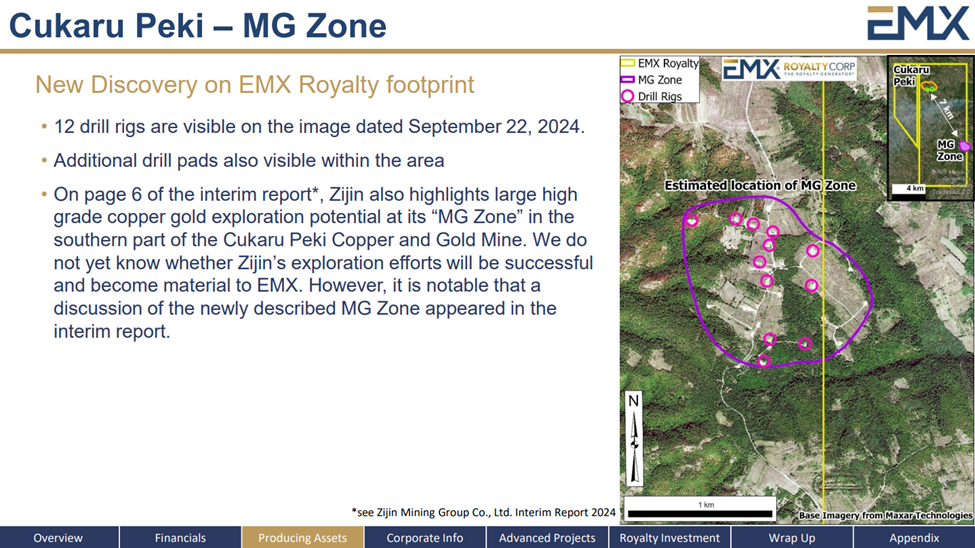
Vancouver, British Columbia–(Newsfile Corp. – March 27, 2025) – EMX Royalty Corporation (NYSE American: EMX) (TSXV: EMX) (the “Company” or “EMX”) is pleased to announce that its royalty partner at Timok in Serbia, Zijin Mining Group Co., Ltd. (“Zijin”), released their “Annual Results Announcement for the Year Ended 31 December 2024” on March 23, 2025. This report showed a significant increase in copper and gold resources and reserves at Cukaru Peki in comparison to results published for 2023. The 2024 report also described a new exploration discovery at Timok called the Malka Golaja Copper-Gold Deposit (also referred to as “MG Area” in previous disclosures), which is located approximately seven kilometers to the southeast of the Cukaru Peki Mine. Zijin included this statement in their 2024 Annual Results Announcement:
“The preliminary exploration at the high-grade Malka Golaja Copper-Gold Deposit at the deep part of the metallogenic belt of Timok, Serbia was completed. According to the report under the JORC Code prepared by a team of competent persons, the cumulative identified copper resources amounted to 2.81 million tonnes with an average grade of 1.87%, and gold resources of 92 tonnes with an average grade of 0.61 g/t. In addition, the deposit remains open at the periphery, indicating significant potential for mineral exploration.”[1]
The resource numbers reported by Zijin for copper and gold are for tonnes of contained metal, which equate to approximately 150 million tonnes of mineralized material averaging 1.87% copper and 0.61 g/t gold. Further, the Malka Golaja resource numbers published by Zijin were not categorized in their disclosure to National Instrument 43-101 or JORC, so EMX is assuming without access to the data that the resources are at the level of confidence and entirely classified as inferred resources, which represents the lowest level of confidence under CIM 2014 and JORC resource categories[2].
Based upon EMX’s reviews of satellite imagery and the locations of drill sites as observed in the field, the Malka Golaja deposit appears to be covered by EMX’s Brestovac royalty interest. EMX senior management also recently completed a site visit to the Cukaru Peki mine and met with Zijin representatives for an update on Zijin’s mining activities at Timok. EMX congratulates Zijin on its outstanding work at Timok, including the rapid advancement of the Cukaru Peki operations and the novel discovery at Malka Golaja. The Malka Golaja discovery represents a significant development for both Zijin and EMX as a royalty holder.
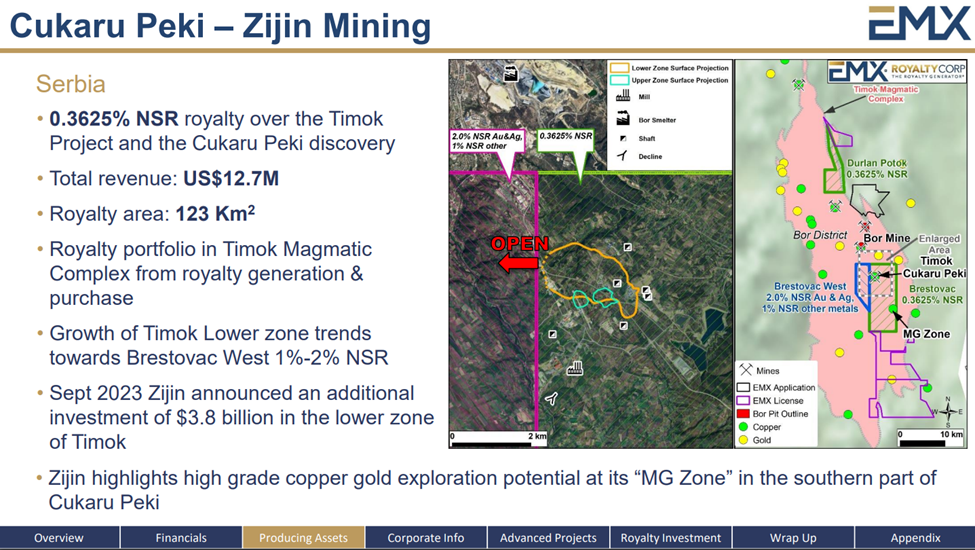
EMX currently holds a 0.3625% NSR royalty over Zijin’s Brestovac exploration permit area (including the Cukaru Peki Mining Licenses), as well as portions of Zijin’s Jasikovo-Durlan Potak exploration license north of the currently active Bor Mine. EMX also owns a 2% NSR royalty on precious metals and a 1% NSR royalty on base metals on the Brestovac West License, which lies immediately adjacent and to the west of the Brestovac Mining License and the Cukaru Peki Mine. All of EMX’s Timok royalties are uncapped and cannot be repurchased or reduced. The Company is currently receiving quarterly royalty payments from Zijin for copper and gold production from the Cukaru Peki Mine.
Dr. Eric P. Jensen, CPG, a Qualified Person as defined by National Instrument 43-101 and employee of the Company, has reviewed, verified and approved the disclosure of the technical information contained in this news release.
About EMX. EMX is a precious and base metals royalty company. EMX’s investors are provided with discovery, development, and commodity price optionality, while limiting exposure to risks inherent to operating companies. The Company’s common shares are listed on the NYSE American Exchange and TSX Venture Exchange under the symbol “EMX”. Please see www.EMXroyalty.com for more information.
Neither the TSX Venture Exchange nor its Regulation Services Provider (as that term is defined in policies of the TSX Venture Exchange) accepts responsibility for the adequacy or accuracy of this release
Forward-Looking Statements
This news release may contain “forward looking statements” that reflect the Company’s current expectations and projections about its future results. These forward-looking statements may include statements regarding perceived merit of properties, exploration results and budgets, mineral reserves and resource estimates, work programs, capital expenditures, timelines, strategic plans, market prices for precious and base metal, or other statements that are not statements of fact. When used in this news release, words such as “estimate,” “intend,” “expect,” “anticipate,” “will”, “believe”, “potential” and similar expressions are intended to identify forward-looking statements, which, by their very nature, are not guarantees of the Company’s future operational or financial performance, and are subject to risks and uncertainties and other factors that could cause the Company’s actual results, performance, prospects or opportunities to differ materially from those expressed in, or implied by, these forward-looking statements. These risks, uncertainties and factors may include, but are not limited to unavailability of financing, failure to identify commercially viable mineral reserves, fluctuations in the market valuation for commodities, difficulties in obtaining required approvals for the development of a mineral project, increased regulatory compliance costs, expectations of project funding by joint venture partners and other factors.
Readers are cautioned not to place undue reliance on these forward-looking statements, which speak only as of the date of this news release or as of the date otherwise specifically indicated herein. Due to risks and uncertainties, including the risks and uncertainties identified in this news release, and other risk factors and forward-looking statements listed in the Company’s MD&A for the quarter ended December 31, 2024 (the “MD&A”), and the most recently filed Annual Information Form (“AIF”) for the year ended December 31, 2024, actual events may differ materially from current expectations. More information about the Company, including the MD&A, the AIF and financial statements of the Company, is available on SEDAR at www.sedarplus.ca and on the SEC’s EDGAR website at www.sec.gov.
[1] From page 32 of Zijin report: “Annual Results Announcement for the Year Ended 31 December 2024”, published on Zijin’s corporate website on March 23, 2025. Although Zijin meets the definition of a producing issuer under NI43-101 and has reported these results as being compliant with JORC protocols, an acceptable foreign code, EMX has not independently verified this information. However, EMX believes this information to be reliable and relevant.
[2] EMX is treating the disclosed Malka Golaja resource estimate by Zijin as inferred resources only. As a requirement stated in Section 2.2 in NI43-101, inferred resources cannot be added to or reported with other resource categories.
Vancouver, British Columbia–(Newsfile Corp. – March 26, 2025) – EMX Royalty Corporation (NYSE American: EMX) (TSXV: EMX)(the “Company” or “EMX”) is pleased to announce that, after its successful completion of its Normal Course Issuer Bid (the “Original NCIB”) on January 8, 2025, it has received approval from the TSX Venture Exchange (“TSX-V”) of its Notice of Intention to commence a new NCIB (the “New NCIB”) and a new automatic stock purchase program.
Under the Original NCIB, the Company repurchased and cancelled all of the 5,000,000 common shares (the “Shares”) allowed for a total amount of $8,255,000 or $1.65 per share, which represented approximately 4.45% of its issued and outstanding shares at the time of commencement.
Under the New NCIB, the Company may purchase for cancellation up to 5,440,027 Shares, representing approximately 5% of its issued and outstanding Shares as at April 1, 2025, over a twelve-month period commencing on April 1, 2025. The New NCIB will expire no later than March 31, 2026. In any event, EMX cannot purchase more than 2% of the issued and outstanding shares in any 30 day period.
In connection with the New NCIB, the Company is initiating an automatic stock purchase program with its designated broker in compliance with applicable securities law and the rules and policies of the TSX-V, in order to purchase all or a portion of the Shares under its NCIB at times when the Company would not ordinarily be active in the market due to its own internal trading blackout periods, insider trading policies or otherwise.
EMX believes that from time to time, the market price of its Shares may not reflect their underlying value and that the purchase of its Shares will enhance shareholder value and increase liquidity of the Shares. The Company intends to fund the purchases out of available cash.
All purchases made pursuant to the New NCIB will be made through the facilities of the TSX-V, NYSE American Stock Exchange (“NYSE American”), other designated exchanges and/or alternative Canadian trading systems or by such other means as may be permitted by applicable securities laws. The New NCIB will be made in accordance with the applicable rules and policies of the TSX-V, NYSE American and applicable Canadian and United States securities laws. The price that EMX will pay for Shares in open market transactions will be the market price at the time of purchase. Any Shares that are purchased under the NCIB will be cancelled. The actual number of Shares that may be purchased and the timing of such purchases will be determined by the Company. Decisions regarding purchases will be based on market conditions, share price, best use of available cash, and other factors. The Company is not obligated to purchase any particular number of Shares under the New NCIB and the New NCIB may be modified or suspended at the Company’s discretion.
EMX has appointed National Bank Financial Inc. to make purchases under the NCIB on its own behalf.
About EMX – EMX is a precious, and base metals royalty company. EMX’s investors are provided with discovery, development, and commodity price optionality, while limiting exposure to risks inherent to operating companies. The Company’s common shares are listed on the NYSE American Exchange and TSX Venture Exchange under the symbol “EMX”. Please see www.EMXroyalty.com for more information.
Neither the TSX Venture Exchange nor its Regulation Services Provider (as that term is defined in policies of the TSX Venture Exchange) accepts responsibility for the adequacy or accuracy of this release.
Forward-Looking Statements
This news release may contain “forward looking statements” that reflect the Company’s current expectations and projections about its future results. These forward-looking statements may include statements regarding EMX’s normal course issuer bid, the Company’s pre-defined plan with its broker to allow for the repurchase of Shares and the timing, number and price of Shares that may be purchased under the normal course issuer bid, or other statements that are not statements of fact. When used in this news release, words such as “estimate,” “intend,” “expect,” “anticipate,” “will”, “believe”, “potential” and similar expressions are intended to identify forward-looking statements, which, by their very nature, are not guarantees of the Company’s future operational or financial performance, and are subject to risks and uncertainties and other factors that could cause the Company’s actual results, performance, prospects or opportunities to differ materially from those expressed in, or implied by, these forward-looking statements. These risks, uncertainties and factors may include, but are not limited to the market price of the Shares being too high to ensure that purchases benefit the Company and its shareholders, and other factors.
Readers are cautioned not to place undue reliance on these forward-looking statements, which speak only as of the date of this news release or as of the date otherwise specifically indicated herein. Due to risks and uncertainties, including the risks and uncertainties identified in this news release, and other risk factors and forward-looking statements listed in the Company’s MD&A for the year ended December 31, 2024 (the “MD&A”), and the most recently filed Annual Information Form (“AIF”) for the year ended December 31, 2024, actual events may differ materially from current expectations. More information about the Company, including the MD&A, the AIF and financial statements of the Company, is available on SEDAR+ at www.sedarplus.ca and on the SEC’s EDGAR website at www.sec.gov.
Vancouver, British Columbia–(Newsfile Corp. – February 4, 2025) – EMX Royalty Corporation (NYSE American: EMX) (TSXV: EMX) (the “Company” or “EMX”) congratulates EMX board member, Mr. Chris Wright, on his confirmation as U.S. Secretary of Energy under President Donald Trump. Mr. Wright was confirmed as Secretary on February 3, 2025 in a bipartisan vote in the U.S. Senate and will now join the Cabinet of the United States in Washington, D.C. Mr. Wright is known for his innovations and entrepreneurial contributions to the energy sector, but also for his focus on humanitarian efforts such as co-founding the Bettering Human Lives Foundation. He has been a spirited contributor at EMX board meetings and management discussions. As a consequence of his confirmation, Mr. Wright will step down from the board of EMX. The Company sincerely thanks Mr. Wright for his contributions at EMX and is excited to observe his future role in leading and shaping the energy policy of the United States.
About EMX – EMX is a precious and base metals royalty company. EMX’s investors are provided with discovery, development, and commodity price optionality, while limiting exposure to risks inherent to operating companies. The Company’s common shares are listed on the NYSE American Exchange and TSX Venture Exchange under the symbol “EMX”. Please see www.EMXroyalty.com for more information.
Neither the TSX Venture Exchange nor its Regulation Services Provider (as that term is defined in policies of the TSX Venture Exchange) accepts responsibility for the adequacy or accuracy of this release
Forward-Looking Statements
This news release may contain “forward looking statements” that reflect the Company’s current expectations and projections about its future results. These forward-looking statements may include statements regarding perceived merit of properties, exploration results and budgets, mineral reserves and resource estimates, work programs, capital expenditures, timelines, strategic plans, market prices for precious and base metal, or other statements that are not statements of fact. When used in this news release, words such as “estimate,” “intend,” “expect,” “anticipate,” “will”, “believe”, “potential” and similar expressions are intended to identify forward-looking statements, which, by their very nature, are not guarantees of the Company’s future operational or financial performance, and are subject to risks and uncertainties and other factors that could cause the Company’s actual results, performance, prospects or opportunities to differ materially from those expressed in, or implied by, these forward-looking statements. These risks, uncertainties and factors may include, but are not limited to unavailability of financing, failure to identify commercially viable mineral reserves, fluctuations in the market valuation for commodities, difficulties in obtaining required approvals for the development of a mineral project, increased regulatory compliance costs, expectations of project funding by joint venture partners and other factors.
Readers are cautioned not to place undue reliance on these forward-looking statements, which speak only as of the date of this news release or as of the date otherwise specifically indicated herein. Due to risks and uncertainties, including the risks and uncertainties identified in this news release, and other risk factors and forward-looking statements listed in the Company’s MD&A for the quarter ended September 30, 2024 (the “MD&A”), and the most recently filed Annual Information Form (“AIF”) for the year ended December 31, 2023, actual events may differ materially from current expectations. More information about the Company, including the MD&A, the AIF and financial statements of the Company, is available on SEDAR at www.sedarplus.ca and on the SEC’s EDGAR website at www.sec.gov.
Vancouver, British Columbia–(Newsfile Corp. – February 3, 2025) – EMX Royalty Corporation (NYSE American: EMX) (TSXV: EMX) (the “Company” or “EMX”) is pleased to announce that the Company has, pursuant to Royalty Agreement (“Agreement”) announced on January 6, 2025 with Minera Pampa de Cobre S.A.C. (“MPC”), acquired the additional 1% Net Smelter Returns (“NSR”) royalty interest on the Chapi Copper Mine Property for US$7,000,000. MPC is owned indirectly by a privately held Canadian company, Quilla Resources Inc.
EMX now holds a 2% NSR royalty on the Chapi Copper Mine Property, for a total consideration of US$10,000,000. The Agreement includes a 2% NSR royalty on minerals produced from the approximately 26,000 hectare property (“Property Royalty”) owned by MPC, as well as a 2% NSR royalty from any minerals that are produced from outside the Property Royalty area, but that are processed at the Chapi Mine processing facilities. The Agreement also includes a two-kilometer area of interest (“AOI”) around the Property Royalty area, and any property acquired by MPC within this AOI will also be subject to a 2% NSR royalty.
For more information on the Royalty Agreement and the Chapi Copper Mine Property, please refer to the Company’s news release published on January 6, 2025.
About EMX – EMX is a precious and base metals royalty company. EMX’s investors are provided with discovery, development, and commodity price optionality, while limiting exposure to risks inherent to operating companies. The Company’s common shares are listed on the NYSE American Exchange and TSX Venture Exchange under the symbol “EMX”. Please see www.EMXroyalty.com for more information.
Neither the TSX Venture Exchange nor its Regulation Services Provider (as that term is defined in policies of the TSX Venture Exchange) accepts responsibility for the adequacy or accuracy of this release
Forward-Looking Statements
This news release may contain “forward looking statements” that reflect the Company’s current expectations and projections about its future results. These forward-looking statements may include statements regarding perceived merit of properties, exploration results and budgets, mineral reserves and resource estimates, work programs, capital expenditures, timelines, strategic plans, market prices for precious and base metal, or other statements that are not statements of fact. When used in this news release, words such as “estimate,” “intend,” “expect,” “anticipate,” “will”, “believe”, “potential” and similar expressions are intended to identify forward-looking statements, which, by their very nature, are not guarantees of the Company’s future operational or financial performance, and are subject to risks and uncertainties and other factors that could cause the Company’s actual results, performance, prospects or opportunities to differ materially from those expressed in, or implied by, these forward-looking statements. These risks, uncertainties and factors may include, but are not limited to unavailability of financing, failure to identify commercially viable mineral reserves, fluctuations in the market valuation for commodities, difficulties in obtaining required approvals for the development of a mineral project, increased regulatory compliance costs, expectations of project funding by joint venture partners and other factors.
Readers are cautioned not to place undue reliance on these forward-looking statements, which speak only as of the date of this news release or as of the date otherwise specifically indicated herein. Due to risks and uncertainties, including the risks and uncertainties identified in this news release, and other risk factors and forward-looking statements listed in the Company’s MD&A for the quarter ended September 30, 2024 (the “MD&A”), and the most recently filed Annual Information Form (“AIF”) for the year ended December 31, 2023, actual events may differ materially from current expectations. More information about the Company, including the MD&A, the AIF and financial statements of the Company, is available on SEDAR at www.sedarplus.ca and on the SEC’s EDGAR website at www.sec.gov.
Diamcor Mining has received an investment from a Dubai-based diamond manufacturer that will allow it to advance various projects at its South African operation.
The mining company, which operates the Krone-Endora at Venetia project, will use the funds to expedite the processing of previously stockpiled oversized material, increase processing volume, and develop work programs it currently has underway, it said Monday. It will also further its bulk sampling.
Diamcor did not provide the name of the Dubai-based company but did note it was a “manufacturer and supplier of bridal and anniversary diamonds to the global market.” The miner also said the manufacturer would not receive shares in Diamcor in return for the funding.
“This financing is the result of long-term relationships we have developed with key associates in Dubai over many years and the mutual vision our companies share on the merits of building a growing supply of gem-quality non-conflict natural rough diamonds for the luxury-jewelry sector,” said Diamcor CEO Dean Taylor. “While 2024 was a challenging year for everyone in the diamond industry, we believe the factors responsible for this will ultimately begin to stabilize by the second half of 2025, and this financing will help to ensure we are well-positioned and ready for this anticipated recovery.”
KELOWNA, BC / ACCESS Newswire / January 27, 2025 / Diamcor Mining Inc. (TSX-V:DMI)(OTCQB:DMIFF)(FRA:DC3A), (“Diamcor” or the “Company”), a well-established Canadian diamond mining company with a proven history in the mining, exploration, and sale of rough diamonds is pleased to announce the Company has entered into a non-binding letter of intent for a non-dilutive financing (the “Financing”) of up to USD $5,000,000 with a well-established Dubai based manufacturer and supplier of bridal and anniversary diamonds to the global market. The commercial terms of the Financing will be finalized in the course of negotiating the associated definitive documentation and are expected to include a security interest, an interest component and a revenue participation component. The proceeds of the Financing will be used to expedite the processing of previously stockpiled oversized material, the concurrent deployment of additional assets aimed at significantly increasing processing volumes for the long-term at the Company’s Krone-Endora at Venetia Project (the “Project”), as well as, the continued advancement of the work programmes previously underway, bulk sampling in the greater areas of the Project, and for general corporate purposes. There will be no issuance of any shares or warrants associated with the Financing.
“This financing is the result of long-term relationships we have developed with key associates in Dubai over many years, and the mutual vision our companies share on the merits of building a growing supply of gem quality non-conflict natural rough diamonds for the luxury jewelry sector”, noted Diamcor CEO Mr. Dean Taylor. “While 2024 was a challenging year for everyone in the diamond industry, we believe the factors responsible for this will ultimately begin to stabilize by the second half of 2025, and this financing will help to ensure we are well positioned and ready for this anticipated recovery”.
The Financing is subject to the regulatory approval of the TSX Venture Exchange along with completion of all definitive documentation and filings as required.
Results of 2024 Annual General and Special Meeting
The Company also wishes to announce that Shareholders passed each of the resolutions described in the Company’s proxy materials by the required majority of voting at the Company’s Annual General and Special Meeting (the “AGM”) held on December 30, 2024.
The total number of votes cast for each resolution is set out in the table below.
NUMBER OF SHARES
PERCENTAGE OF VOTES CAST
MOTIONS
FOR
AGAINST
WITHHELD/ ABSTAIN
RESTRICTED
NON VOTE
FOR
AGAINST
WITHHELD/ ABSTAIN
Number of Directors
88,320,583
203,568
0
0
0
99.77%
0.23%
0.00%
Dean H. Taylor
86,003,393
0
1,380,398
0
1,140,360
98.42%
0.00%
1.58%
Darren Vucurevich
86,642,334
0
741,457
0
1,140,360
99.15%
0.00%
0.85%
Dr. Stephen Haggerty
86,847,334
0
536,457
0
1,140,360
99.39%
0.00%
0.61%
D. Wayne Howard
87,365,156
0
18,365
0
1,140,360
99.98%
0.00%
0.02%
Appointment of Auditors
88,524,116
0
35
0
0
100.0%
0.00%
0.00%
Amendment to Stock Option Plan
64,644,242
*
2,183,438
0
20,556,111
1,140,360
96.73%
3.27%
0.00%
*Excluding 20,556,111 shares held by Insiders
TOTAL SHAREHOLDERS VOTED BY PROXY: 41
TOTAL SHARES ISSUED & OUTSTANDING: 168,638,937
TOTAL SHARES VOTED: 88,524,151
TOTAL % OF SHARES VOTED: 52.49%
About Diamcor Mining Inc.
Diamcor Mining Inc. is a fully reporting publicly traded Canadian diamond mining company with a well-established proven history in the mining, exploration, and sale of rough diamonds. The Company’s primary focus is on the mining and development of its Krone-Endora at Venetia Project which is co-located and directly adjacent to De Beers’ Venetia Diamond Mine in South Africa. The Venetia diamond mine is recognized as one of the world’s top diamond-producing mines, and the deposits which occur on Krone-Endora have been identified as being the result of shift and subsequent erosion of an estimated 50M tonnes of material from the higher grounds of Venetia to the lower surrounding areas in the direction of Krone and Endora. Well known Luxury Retailer Tiffany & Co provided the Company with financing to expedite the advancement of the Project and holds a first right of refusal to acquire rough diamonds under 10.8 carats in size at then market prices for the life of the Project. The Company focuses on the acquisition and development of mid-tier projects with near-term production capabilities and growth potential and uses unique approaches to mining that involves the use of advanced technology and techniques to extract diamonds in a safe, efficient, and environmentally responsible manner. The Company has a strong commitment to social responsibility, including supporting local communities and protecting the environment.
About the Krone-Endora at Venetia Project
Diamcor acquired the Krone-Endora at Venetia Project from De Beers Consolidated Mines Limited, consisting of the prospecting rights over the farms Krone 104 and Endora 66, which represent a combined surface area of approximately 5,888 hectares directly adjacent to De Beers’ flagship Venetia Diamond Mine in South Africa. The Company subsequently announced that the South African Department of Mineral Resources had granted a Mining Right for the Krone-Endora at Venetia Project encompassing 657.71 hectares of the Project’s total area of 5,888 hectares. The Company is also advancing an application for a mining right over the remaining areas of the Project. The deposits which occur on the properties of Krone and Endora have been identified as a higher-grade “Alluvial” basal deposit which is covered by a lower-grade upper “Eluvial” deposit. These deposits are proposed to be the result of the direct-shift (in respect to the “Eluvial” deposit) and erosion (in respect to the “Alluvial” deposit) of an estimated 1,000 vertical meters of material from the higher grounds of the adjacent Venetia Kimberlite areas. The deposits on Krone-Endora occur with a maximum total depth of approximately 15.0 metres from surface to bedrock, allowing for a very low-cost mining operation to be employed with the potential for near-term diamond production from a known high-quality source. Krone-Endora also benefits from the significant development of infrastructure and services already in place due to its location directly adjacent to the Venetia Mine, which is widely recognised as one of the top producing diamond mines in the world.
Qualified Person Statement:
Mr. James P. Hawkins (B.Sc., P.Geo.), is Manager of Exploration & Special Projects for Diamcor Mining Inc., and the Qualified Person in accordance with National Instrument 43-101 responsible for overseeing the execution of Diamcor’s exploration programmes and a Member of the Association of Professional Engineers and Geoscientists of Alberta (“APEGA”). Mr. Hawkins has reviewed this press release and approved of its contents.
This press release contains certain forward-looking statements. While these forward-looking statements represent our best current judgement, they are subject to a variety of risks and uncertainties that are beyond the Company’s ability to control or predict and which could cause actual events or results to differ materially from those anticipated in such forward-looking statements. Further, the Company expressly disclaims any obligation to update any forward looking statements. Accordingly, readers should not place undue reliance on forward-looking statements.
WE SEEK SAFE HARBOUR
Neither TSX Venture Exchange nor its Regulation Services Provider (as that term is defined in policies of the TSX Venture Exchange) accepts responsibility for the adequacy or accuracy of this release.
At Proven and Probable, we dive deep into the latest developments shaping the world of mining, royalties, and resource investments. 📈 Here’s what’s making headlines at EMX Royalty Corporation:
🔹 Strong Financial Results: EMX’s latest financial update showcases robust performance and strategic fiscal management. 🔹 Share Buyback Completion: The successful conclusion of their $5 million share buyback program underscores their commitment to enhancing shareholder value. 🔹 Strategic Divestment: EMX has executed an agreement to sell four projects in the western USA to Pacific Ridge Exploration, streamlining their portfolio. 🔹 Armenia Expansion: The acquisition of royalty interests in Hayasa’s Urasar Project further solidifies EMX’s position in the region. 🔹 Peruvian Opportunity: EMX’s purchase of a royalty on the Chapi Copper Mine highlights their continued focus on high-potential assets globally.
This is a pivotal moment for EMX Royalty, showcasing their strategic approach to growth, value creation, and global asset diversification.
A conversation with Maurice Jackson of ‘Proven and Probable’ and David Cole of EMX Royalty, the Royalty Generator – NYSE: EMX | TSX.V: EMX
Maurice: EMX Royalty is off to a strong start in 2025. For readers, could you briefly introduce EMX Royalty and its unique investment proposition?
David: Certainly. I’ll start by saying royalties are phenomenal financial instruments embedded with huge optionality, and you want to be exposed to a lot of royalties. My fundamental thesis is that the value of mineral rights is only going to go up over time, as it has throughout our lifetimes. The best way to be exposed to mineral rights is through royalty ownership.
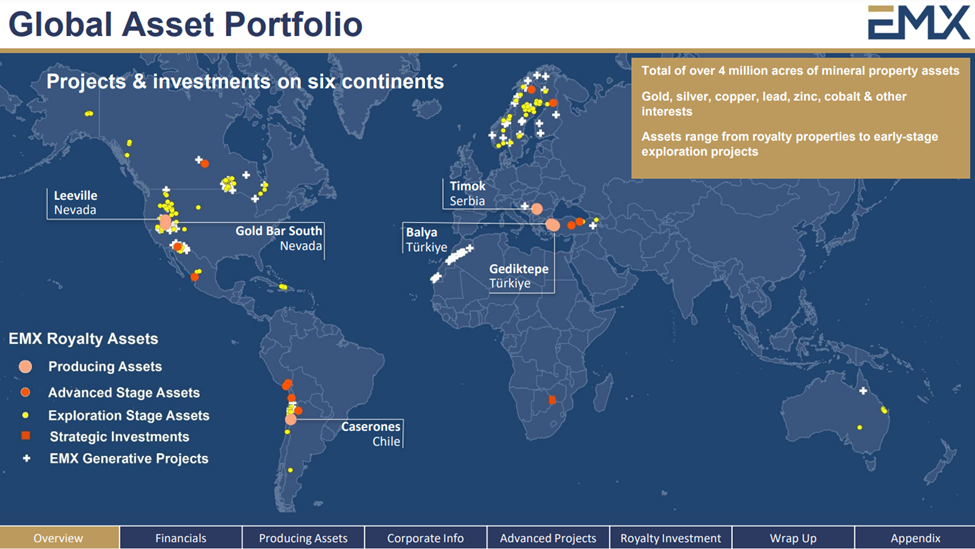
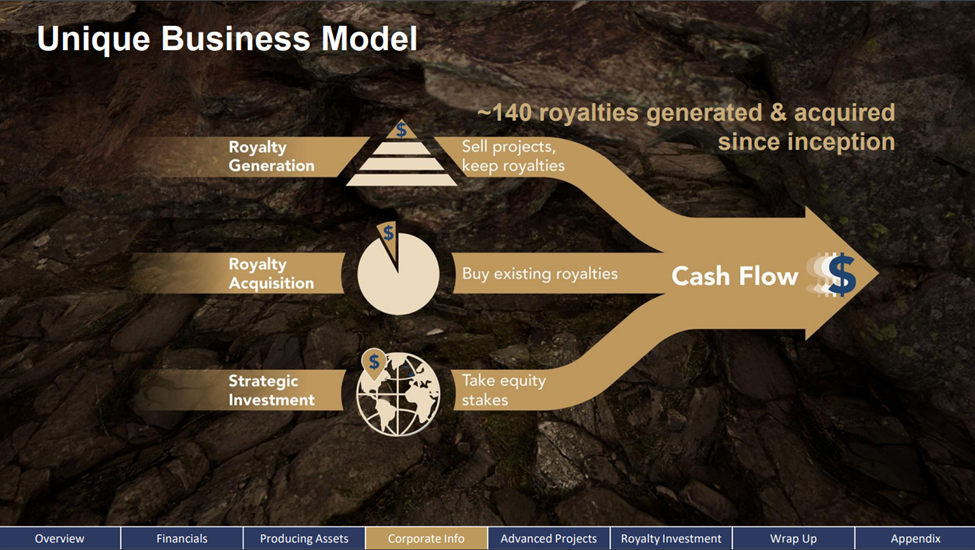
We accumulate royalties around the world, spanning 14 countries, and have built a portfolio of over 150 royalties. We do this through two primary mechanisms: acquiring royalties and generating royalties ourselves by acquiring mineral rights, adding value through geological data, selling assets, and retaining royalties.
Additionally, we make strategic investments along the way, which have been quite profitable. By integrating these three aspects into a synergistic business model, we have built a significant portfolio over the past two decades.
Maurice: You just referenced optionality. Could you expand on that term for someone who might be new to it?
David: That’s a fair question, Maurice, and I get asked about optionality often. It’s a common term within the industry. Essentially, optionality refers to the potential for outcomes—both good and bad—associated with an asset over time. There’s value that can be attributed to this potential.
The most significant aspect of optionality, in our view, is the potential for new discoveries. For example, if we generate or acquire a royalty on a project with a known resource—let’s say, a million ounces of gold in reserve with a 1% royalty—and during production, the geologists discover another half a million or even a million ounces, that additional discovery was not factored into our original acquisition price. That’s discovery optionality.
Other aspects of optionality include commodity prices, which can fluctuate. Over the course of my career, I’ve seen prices generally increase. Over time, as geological understanding improves, infrastructure is developed, and engineering and metallurgical techniques advance, the likelihood of additional discoveries and improved project economics increases.
A great example is the Goldstrike Royalty, which Pierre Lassonde of Franco Nevada acquired for $2 million Canadian dollars. Thanks to discovery optionality and other factors, that royalty has now generated over a billion dollars in cash flow and is still paying. It’s a tremendous example of how optionality can create extraordinary returns. Not every royalty turns out that way, of course, but the potential for these outcomes is what makes royalties so compelling.
Maurice: Within your portfolio, you have the Timok investment—$200,000 initially, I believe. I don’t want to steal your thunder, so can you share the numbers with us?
David: Certainly. So far, Timok has paid about $7 million to us. But that’s just the beginning—there’s potentially half a billion dollars or more coming to us over time based on the existing, known resource. And that’s before we fully account for the new MG Discovery. Zijin Mining recently announced in their last quarterly report that they’ve made a significant, high-grade copper-gold discovery within our royalty footprint. This new discovery is called the MG Zone.
We’ve been able to see its location through satellite imagery, but Zijin hasn’t disclosed the tonnage and grade yet. They’ve indicated they’ll provide more details in their next reporting period. We expect their annual report to be released toward the end of the first quarter or early second quarter.
Maurice: That’s a fantastic example. You mentioned commodity price optionality and the cost to shareholders. Could you explain how royalties mitigate those risks and costs?
David: Absolutely. The beauty of a royalty is that we get paid on the top-line revenue of a mine. Most of our royalties are net smelter return (NSR) royalties, which means we earn a percentage—commonly 1%-4%—of the revenue the mine receives from the smelter. As royalty holders, we don’t pay for the mine’s capital expenditures, exploration costs, or reclamation expenses. We simply receive our royalty payment based on production revenue. This structure exposes us to the upside potential of a project—like discoveries or commodity price increases—without the operational risks and costs borne by the mining company.
Maurice: That’s an profitable value proposition. Let’s transition to EMX’s recent developments. The company recently reported $27 million in cash and cash equivalents and $35 million in long-term debt maturing in 2029. How does this financial standing influence your strategic decisions for 2025 and beyond?
David: Capital allocation is one of the most critical decisions we make to benefit our shareholders. With our shares trading at a discount to price-to-net-asset value (PNAV), we’ve focused on buying back stock. Over the past year, we’ve purchased 5 million shares, fully utilizing the allotment permitted by the TSX exchange. We’ll likely apply for approval to buy back more in the coming year. We’re also incrementally paying down debt and acquiring royalties, all while generating cash flow from top assets like Timok, Caserones in Chile, and Carlin Trend in Nevada.
In addition to share buybacks, we plan to incrementally pay down debt, which, by the way, is held by Franco-Nevada—our capital partner and a significant shareholder. They’ve been a great partner in various royalty acquisitions.
Maurice: For shareholders who may not fully understand, how does the share buyback program impact EMX’s financial health?
David: By reducing the number of outstanding shares, we increase each shareholder’s proportional ownership in the company. When shares are trading below NAV, buybacks effectively create value for shareholders. It’s a tax-efficient alternative to dividends and reflects our confidence in the company’s intrinsic value. Of course, we’re also growing the portfolio organically and through strategic acquisitions, as you’ve seen with recent transactions.
Maurice: Speaking of transactions, let’s start with Armenia, where EMX acquired a royalty interest in the Urasar gold-copper project. What motivated this acquisition, and what potential do you see in the project?
David: This acquisition was motivated by two factors: the geology of Armenia and our trust in the project’s steward, Dennis Moore. Dennis has a proven track record of world-class discoveries, and his involvement gives us confidence.
Geologically, Armenia offers excellent mineral potential, which aligns with our strategy of acquiring assets with strong long-term discovery potential. This royalty adds to the base of our portfolio, exposing us to future upside at minimal upfront cost.
Maurice: How does this transaction align with EMX’s broader strategy and portfolio?
David: This fits perfectly with our early-stage royalty acquisition strategy, where we aim to augment the foundation of our portfolio with assets that offer significant long-term potential.
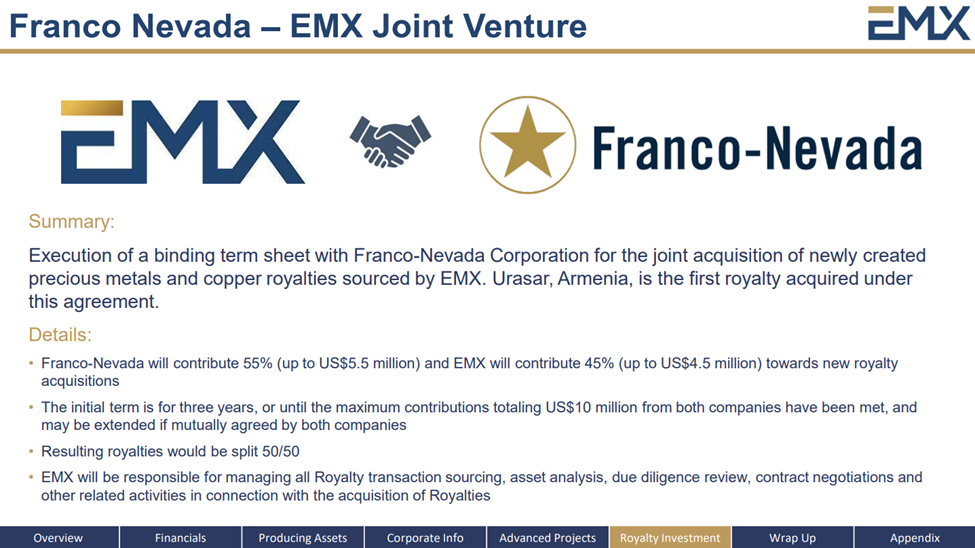
This deal was part of our joint venture with Franco-Nevada, where they provide a premium for royalties we identify and acquire. This partnership not only validates our due diligence but also allows us to achieve a financial “lift” on the transaction.
Maurice: Let’s move to South America, where EMX recently acquired a royalty on the Chapi copper mine in Peru. Could you elaborate on the significance of this acquisition?
David: Certainly. The Chapi copper mine is located in a region with world-class copper endowment. This acquisition gives us exposure to a proven project with immediate cash-flow potential and substantial long-term discovery potential.
This project is being restarted by a team with a solid track record of copper production, and we anticipate cash flow within a couple of years. Beyond the restart, the exploration upside is what excites us most—it’s a classic example of how optionality can transform a royalty into a company-making asset.
Maurice: The optionality in the Chapi copper mine acquisition seems consistent with EMX’s strategy. Can you expand on the timing and significance of securing cash-flowing assets like this?
David: Acquiring cash-flowing or near-term cash-flowing assets is a deliberate part of our strategy. While we excel at generating royalties organically, the reality is that acquiring royalties on producing or development-stage assets can accelerate the financial returns to our shareholders.
The Chapi royalty exemplifies this. It strengthens our portfolio’s cash flow potential while maintaining long-term upside through exploration. By securing a mix of cash-flowing and earlier-stage royalties, we achieve a balanced portfolio that supports near-term financial health and long-term growth.
Maurice: Sticking in Peru, where EMX received an early property payment from Aftermath Silver. Aftermath Silver made an early $2.9 million property payment for the Berenguela project in Peru. How does this early payment impact EMX’s cash flow and plans for similar agreements?
David: EMX is fully supportive of what Aftermath Silver is doing on the ground there. They’re advancing a very interesting manganese and silver deposit, with some copper exploration on the property as well. We’re quite interested in that long-term copper optionality; there’s potential for the discovery of new copper deposits. But the manganese and silver deposit is particularly compelling.
The manganese, of course, is an important metal in the battery business, and this deposit has the potential to be a key source of manganese for batteries. That said, we’ll let them work on that. For us, a nice aspect is that we’re just sitting back here as a royalty holder. There are specific payments that have to be made to us over time. We’ve allowed them some flexibility—one payment was made a little late in exchange for an interest fee, and another was made a little early for a small reduction. We’re supportive of them advancing this asset. I believe it’s being managed by some very capable people.
Maurice: A good symbiotic relationship there. Now, let’s visit the U.S., where EMX announced the sale of four projects to Pacific Ridge Exploration. What benefits does this transaction bring to EMX, and how does it align with your growth strategy?
David: This is right down the alley of EMX’s bread-and-butter royalty generation business. We go out, acquire prospective mineral rights—commonly very inexpensively—consolidate data, collect additional field data, and illustrate prospectivity by building geological models. These models demonstrate the potential for significant gold or copper deposits. We then sell the projects on, often to junior companies, for a combination of commercial terms. These typically include share payments, incremental payments over time, and always a royalty at the end of the day.
This transaction with Pacific Ridge is just another example of what we do repeatedly—roughly 20 projects a year, and we might exceed that this year. These deals build long-term discovery optionality at the base of our portfolio pyramid. At the top, we have producing royalties; at the base, we have exploration assets being advanced using other people’s expertise and money, with EMX as the long-term beneficiary.
Maurice: Diversification seems to be a recurring theme in EMX’s strategy. How does the company ensure that its acquisitions align with its broader objectives?
David: Diversification is indeed one of our core principles. When evaluating acquisitions, we focus on several key criteria: the quality of the underlying asset, the jurisdiction, the operator’s track record, and the potential for long-term upside.
Our acquisitions span various geographies, commodities, and stages of development to reduce risk and enhance returns. For example, our portfolio includes royalties on gold, copper, and polymetallic projects in North and South America, Europe, Asia, and Australia. This global reach allows us to capitalize on opportunities in different markets while mitigating exposure to regional risks.
Maurice: It’s clear that EMX has been strategic in its acquisitions. As we wrap up, what’s next for the company in 2025 and beyond?
David: We’re fortunate to be in a strong position with positive cash flow for seven consecutive quarters. We anticipate this continuing for some time, driven by key assets like our Caserones royalty in Chile, operated by Lundin Mining Corporation. That’s performing nicely, with significant exploration work ongoing.
Zijin Mining is also producing at Timok in Serbia, generating handsome payments. Additionally, our royalty on the Carlin Trend in Nevada—advanced and produced by Barrick as part of their joint venture with Newmont—is generating over $4 million annually.
With these assets delivering robust returns, our focus is on astute capital allocation. This includes paying down debt, buying back shares while undervalued, and pursuing incremental acquisitions like the one at the Chapi Mine in Peru.
Maurice: Has EMX considered changing its logo to a cow surrounded by cash? EMX is quite literally becoming a cash cow.
David: I’ve said for years we’d become one, and we have! We’re thrilled to be in this position, allocating cash strategically to grow the portfolio, buy more royalties, and repurchase shares when the price is low. Managing long-term debt and driving shareholder value remains our priority.
Maurice: You’ve touched on this, but how do you plan to navigate potential challenges in the current market environment?
David: The money is coming in, and our royalties are performing exceptionally well. While metal prices are strong, the natural resource capital markets have been tough. It’s an intriguing bifurcation, but we’re capitalizing on our strengths.
By buying back stock at a discount to our net asset value, we maximize value. Once rectified, we’ll allocate more capital to expand the royalty portfolio. It’s about understanding and deploying our capital effectively in any market.
Our portfolio also boasts exciting developments. For instance, Zijin’s MG Zone in Serbia, with 12 drill rigs on-site, is remarkable. South 32’s Peak Discovery in Arizona could be a game-changer with promising copper-zinc-silver drill results. These discoveries reinforce why owning royalties is so valuable.
Maurice: Absolutely! In closing, what did I forget to ask?
David: Nothing comes to mind, Maurice. Insider buying, share buybacks, strong cash flow, and global discoveries—all make EMX a company worth following.
Maurice: If someone wants to learn more about EMX Royalty, where can they go?