Categories
Exclusive Interviews Precious Metals

KEVIN VECMANIS What Happens When Central Banks Unwind Balance Sheets

Kevin Vecmains the founder of VanAurum Financial Technologies sits down with Maurice Jackson of Proven and Probable to discuss: What Happens When Central Banks Unwind Balance Sheets.

VIDEO

AUDIO

TRANSCRIPTS

Contributed Opinion

Source: Maurice Jackson for Streetwise Reports  (1/30/19)

Maurice JacksonKevin Vecmanis, founder of VanAurum Financial Technologies, sits down with Maurice Jackson of Proven and Probable to discuss what the unwinding of central bank balance sheets may mean for investors.

Dollar
Maurice J.: Joining us for a conversation is Kevin Vecmanis, the founder of VanAurum Financial Technologies. Mr. Vecmanis, welcome to the show, sir.
Kevin V.: Hello, Maurice. It’s great to be here. Thanks a lot.
Maurice J.: Glad to have you back on the program. In our last interview, we addressed the value proposition for the next capital vortex. Today, we will address central banks unwinding their balance sheets, and the duplicitous effects that may occur. And what actions you, the investor, may take to prepare yourself.
But before we begin, Kevin, your company uses a unique skill set that I find intriguing, which is artificial intelligence for investing. For our first time listeners, please introduce us to VanAurum Financial Technologies.
Kevin V.: VanAurum is an intelligent lead generator for trading opportunities. That’s probably the best way to summarize it. We use machine learning techniques to detect anomalies, and unusual market behavior and then we report on it to members on a daily basis.
Our platform attracts a global cross-section of sectors, ratios and economic data points. And then when something occurs that has some kind of historical precedent for being either positive or negative for forward returns, VanAurum will report on it to members.
We believe that by having an intelligent filter that’s hand-picking market events to look at, it frees up our members’ time to focus their efforts on more productive means, such as, constructing trading strategies and or analysis on their own. So if someone uses a charting service, or trades on technical analysis, VanAurum’s definitely worthy of membership consideration.
Maurice J.: Kevin, your research has noted a mega trend occurring that is related to central banks unwinding their balance sheets. Beginning at the 10,000-foot level, can you share with us why central banks are unwinding their balance sheets, and what this means for investors?
Kevin V.: Stepping back for a moment, in 2009, the Federal Reserve came up with an explicit program called Quantitative Easing, to buy mortgage-backed securities and other debt-related securities from the balance sheets of different institutions, and most central banks globally eventually caught on to this well, to bail out financial institutions in the sector that were carrying this “toxic debt” on their balance sheets.
The Fed conversely grew its balance sheet from about $800 billion to almost $4.5 trillion. And it was maintaining it at that level for a while. When the Fed is maintaining the size of its balance sheet with these debt-related securities what its intentions are as follows: as the securities mature on its balance sheet, it is actively seeking out other similar securities to buy to replace them, so that the Fed can keep the size of its balance sheet at a constant level.
So, the process of expanding the balance sheet, as well as maintaining it at a certain level, there was an implicit assumption in the market that the central bank was going to be there, and be a significant source of debt demand for a lot of these securities, which would be the primary driver behind interest rates ultimately hitting rock-bottom yields. The Fed was such a heavy influence on interest rates that, in January of 2018, the yield on the S&P 500 was about 1.73%. And the yield on the three-month Treasuries, which is considered to be the United States’ riskless asset, was higher than that.
The end result is that the S&P equity yields, which are considered to be risky assets on somebody’s balance sheet, or within their portfolio, these yields are essentially risk-free. Which is a really amazing thing if you think about it. A situation that is really unsustainable.
Going forward, the Fed has now communicated that it is going to shrink the size of its balance sheet. So in effect what that’s actually doing is removing a major source of demand out the market, for not only U.S. Treasuries, but other mortgage-backed securities as well. This is a simple supply and demand factor. The likelihood of supply and demand to equalize will not be accomplished until rates are much higher.
Maurice J.: I always find it disingenuous that the U.S. Treasury references the nominal rate of return and omits the real rate of return on Treasuries.
Twofold question here for you. How will this impact currencies and capital markets?
Kevin V.: We have witnessed the Fed go through hiking cycles in the past, typically any kind of economic turmoil that led to a flight to safe haven assets increased the demand for Treasuries and the U.S. dollar.
I am of the opinion that the Federal Reserve is in a bit of a tricky situation right now. And over time, more and more investors are going to actually start picking up on this. In a historical context, the level to which they’ve actually raised interest rates is not really that high. What is unprecedented is the extended period of time that the Fed has pinned along interest rates to zero. The Fed recognizes that it needs to raise rates because it has artificially suppressed interest rates, which were driving the yields on the S&P and of bonds respectively to disproportionate levels.
Should the market witness again that the Federal Reserve is willing to reverse course, by printing currency (inflation) to buy up a lot of assets and thus further expand its balance sheet again, I believe the market will react violently to the Fed’s attempts. I think this time around, the impact could actually be very negative on the U.S. dollar and Western currencies as investors will begin to realize maybe how unsustainable some of the debt trajectories actually are.
Maurice J.: If currencies and equities will be negatively impacted, what is the prudent investment decision that one should make now?
Kevin V.: In this situation, I like to look at what were the major beneficiaries within the broad markets when the Federal Reserve decided to embark down this path of explicit balance sheet expansion. And I guess the answer to that is bonds, equities, and to a large extent, real estate within major urban centers. So we’ve seen significant inflation in a lot of these markets. They were the major beneficiaries of what I call the risk premium compression that resulted from the Fed artificially lowering interest rates.
After the crisis everybody thought that commodities and other markets like that were going to go hyperbolic. But we actually didn’t see that. And, in my opinion, a lot of the reason why we didn’t see that was because the market was front running all these explicit purchases from the central bank. Why wouldn’t you buy bonds if you knew that the Federal Reserve was going to be buying, $30, $40 billion of them a month, on an open-ended basis.
So I think that drew a lot of capital away from resource sector stocks, from commodities. Any commodity, really. And so I think this time around, when we see this whole process unwinding, to me it only seems logical that the markets that were previous beneficiaries might suffer. Conversely, the markets that didn’t benefit we will start to see a lot of those begin to mean revert. I foresee big potential in platinum, gold, resource sector stocks and energy stocks, which have been punished to a significant degree, especially within the explorers and the producers, which experienced some of the sharpest declines in record.
So, I think it all depends on how the market decides to react with the U.S. dollar. Whatever it is, we get the next major trajectory change from the Federal Reserve. But my inkling, my instincts right now, and all the data that I look at with VanAurum and our research, suggests that the U.S. dollar will probably be negatively impacted the next time around.
Maurice J.: So then the answer will be, if I’m correct here, would physical gold be the first prudent investment decision?
Kevin V.: Yes, definitely at this point. I always advocate having some allocation to gold in your portfolio, especially right now with the debt-based currencies in the West really starting to balloon out of control. But there’s lots of fear in the market right now. We’ve experienced a significant correction on the S&P 500 and the broad equities. A lot of the valuation extremes that we saw leading up to this point was causing everybody to warn of bubbles. We’ve actually seen a fair amount of that lead off. And it’s come back into nominal territories.
I sent a message out to my members earlier this week saying that at this juncture, if the correction in the S&P 500 extends into bear market territory, closer to it being down 20%, which at that point, going back to 1980 within our data that VanAurum analyzes, most of the precedence, if not all of them, are actually positive for one-year returns going forward once the market has experienced a selloff greater than 20%.
So there could be draw downs in the broad equity market from here. In September 2008, the market ultimately fell 40% before hitting its ultimate bottom. And then exactly one year later, from September 2008, the market was almost unchanged again. So, could the market accelerate to the downside again, and resume a bear market? It’s likely. But at this point, I think prudent investors will start trying to anticipate some type of accumulation program for broad equities.
I have my attention on what I would term as the kind of the forgotten markets right now, like gold, which is carving out a multi-year base; platinum, which has been absolutely crushed recently; and silver are going to do extremely well in the environment that we’re about to move into.
Maurice J.: Regarding physical precious metals, would precious metal equities be the right place to be as well, once someone has secured a position first in the physical metals?
Kevin V.: Yes, full disclosure, I have long positions in GDX and GDXJ. With VanAurum, and my research, I study sectors. There are lots of people who are really good at picking individual issues. But when we’re working with our machine learning system, for reasons that maybe are beyond the subject of this interview, we try to stick with a sector. So, I do have exposure to the gold mining equities, through GDX and GDXJ.
Depending on what the investors are looking for, royalty companies and the gold streaming companies really tend to do well during downside turmoil in gold and equity markets. We saw companies like Franco-Nevada, whose stock performed incredibly well during the gold bear market from 2011 to 2015. Where you really get your upside leverage, in the gold mining and the resource space, is when you’re dealing with an issuer whose cost of production is really close to the prevailing gold price.
What happens there is you get profit leverage. So, if you have a gold mining company that’s selling gold for $1,200 an ounce, and say its all-in cost to produce that ounce of gold are $1,199. So it’s making $1 of profit. If the price of gold increases by a dollar, then the earnings for that particular company increased by 100%. So you go from $1 to $2, you double your earnings. And so that’s what we mean by profit leverage.
You start to see a lot of the high-cost companies really start to accelerate when you see gold moving into a particularly strong bull market. I think what’s happening right now is you’re seeing a lot of the accumulation, and a lot of the higher quality issuers, and they’ve been doing well for quite some time.
But the sectors like GDX and GDXJ, I think have been languishing partly because they’re full of lots of producers that a lot of them haven’t been particularly well in this environment. But I think that will change if gold can stage a major breakout. I think you’ll see a bid under, pretty much any company that’s producing gold. And stage a breakout, and sustain it above $1,400 US.
Maurice J.: Switching gears, Mr. Vecmanis, what is the next unanswered question that VanAurum Technologies is researching? And when do you believe we will have an answer?
Kevin V.: Right now, to me the elephant in the room are interest rates, and how the market is fully going to react to the Federal Reserve removing itself as a major demand source in the debt markets. So, it seems to me like there’s a little bit of disbelief. You’re starting to see two-year Treasury yields, which is a fairly close proxy for interest rate hike expectations, you’ve seen a lot of those rates come down recently. Some of that might have been because the yields were overbought. And the bonds were due for a rally.
But to me that really is the biggest question, because the Federal Reserve was such a huge component of this equity rally that we had from 2009 until now. And I think whatever its action will be is going to be a major component of how the market plays out going forward. You can see the market starting to begin to call its bluff. But what I’m really interested in finding out is what the Federal Reserve actually intends to do. If the markets truly start to react violently to the rate hike cycle, it is going to end it? And is the Fed going to start to ease again, meaning increasing the size of its balance sheet. Or is it going to start cutting rates?
I think if the Fed starts cutting rates, having only reached the levels that they’re at, I think that’s going to be a really, really scary warning sign to market participants everywhere that the U.S. economy just can’t handle higher rates and has become almost addicted to Federal Reserve accommodation. And I think at that point, how the market reacts to that is going to be the primary determinant of which people are going to make a lot of money, and which people are going to lose a lot of money. And I think we’ll have the answer to that probably by the summertime.
Maurice J.: Truly interesting times, and unprecedented times. And I’m tickled to death to be here just to watch it all, and actually participate. Sir, last question. What did I forget to ask?
Kevin V.: I think we covered a lot, Maurice. But, I’d like to discuss a little bit about VanAurum’s AI curated newsletter that we put out daily. The core of our research service that we offer right now is our daily AI curated report, which is a combination of human and machine learning and behavior. So, I’m a big believer fundamentally in the convergence of machine learning-based systems and human-based systems. I believe the people and machines are really good at particular things. And what I try to do at VanAurum is to create workflows that combine the best of those worlds.
The AI curated report analyzes a global cross-section of assets, whether it’s Chinese stocks, Israeli stocks, resource sector stocks, yield curves and economic data points. And it figures out when something is behaving unusual in the market. It performs some hypothesis testing on it, to see if there’s any historical precedent for meaningful positive or negative returns. And then it presents that in a report to our members. And that’s kind of the launch point for the analysis that we do.
So, we’re getting this pipeline of trading and investment suggestions coming from VanAurum daily, which are really high quality. Our members love it. The feedback I get from the members is that it’s exposing them to things in markets that they wouldn’t have thought to look at before, which is really what it’s all about.
Maurice J.: For readers that want to get more information about VanAurum Financial Technologies report, please share the contact details with us.
Kevin V.: Sure. Readers and listeners can visit vanaurum.ai. And we have a public version of the report, which is delayed a certain number of days, to keep our best information fresh for our members. But if they’re interested in how that report works, there’s a link on our homepage to the public report. And they can also take a look at the other services that we offer as well.
Maurice J.: And we would like to take this opportunity to remind our listeners, if you’re interested in buying or selling physical precious metals, please call us at 855-505-1900. Or visit our website, provenandprobable.com, where we interview the most respected names in the natural resource space. You may reach us at contact@provenandprobable.com.
Kevin Vecmanis of VanAurum Financial Technologies, thank you for joining us today on Proven and Probable.
Maurice Jackson is the founder of Proven and Probable, a site that aims to enrich its subscribers through education in precious metals and junior mining companies that will enrich the world.

Disclosure: 

1) Maurice Jackson: I, or members of my immediate household or family, own shares of the following companies mentioned in this article: None. I personally am, or members of my immediate household or family are, paid by the following companies mentioned in this article: None. My company has a financial relationship with the following companies mentioned in this article: None. Proven and Probable disclosures are listed below.
2) The following companies mentioned in this article are billboard sponsors of Streetwise Reports: None. Click herefor important disclosures about sponsor fees.
3) Statements and opinions expressed are the opinions of the author and not of Streetwise Reports or its officers. The author is wholly responsible for the validity of the statements. The author was not paid by Streetwise Reports for this article. Streetwise Reports was not paid by the author to publish or syndicate this article. The information provided above is for informational purposes only and is not a recommendation to buy or sell any security. Streetwise Reports requires contributing authors to disclose any shareholdings in, or economic relationships with, companies that they write about. Streetwise Reports relies upon the authors to accurately provide this information and Streetwise Reports has no means of verifying its accuracy.
4) This article does not constitute investment advice. Each reader is encouraged to consult with his or her individual financial professional and any action a reader takes as a result of information presented here is his or her own responsibility. By opening this page, each reader accepts and agrees to Streetwise Reports’ terms of use and full legal disclaimer. This article is not a solicitation for investment. Streetwise Reports does not render general or specific investment advice and the information on Streetwise Reports should not be considered a recommendation to buy or sell any security. Streetwise Reports does not endorse or recommend the business, products, services or securities of any company mentioned on Streetwise Reports.
5) From time to time, Streetwise Reports LLC and its directors, officers, employees or members of their families, as well as persons interviewed for articles and interviews on the site, may have a long or short position in securities mentioned. Directors, officers, employees or members of their immediate families are prohibited from making purchases and/or sales of those securities in the open market or otherwise from the time of the interview or the decision to write an article until three business days after the publication of the interview or article. The foregoing prohibition does not apply to articles that in substance only restate previously published company releases. As of the date of this article, officers and/or employees of Streetwise Reports LLC (including members of their household) own securities of Franco-Nevada, a company mentioned in this article.
Proven and Probable LLC receives financial compensation from its sponsors. The compensation is used is to fund both sponsor-specific activities and general report activities, website, and general and administrative costs. Sponsor-specific activities may include aggregating content and publishing that content on the Proven and Probable website, creating and maintaining company landing pages, interviewing key management, posting a banner/billboard, and/or issuing press releases. The fees also cover the costs for Proven and Probable to publish sector-specific information on our site, and also to create content by interviewing experts in the sector. Monthly sponsorship fees range from $1,000 to $4,000 per month. Proven and Probable LLC does accept stock for payment of sponsorship fees. Sponsor pages may be considered advertising for the purposes of 18 U.S.C. 1734.
The Information presented in Proven and Probable is provided for educational and informational purposes only, without any express or implied warranty of any kind, including warranties of accuracy, completeness, or fitness for any particular purpose. The Information contained in or provided from or through this forum is not intended to be and does not constitute financial advice, investment advice, trading advice or any other advice. The Information on this forum and provided from or through this forum is general in nature and is not specific to you the User or anyone else. You should not make any decision, financial, investments, trading or otherwise, based on any of the information presented on this forum without undertaking independent due diligence and consultation with a professional broker or competent financial advisor. You understand that you are using any and all Information available on or through this forum at your own risk.

Categories
Precious Metals

SPROTT’S THOUGHTS Catalyst for Gold Locked and Loaded?

Catalyst for Gold Locked and Loaded?

Jan 29, 2019 01:00 pm
By Trey Reik, Senior Portfolio Manager, Sprott Asset Management USA, Inc.

Gold Outshines the S&P 500 in 2018

We believe that gold bullion and gold mining equities may be poised for a multi-year uptrend. Gold bullion beat U.S. equities for the month of December, the fourth quarter, and the full calendar year of 2018. Spot gold1 declined 1.58% versus the 4.39% drop in the S&P 500 Total Return Index2 in 2018 (Figure 1). Gold also outperformed most currencies last year, with the exception of the Swiss franc and the Japanese yen.
The bulk of gold’s 2018 outperformance came in the fourth quarter, on the back of the steep fall of the S&P 500 after it hit a high in late September, as shown in Figure 2. Gold rallied 7.54% in the fourth quarter, while the S&P 500 lost 13.52%. The rise in gold mining equities was also impressive in Q4, with Sprott Gold Miners ETF (SGDM)3 gaining 12.63%.
To read the rest of the article CLICK HERE.
 

1 Spot gold is measured by the XAU: The ISO 4217 standard code for one troy ounce of gold, considered as a currency.
2 S&P 500® Total Return Index represents 505 stocks issued by 500 large companies with market capitalizations of at least $6.1 billion, and reflects reinvestment of dividends. This Index is viewed as a leading indicator of U.S. equities and a reflection of the performance of the large-cap universe. The TR Index represents dividends reinvested.
3 Sprott Gold Miners ETF (NYSE: SGDM) seeks to deliver exposure to the Sprott Zacks Gold Miners Index (NYSE: ZAXSGDM). The Index aims to track the performance of large to mid-capitalization gold companies whose stocks are listed on major U.S. exchanges

Read in browser »
share on Twitter Like Catalyst for Gold Locked and Loaded? on Facebook

Recent Articles:

The Palladium Play – Part 2
Sprott Gold Report: Housing Crunch
Sprott Gold Report: Everything is Cool
Sprott Gold Report: Brinkmanship
Sprott Gold Report: Physical Matters

Sprott U.S. Media, Inc. is a wholly owned subsidiary of Sprott Inc., which is a public company listed on the Toronto Stock Exchange and operates through its wholly-owned direct and indirect subsidiaries: Sprott Asset Management LP, an adviser registered with the Ontario Securities Commission; Sprott Private Wealth LP, an investment dealer and member of the Investment Industry Regulatory Organization of Canada; Sprott Global Resource Investments Ltd., a US full service broker-dealer and member FINRA/SIPC; Sprott Asset Management USA Inc., an SEC Registered Investment Advisor; and Resource Capital Investment Corp., also an SEC Registered Investment Advisor. We refer to the above entities collectively as “Sprott”.
The information contained herein does not constitute an offer or solicitation by anyone in any jurisdiction in which such an offer or solicitation is not authorized or to any person to whom it is unlawful to make such an offer or solicitation.
Forward-Looking Statement
This report contains forward-looking statements which reflect the current expectations of management regarding future growth, results of operations, performance and business prospects and opportunities. Wherever possible, words such as “may”, “would”, “could”, “will”, “anticipate”, “believe”, “plan”, “expect”, “intend”, “estimate”, and similar expressions have been used to identify these forward-looking statements. These statements reflect management’s current beliefs with respect to future events and are based on information currently available to management. Forward-looking statements involve significant known and unknown risks, uncertainties and assumptions. Many factors could cause actual results, performance or achievements to be materially different from any future results, performance or achievements that may be expressed or implied by such forward-looking statements. Should one or more of these risks or uncertainties materialize, or should assumptions underlying the forward-looking statements prove incorrect, actual results, performance or achievements could vary materially from those expressed or implied by the forward-looking statements contained in this document. These factors should be considered carefully and undue reliance should not be placed on these forward-looking statements. Although the forward-looking statements contained in this document are based upon what management currently believes to be reasonable assumptions, there is no assurance that actual results, performance or achievements will be consistent with these forward-looking statements. These forward-looking statements are made as of the date of this presentation and Sprott does not assume any obligation to update or revise.
Views expressed regarding a particular company, security, industry or market sector should not be considered an indication of trading intent of any fund or account managed by Sprott. Any reference to a particular company is for illustrative purposes only and should not to be considered as investment advice or a recommendation to buy or sell nor should it be considered as an indication of how the portfolio of any fund or account managed by Sprott will be invested.
Past performance does not guarantee future results. The views and opinions expressed herein are those of the author’s as of the date of this commentary, and are subject to change without notice. This information is for information purposes only and is not intended to be an offer or solicitation for the sale of any financial product or service or a recommendation or determination by Sprott Global Resource Investments Ltd. that any investment strategy is suitable for a specific investor. Investors should seek financial advice regarding the suitability of any investment strategy based on the objectives of the investor, financial situation, investment horizon, and their particular needs. This information is not intended to provide financial, tax, legal, accounting or other professional advice since such advice always requires consideration of individual circumstances. The products discussed herein are not insured by the FDIC or any other governmental agency, are subject to risks, including a possible loss of the principal amount invested.
Generally, natural resources investments are more volatile on a daily basis and have higher headline risk than other sectors as they tend to be more sensitive to economic data, political and regulatory events as well as underlying commodity prices. Natural resource investments are influenced by the price of underlying commodities like oil, gas, metals, coal, etc.; several of which trade on various exchanges and have price fluctuations based on short-term dynamics partly driven by demand/supply and also by investment flows. Natural resource investments tend to react more sensitively to global events and economic data than other sectors, whether it is a natural disaster like an earthquake, political upheaval in the Middle East or release of employment data in the U.S. Low priced securities can be very risky and may result in the loss of part or all of your investment.  Because of significant volatility,  large dealer spreads and very limited market liquidity, typically you will  not be able to sell a low priced security immediately back to the dealer at the same price it sold the stock to you. In some cases, the stock may fall quickly in value. Investing in foreign markets may entail greater risks than those normally associated with domestic markets, such as political, currency, economic and market risks. You should carefully consider whether trading in low priced and international securities is suitable for you in light of your circumstances and financial resources. Past performance is no guarantee of future returns. Sprott Global, entities that it controls, family, friends, employees, associates, and others may hold positions in the securities it recommends to clients, and may sell the same at any time.
Copyright © 2019 Sprott US Media, All rights reserved.
You are receiving this email because you requested information about the Sprott Group.
Our mailing address is:

Sprott US Media

1910 Palomar Point Way Ste 200

CarlsbadCA 92008-5578

Add us to your address book

Categories
Base Metals Precious Metals Project Generators

MILLROCK Announces Drilling Results From La Navidad Gold Project, Sonora State, Mexico And Corporate Developments

VANCOUVER, BRITISH COLUMBIA, January 29, 2019 – Millrock Resources Inc. (TSX-V: MRO, OTCQX: MLRKF) (“Millrock” or the “Company”) reports that results from a drilling program completed at the La Navidad gold project in Sonora State, Mexico have been received. The program focused on the northwestern portion of the project. Four holes were drilled at El Tigre prospect, where gold had been detected by soil sampling in the vicinity of historic mine workings. The drill holes tested induced polarization geophysical anomalies and northwest-trending high-angle structures that appear to control mineralization observed at surface. Four further holes tested El Chupadero prospect where alteration (decalcification and jasperoid replacement of limestone) pointed to the possibility of an intrusion-related gold deposit. In total, eight holes totaling 1,844 meters were drilled in the program. The exploration work was funded under an option to joint venture agreement by Centerra Gold Inc. (“Centerra”).
The drilling results were generally disappointing. Only a few weakly anomalous gold values were returned. The alteration and mineralization observed at surface appear to weaken in the subsurface. It does not appear that further exploration work on these prospects is warranted.
Millrock has received notification from Centerra that it is terminating the option to joint venture agreements on both La Navidad and El Picacho gold projects.
Millrock President & CEO Gregory Beischer stated “Millrock thanks Centerra for the investment they made in advancing these projects. While Centerra has elected to leave, we strongly believe the projects have excellent technical merit. We think they will be attractive to mid-tier or smaller mining companies. Our intention is to seek out new funding partners, but at the same time we will have to balance the cost to hold to La Navidad and El Picacho concessions in the face of Millrock’s currently limited cash position.” 

Corporate Developments:
PolarX Shares and Cash Position

Millrock recently sold 10 million PolarX shares for A$475,000. While Millrock continues to be a strong believer in the Alaska Range Project, given Millrock’s relatively weak cash position it made sense to sell the shares. Millrock continues to be entitled to a production royalty, an advanced minimum royalty, and certain milestone payments.
Gregory Beischer, Millrock President and CEO stated, “Equity markets continue to be very tight. Millrock has to be extremely careful with its remaining funds. Management is cutting costs in all ways possible while the technical team works diligently to secure new funding partners. It is management’s view that securing new partnerships will be the best way for the Company to reduce overhead costs. The Company has an excellent portfolio of gold and copper projects but there is a cost to hold un-partnered projects until new partners are secured. Given the continued weakness of Millrock’s cash position (approximately C$790,000, as of today’s date, net of near-term accounts receivable and payable), the Company is considering all possible alternatives to move forward, including divestiture of Mexico projects and other assets.”
Quality Control – Quality Assurance
Millrock adheres to stringent Quality Assurance – Quality Control (“QA/QC”) standards. For the La Navidad drill program drill core samples were kept in a secure location at all times. Rock samples were assayed at the Bureau Veritas laboratory in Hermosillo, Mexico. Preparation and analysis methods are described in further detail here. The sample preparation method code being utilized for the current rock sampling program was PRP70-250. Analysis methods used include FA430 (30 gr/Fire Assay/ICP) and AQ-200 (Aqua Regia – ICP/MS). For every 20 rock samples a blank sample known to contain less than 3 parts per billion gold or a standard sample (Certified Reference Materials) of known gold concentration, or a duplicate sample was also analyzed. The qualified person is of the opinion that the results received from the laboratory for the samples in collected in this drill program are reliable.
Qualified Person
The scientific and technical information disclosed within this document has been prepared, reviewed and approved by Gregory A. Beischer, President, CEO and a director of Millrock Resources. Mr. Beischer is a qualified person as defined in NI 43-101.
About Millrock Resources Inc.
Millrock Resources Inc. is a premier project generator to the mining industry. Millrock identifies, packages and operates large-scale projects for joint venture, thereby exposing its shareholders to the benefits of mineral discovery without the usual financial risk taken on by most exploration companies. The company is active in Alaska, the southwest USA and Sonora State, Mexico. Funding for drilling at Millrock’s exploration projects is primarily provided by its joint venture partners. Business partners of Millrock have included some of the leading names in the mining industry: Centerra Gold, First Quantum, Teck, Kinross, Vale, Inmet, Altius, and Riverside. Millrock is a major shareholder of junior explorer Sojourn Exploration Inc.
ON BEHALF OF THE BOARD
“Gregory Beischer”
Gregory Beischer, President & CEO
FOR FURTHER INFORMATION, PLEASE CONTACT:
Melanee Henderson, Investor Relations
(604) 638-3164
(877) 217-8978 (toll-free)
Some statements in this news release contain forward-looking information (within the meaning of Canadian securities legislation) including, without limitation, the statement thatis management’s view that securing new partnerships will be the best way for the Company to reduce overhead costs. These statements address future events and conditions and, as such, involve known and unknown risks, uncertainties and other factors which may cause the actual results, performance or achievements to be materially different from any future results, performance or achievements expressed or implied by the statements. Such factors include, without limitation, the ability of Millrock to negotiate agreements with third parties to fund exploration programs on terms beneficial to the Company.

Copyright © 2019 Millrock Resources, All rights reserved.
You are receiving this email because you opted in to our mailing list.
Our mailing address is:

Millrock Resources

Suite 2300 – 1177 West Hastings St.

VancouverBc V6E2K3

Canada

Add us to your address book

Categories
Junior Mining Precious Metals

METALLIC MINERALS Reports High-Grade Silver, Lead, Zinc, and Copper Results from 2018 Exploration Program at the McKay Hill Project in Yukon Territory

January 28, 2018, Vancouver, B.C., Metallic Minerals Corp. (TSX-V: MMG; US OTC: MMNGF) (“Metallic” or the “Company”) announces additional high-grade results from the 2018 exploration programs conducted at its 100% owned McKay Hill Project, located 50 kilometers north of the historic Keno Hill Silver District in the Yukon Territory, and adjacent to ATAC’s Rackla property. Although earlier stage than the Company’s Keno Silver Project to the south, Metallic see’s similar potential for a district scale high-grade silver-lead-zinc-copper system at McKay Hill based on results to date including:
  • Total of 37 vein structures identified on the property to date, with the discovery of 18 new silver-lead-zinc-rich structures in 2018, with 61 samples ranging 1,000 to 4,326 g/t silver equivalent;
  • The outline of six kilometer-scale areas of highly elevated silver, lead, zinc, copper and gold in soils and rock sampling; and
  • Advancement of the Central Zone targets to drill-ready stage along with demonstration of the potential to host bulk-tonnage mineralization.
The McKay Hill Project occurs within a belt of silver-lead-zinc related deposits that stretches from the Alaska border to the southern part of the Yukon and includes the famous Keno Hill Silver District. McKay Hill was discovered in the 1920s and had production in the 1940s of high-grade material from the No. 6 Vein Corridor grading 390.8 g/t Ag and 74.1% Pb.1 With at least 37 vein structures (including the 18 new structures discovered in 2018) which have only seen limited exploration, the area shows potential to host a significant district-scale vein system similar to Keno Hill.
Metallic CEO and Chairman, Greg Johnson, stated, “We are very pleased to report these additional rock and trenching results from our 2018 exploration program at the McKay Hill Project, which significantly advanced the project with 18 newly defined vein structures, including some spectacular bonanza grades. To date, a total of 61 rock samples have exceeded 1,000 g/t silver equivalent values with values up to 4,326 g/t silver equivalent in rock samples and up to 2,126 g/t silver equivalent over 2 meters in channel sampling.  Work in 2018 has identified 6 separate kilometric-scale target areas with high-grade silver values along with associated lead, zinc and copper mineralization covering an area approximately 3 kilometers by 1.5 kilometers wide in soil and rock sampling (See news release December 4th, 2018, Metallic Minerals Identifies Multiple Kilometer-long Anomalies at McKay Hill, Yukon Territory). These results have significantly expanded the areas of known mineralization but cover only a small portion of the 44 square kilometer property, supporting the potential for the discovery of additional mineralized targets in future programs. This year’s program successfully achieved the key objectives of expansion of the main Central Zone target through trench, rock and soil sampling and identifying and refining six additional kilometric-scale target zones, including the West McKay, Bella, Red, Falls and Snowdrift and Independence Zones (see Figure 1). A comprehensive exploration program is being planned for 2019 at McKay Hill in coordination with the Company’s Keno Silver Project exploration activities. We look forward to providing additional updates on Metallic’s portfolio of projects in coming weeks.”
Central Zone Target Area
The Central Zone was the focus of historic exploration, and production occurred from a small area of the No. 6 Vein within the Central Zone. Exploration work in 2018 has substantially expanded the number of the Central Zone vein exposures, and understanding thereof, resulting in the identification of high-quality targets for drill testing. Importantly, this year’s program has demonstrated that the historically productive No. 6 Vein is part of a much larger system of vein structures than had been previously recognized, now termed the No. 6 Vein Corridor.  At least 20 major north-northeast-trending vein structures have been identified in the Central Zone along with northeast-trending stockwork zones in what is now interpreted to be a >1 kilometer-long by 250-metre-wide mineralized corridor that remains open to expansion at both ends (see Figure 1 inset).
The northeast-trending No. 6 Vein Corridor consists of widespread, near-vertical, high-grade silver-bearing massive sulfide veins. Very high combined silver and gold grades occur where these veins intersect with the numerous NNE trending gold and copper enriched veins. To date, 35 samples in the Central Zone have exceeded 1,000 g/t silver equivalent (“Ag Eq”) values, demonstrating the potential for high-grade mineralization in these vein systems (see Table 2 values from 2018 sampling). In addition, as part of the exploration program in 2018, a portable excavator was used to trench across key vein intersections to allow for detailed mapping of the structures, including their orientations and true thickness, and to better understand their relationships with the underlying geology (see Figure 2).  Sample results from the trenches that indicate these features, returned composite mineralized widths of up to 16 m of 321 g/t Ag Eq and 7.3 m at 542 g/t Ag Eq with both trenches internal to the mineralized boundary, suggesting the potential for significantly broader packages of bulk tonnage mineralization. The small size of the equipment and topographic limitations did not allow for longer trenches to test across the entire 250 m wide mineralized zone in 2018, but such sampling will be a priority in future programs.
Bella and other Surrounding Target Areas
In addition to the work on the Central Zone, exploration on the surrounding areas included the West McKay, Bella, Falls, Red, Independence, Snowdrift, Nash and White Hill targets. Work in these target areas focused on systematic soil grid sampling, along with rock sampling within the identified zones of interest. Results of the 2018 field program have revealed more than a dozen newly discovered vein structures in new areas for follow with seven rock samples returning greater than 500 g/t Ag equivalent values.
Analytical metal values from the 2018 assays provide encouraging results and select assays from all surface related sampling activities at the McKay Hill Project are presented in Table 2. Select sample results from these veins, highlighted in grey, show elevated silver, gold, copper, lead and zinc numbers. These veins returned promising results for initial sampling efforts on new discoveries.
Figure 1: Mineralized Zones, Rock Chip Samples and Soil Sample Locations from the 2018 Field Program

Table 1: Central Zone Target Area Highlight Rock Sample Assays from 2018 Field Program.
Most significant values are shown in red

Silver Equivalent values assume Ag $16/oz, Pb $1.10/lb, Zn $1.25/lb, Au $1,250/oz, Cu $3.00/lb and 100% recovery
Table 2: 2018 Surface Sample Results from McKay Hill Project on Surrounding Target Areas.
Results of new vein discoveries are shaded in gray. Most significant values are shown in red

Silver Equivalent values assume Ag $16/oz, Pb $1.10/lb, Zn $1.25/lb, Au $1,250/oz, Cu $3.00/lb and 100% recovery
Figure 2: Trench Assay Locations and Results from the Central Zone Target Area

Table 3: Sample Results from 2018 Reconnaissance Survey of Outlying Target Areas. Most significant values are shown in red.

Silver Equivalent (Ag Eq g/t) values assume Ag $16/oz, Pb $1.10/lb, Zn $1.25/lb, Au $1,250/oz, Cu $3.00/lb and 100% recovery.
Next Steps
While compilation and analysis of the new results is ongoing, the Company envisions the following next steps for the McKay Hill Project:
  1. Continued reconnaissance and prospecting of the broader project area including the 42 new claims staked in 2018;
  2. Continued mapping, soil sampling and trenching activities to extend the six identified target areas as well as to expand covered with new soil grids over additional targets and extensions of current open anomalies; and
  3. Refinement of targets on the Central Zone mineralization for initial drill testing focused on the No. 6 Vein Corridor to assess the composite grades over the length and width of the kilometric scale corridor.
Upcoming News and Events, Including Sample Display at AMEBC Roundup
Metallic will be participating in the 2019 AMEBC Mineral Roundup Event in Vancouver. Investors are invited to view samples from the Keno Silver and McKay Hill projects at booth #1009 in the Exhibit Hall for the duration of the show, and will be at the PDAC convention in March in Toronto, among other upcoming shows.
The Company looks forward to releasing additional results from the Keno Silver Project in coming weeks.
About the McKay Hill Project
The 100% owned McKay Hill Project covers 44 km2 within a belt of silver-lead-zinc related deposits that stretch from the Alaska border to the southern part of the Yukon and includes the famous Keno Hill Silver District, approximately 50 kilometers to the south. McKay Hill is a historic high-grade producer that shows potential to host a significant district scale vein system like Keno Hill, with at least 37 identified mineralized vein structures that have seen very limited modern exploration. Recent field work conducted by Metallic Minerals has confirmed high grades of silver, lead and zinc as well as significant associated gold and copper values. Targets include both high-grade structurally controlled mineralization as well as potential bulk tonnage mineralization.
All 2018 rock and soil samples collected on the property were processed at Bureau Veritas Mineral Laboratories in Vancouver British Columbia.
1 – Geological and Geochemical Evaluation Report on the McKay Hill Project, Jean Pautler, P.Geo. JP Exploration Services Inc., 2009
About Metallic Minerals Corp.
Metallic Minerals Corp. is a growth-stage exploration company focused on the acquisition and development of high-grade silver and gold in the Yukon within under-explored districts with potential to produce top-tier assets. Our objective is to create value through a disciplined, systematic approach to exploration, reducing investment risk and maximizing probability of long-term success. Our core Keno Silver Project is located in the historic Keno Hill Silver District of Canada’s Yukon Territory, a region which has produced over 200 million ounces of silver and currently hosts one of the world’s highest-grade silver resources. The Company’s McKay Hill Project, northeast of Keno Hill, is a high-grade historic silver-gold producer. Metallic Minerals is also building a portfolio of gold royalties in the Klondike Gold District. Metallic Minerals is led by a team with a track record of discovery and exploration success, including large scale development, permitting and project financing.
About the Metallic Group of Companies
The Metallic Group is a collaboration of leading precious and base metals exploration companies, with a portfolio of large, brownfields assets in established mining districts adjacent to some of the industry’s highest-grade silver, platinum and palladium, and copper producers. Member companies include Metallic Minerals (TSX-V: MMG) in the Yukon’s Keno Hill Silver District, Group Ten Metals (TSX-V: PGE) in the Stillwater PGM-Ni-Cu district of Montana, and Granite Creek Copper (TSX-V: GCX.H) in the Yukon’s Carmacks copper district. Highly experienced management and technical teams at the Metallic Group have expertise across the spectrum of resource exploration and project development from initial discoveries to advanced development, including strong project finance and capital markets experience and have demonstrated a commitment to community engagement and environmental best practices. The founders and team members of the Metallic Group include highly successful explorationists formerly with some of the industry’s leading explorer/developers and major producers and are undertaking a systematic approach to exploration using new models and technologies to facilitate discoveries in these proven historic mining districts.
FOR FURTHER INFORMATION, PLEASE CONTACT:
Website:  www.metallic-minerals.com
Email: chris.ackerman@metallic-minerals.com
Phone: 604-629-7800
Toll Free: 1-888-570-4420
Quality Assurance / Quality Control
Analytical work in 2017 was done by Bureau Veritas Commodities Canada Ltd. with sample preparation in Whitehorse, Yukon and geochemical analysis in Vancouver, British Columbia. Each rock (grab) sample was analyzed for 36 elements using an Aqua Regia digestion with inductively coupled plasma-atomic emission spectroscopy (ICP-AES) and inductively coupled Plasma-mass spectrometry (ICP-MS) (AQ202). Samples with over limit silver and gold were re-analyzed using a 30-gram fire assay fusion with a gravimetric finish (FA530-Ag, Au). Over-limit lead and zinc samples were analyzed by multi-acid digestion and atomic absorption spectrometry (MA404) or titration (GC516, GC8917). All results have passed the QAQC screening by the lab.
Qualified Person
Scott Petsel, P.Geo, Vice President, Exploration and an employee of Metallic Minerals Corp., is a Qualified Person as defined by National Instrument 43-101. Mr. Petsel has reviewed the scientific and technical information in this news release and approves the disclosure contained herein. Mr. Petsel has reviewed the results of the sampling program and confirmed that all procedures, protocols and methodologies used in the drill program conform to industry standards.
Forward-Looking Statements
Forward Looking Statements: This news release includes certain statements that may be deemed “forward-looking statements”. All statements in this release, other than statements of historical facts including, without limitation, statements regarding potential mineralization, historic production, estimation of mineral resources, the realization of mineral resource estimates, interpretation of prior exploration and potential exploration results, the timing and success of exploration activities generally, the timing and results of future resource estimates, permitting time lines, metal prices and currency exchange rates, availability of capital, government regulation of exploration operations, environmental risks, reclamation, title, and future plans and objectives of the company are forward-looking statements that involve various risks and uncertainties. Although Metallic Minerals believes the expectations expressed in such forward-looking statements are based on reasonable assumptions, such statements are not guarantees of future performance and actual results or developments may differ materially from those in the forward-looking statements. Forward-looking statements are based on a number of material factors and assumptions. Factors that could cause actual results to differ materially from those in forward-looking statements include failure to obtain necessary approvals, unsuccessful exploration results, changes in project parameters as plans continue to be refined, results of future resource estimates, future metal prices, availability of capital and financing on acceptable terms, general economic, market or business conditions, risks associated with regulatory changes, defects in title, availability of personnel, materials and equipment on a timely basis, accidents or equipment breakdowns, uninsured risks, delays in receiving government approvals, unanticipated environmental impacts on operations and costs to remedy same, and other exploration or other risks detailed herein and from time to time in the filings made by the companies with securities regulators. Readers are cautioned that mineral resources that are not mineral reserves do not have demonstrated economic viability. Mineral exploration and development of mines is an inherently risky business. Accordingly, the actual events may differ materially from those projected in the forward-looking statements. For more information on Metallic Minerals and the risks and challenges of their businesses, investors should review their annual filings that are available at www.sedar.com.
Neither the TSX Venture Exchange nor its Regulation Services Provider (as that term is defined in the policies of the TSX Venture Exchange) accepts responsibility for the adequacy or accuracy of this release.
Copyright © 2019 Metallic Minerals Corp, All rights reserved.
You are receiving this as a subscriber.
Our mailing address is:

Metallic Minerals Corp

904-409 Granville St

VancouverBC v6b1t7

Canada
Categories
Base Metals Junior Mining Precious Metals Project Generators

EMX ROYALTY Congratulates Boreal on New High Grade Zinc-Silver-Lead-Gold Drill Results at the Gumsberg Royalty Property in Sweden

Vancouver, British Columbia–(Newsfile Corp. – January 28, 2019) – EMX Royalty Corporation (TSXV: EMX) (NYSE American: EMX) (the “Company” or “EMX”) is pleased to announce Boreal Metals Corp.’s (“Boreal”) recent diamond drill results and the discovery of a high grade zone of zinc-silver-lead-gold mineralization at EMX’s Gumsberg royalty property. EMX is a royalty holder on the Gumsberg project, and currently owns a 9.4% equity interest in Boreal. Gumsberg is located in the Bergslagen mining district of southern Sweden. The drill results include 11.00 meters averaging 5.90% zinc, 239.0 g/t silver, 2.51% lead, and 0.96 g/t gold in hole GUM-18-003, and 11.01 meters averaging 7.45% zinc, 275.1 g/t silver, 2.65% lead, and 0.77 g/t gold in hole GUM-18-004 (true widths estimated at 50% of reported interval lengths). EMX congratulates Boreal on its new high grade discovery, termed the South Zone, and looks forward to further advancement of the Company’s Gumsberg royalty interests.

Boreal reported results from the first four holes of its recently completed nine hole, 1,620.8 meter winter drill program, including GUM-18-003 and GUM-18-004, which intersected South Zone massive sulfide mineralization east and west of previously reported hole BM-17-005 (10.94 meters averaging 16.97% zinc, 656.7 g/t silver, 8.52% lead, and 0.76 g/t gold; true width estimated at 20-50% of reported interval length). The South Zone occurs near the historic Östra Silvberg mine, and is currently delineated as 130 meters of eastward plunging mineralization that remains open for expansion to the east and at depth. Holes GUM-18-001 and GUM-18-002, drilled west of the South Zone, did not return significant intercepts. GUM-18-001 terminated when it drilled into an unmapped mine working, and GUM-18-002 deviated from plan and failed to intersect the target horizon.

Boreal reported that additional assays pending from the remaining holes of the winter campaign are expected in the coming weeks. Please see Boreal’s news release dated January 28, 2019 for further details, and Appendix 1 of this news release for a table of drill results reported by Boreal.

EMX has a significant equity interest in Boreal, as well as its subsidiary company Boreal Energy Metals Corp. (“BEMC”), that resulted from the sale of Gumsberg and other royalty generation properties in Sweden and Norway[1]. EMX retains uncapped 3% net smelter return (NSR) royalty interests on each of the properties sold to Boreal and BEMC[2], including the Gumsberg project, and will receive annual advance royalty (AAR) payments and other considerations from the sale of the projects.

The Boreal agreements are an excellent example of EMX’s execution of the royalty generation aspect of the Company’s business model. EMX leveraged in-country geologic and business development expertise to acquire prospective properties on open ground, built value through low cost work programs and targeting, and partnered the projects for retained royalty interests, equity interests, and AAR payments. This business strategy has provided EMX with substantial share equity in Boreal and BEMC, exposure to exploration and discovery upside at no additional cost, and the potential for future royalty payments upon the commencement of production.

EMX continues to build its portfolio of precious metal, base metal, and cobalt properties in Scandinavia. Many new properties are available for partnership. Please see www.EMXroyalty.com for more information.

Dr. Eric P. Jensen, CPG, a Qualified Person as defined by National Instrument 43-101 and employee of the Company, has reviewed, verified and approved the disclosure of the technical information contained in this news release.

About EMX. EMX leverages asset ownership and exploration insight into partnerships that advance our mineral properties, with EMX receiving pre-production payments and retaining royalty interests. EMX complements its royalty generation initiatives with royalty acquisitions and strategic investments.

-30-

For further information contact:

David M. Cole
President and Chief Executive Officer
Phone: (303) 979-6666
Email: Dave@EMXroyalty.com

Scott Close
Director of Investor Relations
Phone: (303) 973-8585
Email: SClose@EMXroyalty.com

Neither the TSX Venture Exchange nor its Regulation Services Provider (as that term is defined in policies of the TSX Venture Exchange) accepts responsibility for the adequacy or accuracy of this release.

Forward-Looking Statements

This news release may contain “forward looking statements” that reflect the Company’s current expectations and projections about its future results. These forward-looking statements may include statements regarding perceived merits of properties, exploration results and budgets, mineral reserves and resource estimates, work programs, capital expenditures, timelines, strategic plans, market prices for precious and base metal, or other statements that are not statements of fact. When used in this news release, words such as “estimate,” “intend,” “expect,” “anticipate,” “will”, “believe”, “potential” and similar expressions are intended to identify forward-looking statements, which, by their very nature, are not guarantees of the Company’s future operational or financial performance, and are subject to risks and uncertainties and other factors that could cause the Company’s actual results, performance, prospects or opportunities to differ materially from those expressed in, or implied by, these forward-looking statements. These risks, uncertainties and factors may include, but are not limited to: unavailability of financing, failure to identify commercially viable mineral reserves, fluctuations in the market valuation for commodities, difficulties in obtaining required approvals for the development of a mineral project, increased regulatory compliance costs, expectations of project funding by joint venture partners and other factors.

Readers are cautioned not to place undue reliance on these forward-looking statements, which speak only as of the date of this news release or as of the date otherwise specifically indicated herein. Due to risks and uncertainties, including the risks and uncertainties identified in this news release, and other risk factors and forward-looking statements listed in the Company’s MD&A for the nine month period that ended on September 30, 2018 (the “MD&A”), and the most recently filed Form 20-F for the year that ended on December 31, 2017, actual events may differ materially from current expectations. More information about the Company, including the MD&A, the 20-F and financial statements of the Company, is available on SEDAR at www.sedar.com and on the SEC’s EDGAR website at www.sec.gov.

Appendix 1

Drill results reported in Boreal’s January 28, 2019 news release.

Hole
ID
From 
Meters
To 
Meters
Length
Meters
Zn
%
Ag
g/t
Pb
%
Au
g/t
GUM-18-001 No significant intercepts; intersected previously unidentified mine stope.
GUM-18-002 No significant intercepts; geological interpretations suggest hole failed to reach the targeted horizon.
GUM-18-003 105.00 116.00 11.00 5.90 239.00 2.51 0.96
Including 105.00 108.00 3.00 5.71 386.00 2.30 2.33
and 109.65 111.10 1.45 23.78 666.48 9.37 1.72
and 113.00 114.00 1.00 4.73 222.00 2.83 0.70
and 114.80 116.00 1.20 6.96 227.00 3.49 0.31
GUM-18-004 162.16 173.17 11.01 7.45 275.12 2.65 0.77
Including 162.16 164.18 2.02 11.09 313.00 3.61 0.76
and 165.28 166.18 0.90 8.93 403.00 3.62 1.17
and 165.28 168.50 3.22 8.57 343.39 3.68 1.52
and 169.45 172.25 2.80 11.05 429.14 3.25 0.70

True widths are estimated to be 50% of reported interval lengths.

Statement of Quality Control, Quality Assurance and Core Handling Protocols reported in Boreal’s January 28, 2019 news release.

Drill core is logged and prepped for sampling before submittal to ALS in Malå, Sweden where it is cut, bagged and prepped for analysis. Accredited control samples (blanks and accredited standards) are inserted into the sample intervals regularly. Samples are dried (if necessary), weighed, crushed (70% < 2mm), and riffle split into two fractions. One is retained (coarse reject) and the other is pulverized to 85% < 75µm. Pulps are analyzed by ultra-trace ICP-MS (ME-MS41) and ICP-AES Au-Pt-Pd (PGM-ICP23). Over detection limit samples are reanalyzed using ore grade ICP-AES by aqua regia (ME-OG46) or by AAS in the case of high grade zinc (Zn-AAORE).

[1] See EMX news releases dated November 22, 2016, January 16, 2018, February 9, 2018 and April 11, 2018.
[2]
 Boreal and BEMC retain a right to purchase 1% of the NSR royalty on individual projects by paying EMX CDN $2,500,000 in cash and shares within five years of the closing date.

To view the source version of this press release, please visit https://www.newsfilecorp.com/release/42487

Categories
Precious Metals

VANAURUM Major Opportunity Developing in Platinum

Major Opportunity Developing in Platinum

By Kevin Vecmanis
Once in a while an opportunity comes along in the markets where the dislocations are so extreme and compelling that it commands one to take a calculated risk. Anytime you can say, “This is among the cheapest this asset has been in history”, there is typically a fantastic contrarian play at hand.
In February of 2016 the price of WTI Crude Oil hit ~ $25/barrel. On an inflation adjusted basis, this was among the cheapest oil had been in recorded history. I was working in the Oil Industry at the time doing engineering management, and during a lunch with the President of our company I told him I was going to buy a lot of energy equities on that fact alone. Considering the sentiment at the time (atrocious), he was skeptical. Six weeks later I had doubled my money.
Click here now. The same situation is developing in the Platinum market. This plot shows the $USD close of Platinum, with the Platinum/Copper and Platinum/Gold ratio. Platinum is at $805 as of this writing, and on an inflation-adjusted basis is among the cheapest Platinum has been in history. Priced in Gold, this the cheapest platinum has ever been. Priced in Copper, Platinum hasn’t been this cheap since 1977. The same is true of the Platinum/Silver ratio which is languising near lows last seen in 2012, and then the 1980’s before that. The Platinum/Palladium ratio is as extreme as the Platinum/Gold ratio, which is almost tied for all-time lows for the entire price history dating back to the 70’s. Priced in units of the S&P 500 it’s also languishing at the cheapest in history.
So what’s happening here? Some make the (valid) argument that shifting auto demand from combustion vehicles to electric vehicles is forcing the market to reprice the value of Platinum relative to other assets. This is fine, and I tend to agree with this assessment. However, the adaptive and non-stationary aspect of markets needs to be respected. Platinum has inalienable properties that make it a fantastic input to a lot of products and processes. The simple fact that Platinum (and Gold) are immune to oxydative damage means that if they were cheap enough we would use them in everything where a certain degree of robustness and longevity is required. In other words, at some point new use cases for Platinum will emerge that are economically viable at these price levels. This will drive a mean-reversion relative to other assets over the long-term.
Technically, Platinum is sitting right at major support that held during the 2008 crash and the 2015 low. It remains to be seen if a double-bottom will form here, or if the market will break support and jolt lower. The essence of speculation is buying what nobody wants, and selling what everybody wants. I think investors or speculators with the luxury of time would do well to accumulate platinum-based assets at this juncture.
As a matter of disclosure, we currently do not own any positions in Platinum or Platinum miners directly. We do plan to take long-positions in PPLT within the next 1-3 months.

About VanAurum

VanAurum is an intelligent lead generator for trading and investing opportunities. It analyzes over 140 asset classes everyday that cover a global cross-section of the market. When something happens that historically has been positive or negative for returns, it reports on it to members. It’s an AI-based market historian. VanAurum alerted me to the situation in Platinum through action it was seeing in the Platinum/Gold ratio.
Staying in tune with notable price action for the world’s largest asset classes is time-consuming, and perfectly suited for a machine-learning systems to handle. That’s why I built VanAurum – to sift through the market noise and increase the quantity and quality of trading leads for members. If you use technical analysis to trade the markets, VanAurum is a must-have membership because it can quantify exactly what technical events have meant for asset returns in the past.
Due to the popularity of our AI platform, we will be increasing membership prices for new members in February. 321Gold readers can sign-up and lock in current prices by following the steps below. All memberships come with a 14-day, no obligation free-trial.
To sign up:

  • Click on the button below.
  • Enter a valid credit card to get past our authentication wall (Your card won’t be charged until the 14-day trial has ended).
  • Once through, Complete the sign-up form and you’re good to go.
  • If you have any questions at all, please e-mail me directly at kevin@vanaurum.ai

Become a member

Happy and prosperous investing!
Kevin
Founder, VanAurum


Categories
Precious Metals

CHRIS MARCUS When People Lose Confidence in Government, They Always Buy Gold And Silver

Jim Rogers – “When People Lose Confidence in Government, They Always Buy Gold And Silver”
Written by Chris Marcus of Miles Franklin
When trying to do something successfully for the first time, one of the strategies I find most helpful is to consider the opinion of someone who has done it before. And certainly with investing, listening to traders who have a track record of success can be incredibly insightful.
Along those lines, something that I’ve found striking as I’ve been fortunate to interview many of the world’s most successful investors, is that they all seem to share the same sentiments regarding gold and silver.
Jim Rogers - When People Lose Confidence in Government, They Always Buy Gold And Silver
Certainly Jim Rogers fits into the category of the more successful traders of the past 50 years. And if I were to summarize our interview down to one thing Jim said, it would be how he mentioned that “when people lose confidence in government, they always buy gold and silver.”
So while many in the mainstream who have been watching too much CNBC often react to gold and silver investors as if they’ve just arrived from another planet, I find it interesting how I have yet to find a single investor who saw the subprime bubble coming in advance, that doesn’t now advocate owning silver (perhaps with Warren Buffett being one exception – although he was a large silver holder at one point).
Sure. You can find plenty of bankers on Wall Street who see absolutely no appeal in gold or silver. Yet how many of them can explain how the United States treasury is going to undo $22 trillion worth of debt? Or $200-plus trillion of unfunded liabilities in Social Security and Medicare? Or how the Fed is going to ever normalize interest rates without crashing the system.
Personally I’ll take Jim’s opinion over any of the folks I once worked with on Wall Street. Or you could take the opinion of Rick RuleDoug Casey, or Peter Schiff. Or even better, you don’t have to take anyone’s opinion for it. But rather just look at the debt loads and quantitative easing balances, while factoring in that the Federal Reserve is already abandoning any further significant sequence of interest rate hikes.
It’s also interesting how you rarely even hear anyone argue that gold and silver are going to go lower from current levels. And why would they? With both metals trading close to or below what it actually cost many of the miners to dig it out of the ground, while further short term paper manipulation is always possible, how much lower are the metals really likely to trade?
In the end, the simple answer is that Jim Rogers is likely quite correct. That when people lose confidence in governments and money, which is happening as we speak, they always buy gold and silver.
That’s incredibly likely to happen this time around again. And if you have any questions, you’re welcome to email me here, or call Miles Franklin at one 800-822-8080 if you would like to purchase physical precious metals.
-If you have any questions about this article, what’s happening with the Fed, or the precious metals market, you’re welcome to email me here.
-To buy or sell gold and silver call Miles Franklin today at (1-800-822-8080).
-Or get Miles Franklin’s detailed report on why the price of silver is set to explode.
Miles Franklin Refinery Services For “We Buy Gold” Shops
To buy or sell gold, silver, platinum, or palladium call Miles Franklin today at 1-800-822-8080
Miles Franklin Refinery Services For “We Buy Gold” Shops
Are you a “We Buy Gold” or coin shop that purchases physical precious metals and sends them to a refiner?
Then find out how you can get a better bid than you’re currently receiving. As well as how the process can be simple, trustworthy, and with good communication along every step of the way.
To find out more, click to watch the video or call 1-833-326-GOLD now!
Get Miles Franklin’s detailed report on why the price of silver is set to explode:
Miles Franklin Refinery Services For We Buy Gold Shops
Archived Newsletters
Market Report 1/24/2019
About Miles Franklin
Miles Franklin was founded in January, 1990 by David MILES Schectman. David’s son, Andy Schectman, our CEO, joined Miles Franklin in 1991. Miles Franklin’s primary focus from 1990 through 1998 was the Swiss Annuity and we were one of the two top firms in the industry. In November, 2000, we decided to de-emphasize our focus on off-shore investing and moved primarily into gold and silver, which we felt were about to enter into a long-term bull market cycle. Our timing and our new direction proved to be the right thing to do.
We are rated A+ by the BBB with zero complaints on our record. We are recommended by many prominent newsletter writers including Doug Casey, Jim Sinclair, David Morgan, Future Money Trends and the SGT Report.
For your protection, we are licensed, regulated, bonded and background checked per Minnesota State law.
Miles Franklin
801 Twelve Oaks Center Drive
Suite 834
Wayzata, MN 55391
1-800-822-8080
Copyright © 2019. All Rights Reserved.
Categories
Precious Metals

Bank of England blocks Maduro’s $1.2B gold withdrawal – report

Original Source: https://www-m.cnn.com/2019/01/26/uk/venezuela-maduro-bank-of-england-gold-withdrawal-gbr-intl/index.html?r=https%3A%2F%2Fwww.cnn.com%2F

Bank of England blocks Maduro’s $1.2B gold withdrawal – report

By Rob Picheta, CNN

Updated at 12:32 PM ET, Sat January 26, 2019

London (CNN) — The Bank of England has blocked Nicolas Maduro’s officials from withdrawing $1.2 billion worth of gold, Bloomberg reported, dealing a further blow to the embattled Venezuelan President as he tries to salvage his authority.
According to the report, which cites unnamed people familiar with the matter, the gold is a significant part of the $8 billion in foreign reserves held by the Venezuelan central bank.
CNN has not been able to independently verify the report and is attempting to get a response from Maduro’s officials.
The move by the Bank of England came after top U.S. officials urged the British government to help cut off Maduro’s access to his country’s assets, the report said, and instead steer them towards opposition leader Juan Guaido, who has claimed the presidency.
On Saturday, the UK joined the US and a host of other countries by saying it would recognize Guaidó as the country’s interim President if new elections were not called within the next eight days.
Categories
Base Metals Energy Junior Mining Precious Metals

GROUP TEN METALS Reports High-Grade Palladium, Platinum and Gold from the Wild West and Boulder Target Areas at the Stillwater West Project, Montana, USA

VANCOUVER, British Columbia, Jan. 25, 2019 (GLOBE NEWSWIRE) — Group Ten Metals Inc. (TSX.V: PGE; US OTC: PGEZF; FSE: 5D32) (the “Company” or “Group Ten”) announces results from the Wild West and Boulder target areas covering the far-western end of the Stillwater West Project in Montana, USA. This is the first in a series of planned news releases to report results of 2018 exploration programs and on-going compilation and modeling work at the Company’s flagship PGE-Ni-Cu project adjacent to Sibanye-Stillwater’s high-grade PGE mines in the Stillwater Igneous Complex. With more than 41 million ounces of past production and current M&I resources, plus another 49 million ounces of inferred resources at over 16 g/t palladium and platinum, the Stillwater Complex is recognized as one of the top regions in the world for PGE-Ni-Cu mineralization1,2.

Michael Rowley, President and CEO, commented, “We are pleased to report the results of our compilation and modelling efforts at Stillwater West alongside results of the 2018 exploration. This first release focuses on the Boulder and Wild West target areas, which cover the western-most 8 km of the 25 km long Stillwater West project, where work in 2018 confirmed the presence of significant PGE+gold along with nickel, copper and cobalt sulphide mineralization. Mineralization at these two target areas corresponds with two nearly untested electromagnetic geophysical conductors that are approximately 4 and 3.8 km in length, respectively. Surface sampling from these targets show values up to 10.3 grams-per-tonne (g/t) palladium, 3.8 g/t platinum and 21.8 g/t gold in rock samples, with 20 samples returning from 2 to 30 g/t platinum equivalent grade mineralization, including significant nickel, copper, and cobalt values.”

“Mineralization styles seen at these two target areas include high-grade PGE “Reef-type” and structurally controlled PGE+gold, along with bulk-tonnage “Platreef-style” PGE-Ni-Cu mineralization geologically similar to the Northern Bushveld, which hosts Anglo American’s world-leading Mogalakwena mines, as well as Ivanhoe’s Platreef project. These very encouraging sample results, along with the untested kilometer-scale electromagnetic conductor anomalies, highlight the potential for major new PGE-Ni-Cu discoveries at Stillwater West, within the prolific Stillwater Complex.”

Wild West Target Area

As shown in Figure 1, the Wild West target area is one of eight major target areas defined by the Company across the lower portion of the Stillwater Complex based on multi-kilometer-scale electromagnetic geophysical (conductive high) anomalies that are coincident with highly elevated metals in soils and surface rock sampling. The Wild West electromagnetic conductor target covers an area of approximately 3.8 km by 1.7 km in size with very encouraging but limited drilling completed on the southeastern edge of the conductor at the Pine Shear Zone.

Table 1 and Figure 2 present highlight intercepts from recent compilation work by the Company on 22 holes drilled at the Pine Shear Zone targeting high-grade gold+PGE mineralization along with nickel, copper and cobalt. Highlight results from drilling at the Pine Shear Zone include 31.02 g/t 3E (28.7 g/t Au, 1.06 g/t Pt, 1.27 g/t Pd) over 2.6 meters and 16.94 g/t 3E (16.19 g/t Au, 0.24 g/t Pt, 0.50 g/t Pd) over 7.98 meters in a gold+PGE-enriched, structurally-controlled shear zone hosted within the chromite-rich ultramafic stratigraphy. Mineralization remains open to expansion in all directions and is one of several priority targets for additional follow up exploration in the Wild West target area.

Rock sampling by Group Ten in 2018 at the Pine Shear Zone returned palladium grades of over 10 g/t while also confirming high-grade gold with the highest grab sample assaying 23.1 g/t 3E (21.8 g/t Au, 0.64 g/t Pt and 0.72 g/t Pd). Outside of the Pine Shear Zone in the broader Wild West target area, reconnaissance rock chip samples confirm the presence of significant PGE, nickel, copper and cobalt mineralization in the ultramafic series including up to 11.5 g/t 3E (10.5 g/t Pd, 1.2 g/t Pt and 0.23 g/t Au) with a total of 17 rock samples exceeding 2 g/t 3E see Figure 1 and Table 2).

TABLE 1 – Highlight mineralized drill intercepts from the Pine Shear Zone at the Wild West Target Area

    INTERVAL   PRECIOUS METALS BASE METALS TOTAL METAL
EQUIVALENTS
GRADE THICKNESS
HOLE ID From To Width Pt Pd Au 3E Ni Cu Co NiEq TotPtEq TotNiEq Grade x Width
  (m) (m) (m) (g/t) (g/t) (g/t) (g/t) (%) (%) (%) (%) (Pt g/t) (Ni %) (gram-meter)
PC2004-04 0.00 20.73 20.73 0.21 0.34 0.08 0.64 0.12 0.06 0.009 0.18 1.38 0.34 29
   
PC2004-07 19.20 46.63 27.43 0.25 0.76 0.09 1.10 n/a n/a n/a n/a 1.13 0.27 31
   
PC-2 11.09 22.46 11.37 0.17 0.35 11.77 12.30 n/a n/a n/a n/a 15.24 3.70 173
including 14.48 22.46 7.98 0.24 0.50 16.19 16.94 n/a n/a n/a n/a 20.99 5.10 167
   
PC-3 0.15 9.72 9.57 0.16 0.16 3.77 4.09 n/a n/a n/a n/a 5.04 1.22 48
including 5.70 9.72 4.02 0.38 0.39 7.27 8.04 n/a n/a n/a n/a 9.86 2.40 40
   
PC-5 3.05 6.28 3.23 0.89 1.04 23.49 25.43 n/a n/a n/a n/a 31.30 7.61 101
including 3.05 5.67 2.62 1.06 1.27 28.69 31.02 n/a n/a n/a n/a 38.19 9.28 100
   
PC-6 29.87 39.84 9.97 0.12 0.12 4.36 4.60 n/a n/a n/a n/a 5.69 1.38 57
   
PC-9 4.39 5.76 1.37 0.34 0.34 15.87 16.56 n/a n/a n/a n/a 20.53 4.99 28

 Intercepts with grade thickness values over 25 gram-meter TotPtEq are presented above. Total Platinum Equivalent (TotPtEq g/t) and Total Nickel Equivalent calculations reflect total gross metal content using metals prices as follows (all USD):  $6.00/lb nickel (Ni), $3.00/lb copper (Cu), $20.00/lb cobalt (Co), $1,000/oz platinum (Pt), $1,000/oz palladium (Pd) and $1,250/oz gold (Au). Values have not been adjusted to reflect metallurgical recoveries. Total metal equivalent values include both base and precious metals, where available. Results labelled ‘n/a’ were not assayed for that metal. Total platinum equivalent grade thickness was determined by multiplying the thickness (in meters) by the Total Platinum Equivalent grade (in grams/tonne) to provide gram-meter values (g-m) as shown.  PC2004 series holes were conducted in 2004 by Group Ten’s QP while working for Premium Exploration. PC series holes were drilled in 1983 and the results are considered historic and have not been independently verified by Group Ten.

TABLE 2 – Highlight 2018 rock sample results from the Wild West target area

    PRECIOUS METALS BASE METALS TOTAL METAL
EQUIVALENTS
SAMPLE ID LOCATION Pt Pd Au 3E Ni Cu Co NiEq TotPtEq TotNiEq
    (g/t) (g/t) (g/t) (g/t) (%) (%) (%) (%) (Pt g/t) (Ni %)
3190318 Wild West (PSZ) 0.64 0.72 21.80 23.16 0.260 0.071 0.018 0.36 30.07 7.31
97809 Wild West (PSZ) 0.37 0.59 11.70 12.66 n/a n/a n/a n/a 15.58 3.79
97805 Wild West (PSZ) 3.77 10.34 0.22 14.32 n/a n/a n/a n/a 14.38 3.49
3190486 Wild West (PSZ) 0.24 0.49 7.93 8.66 0.475 0.313 0.027 0.72 13.61 3.31
3190317 Wild West (PSZ) 0.37 0.31 7.31 7.99 0.551 0.034 0.028 0.66 12.53 3.05
3190498 Wild West 1.24 10.05 0.23 11.53 0.162 0.006 0.013 0.21 12.44 3.02
1409988 Wild West (PSZ) 1.82 6.01 0.20 8.03 0.157 0.029 0.040 0.30 9.33 2.27
3190408 Wild West (PSZ) 0.58 1.35 3.19 5.13 0.119 0.223 0.020 0.30 7.15 1.74
3190497 Wild West 2.11 3.55 0.01 5.67 0.100 0.017 0.017 0.17 6.35 1.54
3190508 Wild West 1.09 3.20 0.27 4.56 0.217 0.067 0.024 0.33 5.99 1.46
3190320 Wild West 1.03 2.95 0.44 4.41 0.138 0.011 0.018 0.20 5.36 1.30
3190509 Wild West 1.12 2.83 0.14 4.08 0.142 0.000 0.026 0.23 5.06 1.23
337315 Wild West 0.76 2.01 0.23 3.00 0.259 0.084 0.030 0.40 4.71 1.15
337389 Wild West (PSZ) 2.80 0.47 0.03 3.30 0.067 0.017 0.023 0.15 3.93 0.96
3190386 Wild West 0.44 1.61 0.19 2.24 0.183 0.245 0.022 0.38 3.84 0.93
1409992 Wild West 0.86 1.83 0.03 2.72 0.090 0.034 0.024 0.19 3.49 0.85
337307 Wild West 1.76 0.67 0.02 2.45 0.114 0.021 0.013 0.17 3.14 0.76
337309 Wild West 0.61 0.83 0.14 1.58 0.250 0.084 0.020 0.36 3.09 0.75
3190422 Wild West 0.32 0.58 0.10 0.99 0.217 0.172 0.024 0.38 2.59 0.63
3190507 Wild West 0.11 0.23 0.11 0.44 0.327 0.182 0.018 0.48 2.44 0.59

 Results over 2 g/t TotPtEq are presented above. Total Platinum Equivalent (TotPtEq g/t) and Total Nickel Equivalent were determined as per Table 1.

Boulder Target Area

The Boulder EM conductor target covers an area approximately 4 km long by 1 km wide with a highly conductive electromagnetic response over the Ultramafic and Basal Series of the Stillwater Complex. While the area is among the least explored at Stillwater West, Group Ten’s work in 2018, together with the available historic data, confirms the presence of significant levels of PGE, Ni, Cu, Co and Cr mineralization coincident with the conductive high anomaly, confirming the potential for large bodies of strongly disseminated sulphides.

Mineralization at the Boulder target area is further confirmed by historic drilling by Anaconda in the 1970s which targeted nickel and copper sulphides and chromites in the Basal and Ultramafic Series. Historic data from drill hole BR-2 at the Boulder Target Area reported three intervals grading between 0.42% to 1.5% combined nickel plus copper but were not assayed for PGE or gold values. Future work at the Boulder Target Area will include detailed mapping and soil and rock sampling to develop and refine drill targets.

Upcoming News and Events, Including Core Display at AMEBC Roundup

Group Ten will be participating in the 2019 AMEBC Mineral Roundup Event in Vancouver. Investors are invited to view core from Stillwater West at display #1018 in the Core Shack area during the AME Round Up tradeshow on January 28 and 29, 2019. Group Ten will also be at booth #1009 in the Exhibit Hall for the duration of the show, and will be at the PDAC convention in March in Toronto, among other upcoming shows.

The Company looks forward to releasing further results from the adjacent and more advanced Chrome Mountain and Iron Mountain target areas in the coming weeks.

About Stillwater West

The Stillwater West PGE-Ni-Cu project positions Group Ten as the second largest landholder in the Stillwater Complex, adjoining and adjacent to Sibanye-Stillwater’s world-leading Stillwater, East Boulder, and Blitz platinum group elements (PGE) mines in south central Montana, USA. With more than 41 million ounces of past production and current M&I resources, plus another 49 million ounces of Inferred resources1,2, the Stillwater Complex is recognized as one of the top regions in the world for PGE-Ni-Cu mineralization, alongside the Bushveld Complex and Great Dyke in southern Africa, which are similar layered intrusions. The J-M Reef, and other PGE-enriched sulphide horizons in the Stillwater Complex, share many similarities with the highly prolific Merensky and UG2 Reefs in the Bushveld Complex, while the lower part of the Stillwater Complex also shows the potential for much larger scale disseminated and high-sulphide PGE-nickel-copper type deposits, possibly similar to Platreef in the Bushveld Complex3. Group Ten’s Stillwater West property covers the lower part of the Stillwater Complex along with the Picket Pin PGE Reef-type deposit in the upper portion, and includes extensive historic data, including soil and rock geochemistry, geophysical surveys, geologic mapping, and historic drilling.

Note 1: Report on Montana Platinum Group Metal Mineral Assets of Sibanye-Stillwater, November 2017, Measured and Indicated Resources of 57.2 million tonnes grading 17.0 g/t Pt+Pd containing 31.3 million ounces and 92.5 million tonnes grading 16.6 g/t containing 49.4 million ounces.
Note 2: Public production records from Stillwater Mining Company from 1992 to present.
Note 3: Magmatic Ore Deposits in Layered Intrusions—Descriptive Model for Reef-Type PGE and Contact-Type Cu-Ni-PGE Deposits, Michael Zientek, USGS Open-File Report 2012–1010.

About Group Ten Metals Inc.

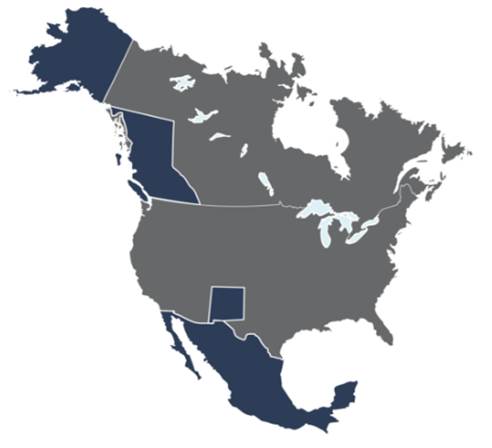
Group Ten Metals Inc. is a TSX-V-listed Canadian mineral exploration company focused on the development of high-quality platinum, palladium, nickel, copper, cobalt and gold exploration assets in top North American mining jurisdictions. The Company’s core asset is the Stillwater West PGE-Ni-Cu project adjacent to Sibanye-Stillwater’s high-grade PGE mines in Montana, USA.  Group Ten also holds the highly prospective Kluane PGE-Ni-Cu project on trend with Nickel Creek Platinum‘s Wellgreen deposit in Canada‘s Yukon Territory, and the high-grade Black Lake-Drayton Gold project in the Rainy River district of northwest Ontario.

About the Metallic Group of Companies

The Metallic Group is a collaboration of leading precious and base metals exploration companies, with a portfolio of large brownfields assets in established mining districts adjacent to some of the industry’s highest-grade producers of platinum & palladium, silver and copper. Member companies include Group Ten Metals (PGE.V) in the Stillwater PGM-Ni-Cu district of Montana, Metallic Minerals (MMG.V) in the Yukon’s Keno Hill silver district, and Granite Creek Copper (GCX-H.V) in the Yukon’s Carmacks copper district. Highly experienced management and technical teams at the Metallic Group have expertise across the spectrum of resource exploration and project development from initial discoveries to advanced development, including strong project finance and capital markets experience and have demonstrated a commitment to community engagement and environmental best practices. The founders and team members of the Metallic Group include highly successful explorationists formerly with some of the industry’s leading explorer/developers and major producers and are undertaking a systematic approach to exploration using new models and technologies to facilitate discoveries in these proven historic mining districts. The Metallic Group is headquartered in Vancouver, BC, Canada and its member companies are listed on the Toronto Venture, US OTC, and Frankfurt stock exchanges.

FOR FURTHER INFORMATION, PLEASE CONTACT:

Michael Rowley, President, CEO & Director
Email: info@grouptenmetals.com Phone: (604) 357 4790
Web: http://grouptenmetals.com Toll Free: (888) 432 0075

Quality Control and Quality Assurance

2018 rock chip samples were analyzed by Bureau Veritas Mineral Laboratories in Vancouver, B.C.  Samples were crushed and split, and a 250 g split pulverized with 85% passing 200 mesh.  Gold, platinum, and palladium were analyzed by fire assay (FA350) with ICP finish.  Selected major and trace elements were analyzed by peroxide fusion with ICP-EB finish to insure complete dissolution of resistate minerals.  Following industry QA/QC standards, blanks, duplicate samples, and certified standards were also assayed.  Due to a Pd over-limit of 10 ppm, there is only qualitative Pd data for sample 3190498 from FA350 analysis.

2004 drilling was conducted by Group Ten’s QP while working for Premium Exploration. 1983 drill results are considered historic and have not been independently verified by Group Ten.

1980s assay data was obtained from a 1986 report by geologist R.J. Warchola titled “A Hydrothermal Gold Occurrence on Chrome Mountain, Stillwater Complex, Montana” published in the Montana Geologic Society and Yellowstone Bighorn Research Association Joint Field Conference and Symposium: Geology of the Beartooth Uplift and Adjacent Basin: YBRA 50th Anniversary Edition, 1986; and a 1984 internal report by R.J. Warchola titled “Geologic Report on the Pine Claim, Sweetgrass County, Montana February 1984”

Assay data for drillhole BR-2 was obtained graphically from a 1979 Anaconda Copper Company map by G.F. Willis and J. Bielak.

Mr. Mike Ostenson, P.Geo., is the qualified person for the purposes of National Instrument 43-101, and he has reviewed and approved the technical disclosure contained in this news release.

Forward-Looking Statements

Forward Looking Statements: This news release includes certain statements that may be deemed “forward-looking statements”. All statements in this release, other than statements of historical facts including, without limitation, statements regarding potential mineralization, historic production, estimation of mineral resources, the realization of mineral resource estimates, interpretation of prior exploration and potential exploration results, the timing and success of exploration activities generally, the timing and results of future resource estimates, permitting time lines, metal prices and currency exchange rates, availability of capital, government regulation of exploration operations, environmental risks, reclamation, title, and future plans and objectives of the company are forward-looking statements that involve various risks and uncertainties. Although Group Ten believes the expectations expressed in such forward-looking statements are based on reasonable assumptions, such statements are not guarantees of future performance and actual results or developments may differ materially from those in the forward-looking statements. Forward-looking statements are based on a number of material factors and assumptions. Factors that could cause actual results to differ materially from those in forward-looking statements include failure to obtain necessary approvals, unsuccessful exploration results, changes in project parameters as plans continue to be refined, results of future resource estimates, future metal prices, availability of capital and financing on acceptable terms, general economic, market or business conditions, risks associated with regulatory changes, defects in title, availability of personnel, materials and equipment on a timely basis, accidents or equipment breakdowns, uninsured risks, delays in receiving government approvals, unanticipated environmental impacts on operations and costs to remedy same, and other exploration or other risks detailed herein and from time to time in the filings made by the companies with securities regulators. Readers are cautioned that mineral resources that are not mineral reserves do not have demonstrated economic viability. Mineral exploration and development of mines is an inherently risky business. Accordingly, the actual events may differ materially from those projected in the forward-looking statements. For more information on Group Ten and the risks and challenges of their businesses, investors should review their annual filings that are available at www.sedar.com.

Neither the TSX Venture Exchange nor its Regulation Services Provider (as that term is defined in the policies of the TSX Venture Exchange) accepts responsibility for the adequacy or accuracy of this release.

Photos accompanying this announcement are available at:

http://www.globenewswire.com/NewsRoom/AttachmentNg/4892ef65-f505-4efc-92a5-e8e4a2e89b03

http://www.globenewswire.com/NewsRoom/AttachmentNg/67397f95-bf6a-4232-aec3-d0827a765b95

Categories
Precious Metals

MILES FRANKLIN Trade the Gold to Silver Ratio

Gary Christenson-Contributing Writer For Miles Franklin
Trade the Gold to Silver Ratio
Miles Franklin sponsored this article by Gary Christenson, the Deviant Investor.
·     Buy gold for insurance against fiscal and monetary predations of central bankers, commercial banking and government. Yes – certainly!
·     Buy silver for insurance, profit and beautiful coins. Yes!
·     Buy both to own real money that has no counter-party risk.
WHEN?
·     The simple answer is buy silver when the gold to silver ratio (G/S) is high and buy gold when the ratio is low. The problem is defining “low” and “high.”
·     Silver prices move higher and lower, faster and farther, than gold prices so the ratio moved between 20 and 100 over the past 50 years. The historical ratio is lower, ten to twenty.
PURPOSE?
·     Maintain physical ownership of precious metals which have no counter-party risk.
·     Enlarge your stacks of silver and gold by trading between gold and silver timed with ratio extremes.
·     Sleep well knowing you own real money – gold and silver – not dodgy over-priced stocks at the end of a gigantic credit expansion and stock boom.
REALLY? SHOW ME!
The above graph of the ratio (weekly data) shows an idealized scenario for trading between gold and silver. Buy gold when the ratio is low and silver is relatively expensive. Sell gold when the ratio is high and silver is relatively inexpensive. The red arrows show 13 trades since 1971 that could have drastically increased total ounces in your metal stacks.
Begin in 1971 with $1,000 invested into gold – 23 ounces. Trade back and forth between gold and silver. By late 2018 your $1,000 in gold grew to over 177,000 ounces of silver, worth over $2,000,000 in a perfect trading world.
These theoretical trades were executed with perfect hindsight – about as likely as:
·     Everyone is above average.
·     The wind is always at your back.
·     Politicians are truthful and care about you.
·     Central bankers are good-hearted souls motivated to protect the best interests of common people.
·     Debt and deficits don’t matter.
·     The COMEX is an honest physical exchange.
IN A MORE REAL WORLD:
·     The future is unknowable.
·     Timing a market is difficult.
·     Greed and fear inhibit making good decisions.
·     Trend changes are difficult to see in real time.
·     All markets are manipulated.
·     Every transaction includes a cost.
TRADING IS BENEFICIAL EVEN IN THE REAL WORLD!
·     Buy silver when the ratio is high—40s before 1980 bubble and over 60 after the 1980 bubble. Sell silver and buy gold when the ratio is low—below 30 before the bubble and below 50 after the bubble. AND…
·     Calculate the five week moving average of the ratio. Trade positions only after the ratio has FALLEN BELOW moving average highs or CROSSED ABOVE moving average lows in the ratio. AND…
·     Calculate the 12 period Relative Strength Index (RSI). Trade positions only after the RSI has reached extreme levels—below 25 or above 75—and reversed. AND…
·     Assume each trade costs 5 percent in transaction expenses.
·     Taxes on income are NOT considered.
This simple trading strategy is less emotional because it’s mechanical. Many other sophisticated systems are possible.
Using this simple system the trades are:
Begin with $1,000 in gold in 1971 – 23 ounces. Trade weekly closing prices 15 times in 40+ years based on the above (or similar) rules. Your stash grows to over 34,000 ounces of silver, worth about $500,000, after transaction costs. This is a good increase but far less than ideal trades made with hindsight.
WHY?
·     Gold and silver prices have risen in 48 years because the banking cartel devalued dollars. Higher prices and further dollar devaluations are inevitable.
·     Each trade roughly doubled total ounces of metal. For perspective, twenty doubles creates a 1,024 factor increase.
Even facing real world difficulties your stack of metal will increase with careful exchanges between gold and silver every two to four years when the G/S ratio moves to extremes.
Miles Franklin discussed gold to silver exchanges and the ratio here and here. The current ratio is 83—high. An exchange from gold into silver remains sensible at this ratio.
Call Miles Franklin at 1–800–822-8080 and exchange gold for underpriced silver.
Keep stacking!
Archived Newsletters
Market Report 1/18/2019
International Storage
Private Safe Deposit Boxes
Unencumbered / Segregated Storage
About Miles Franklin
Miles Franklin was founded in January, 1990 by David MILES Schectman. David’s son, Andy Schectman, our CEO, joined Miles Franklin in 1991. Miles Franklin’s primary focus from 1990 through 1998 was the Swiss Annuity and we were one of the two top firms in the industry. In November, 2000, we decided to de-emphasize our focus on off-shore investing and moved primarily into gold and silver, which we felt were about to enter into a long-term bull market cycle. Our timing and our new direction proved to be the right thing to do.
We are rated A+ by the BBB with zero complaints on our record. We are recommended by many prominent newsletter writers including Doug Casey, Jim Sinclair, David Morgan, Future Money Trends and the SGT Report.
For your protection, we are licensed, regulated, bonded and background checked per Minnesota State law.
Miles Franklin
801 Twelve Oaks Center Drive
Suite 834
Wayzata, MN 55391
1-800-822-8080
Copyright © 2019. All Rights Reserved.