![]()
|
|||
|
 Proven Probable
 ![]()
|
|||
|
Vancouver, British Columbia–(Newsfile Corp. – February 7, 2019) – Maritime Resources Corp. (TSXV: MAE) (“Maritime” or the “Company”) announced that the following management changes have occurred:
Maritime’s President and Chief Executive Officer, Mr. Garett Macdonald, stated, “I would like to thank Niina and Jackie, on behalf of Maritime and its Board, for their contributions to the Company as Maritime’s Chief Financial Officer and Corporate Secretary, respectively and for their assistance with the transition to a new management team. I am also pleased to welcome Germaine and Lorna to Maritime and look forward to working with them as we advance the Hammerdown gold project in Newfoundland & Labrador.”
Ms. Coombs also serves as Vice President and Chief Financial Officer of Aurelius Minerals Inc. and previously was the Vice President and Chief Financial Officer for Stonegate Agricom Ltd. from August 2010 until July 2017. Prior to this, she was Corporate Controller for FNX Mining Company Inc. from August 2004 to May 2010. From 1998 to 2004, she held progressively senior accounting roles at the Iron Ore Company of Canada, a Rio Tinto company. Ms. Coombs brings over 20 years of extensive financial and commercial experience predominantly in the mining and resource industry, successfully leading finance teams through different stages of project financing, construction and operations.
Ms. MacGillivray also serves as Corporate Secretary of Aurelius Minerals Inc. and previously was the Vice President, Secretary and General Counsel for Stonegate Agricom Ltd. from August 2008 until July 2017. Prior to that, she was Assistant Secretary of Thompson Creek Metals Company Inc. from May 2007 to May 2011. Previously, she was Corporate Secretary and General Counsel of Glencairn Gold Corporation from November 2003 to January 2008. Ms. MacGillivray has 30 years of in-house legal and corporate secretarial experience for mining companies, including Campbell Resources Inc., Zemex Corporation and Northgate Exploration Limited.
About Maritime Resources Corp.:
Maritime Resources holds a 100% interest in the Green Bay Property, including the former Hammerdown gold mine, located near Springdale, Newfoundland and Labrador, Canada.
Maritime Resources Corp.
Garett Macdonald, President & CEO
For further information, please call:
Garett Macdonald
Telephone: 416 365 5321
info@maritimegold.com
www.maritimeresourcescorp.com
The TSX Venture Exchange does not accept responsibility for the adequacy or accuracy of this release. Statements in this press release, other than purely historical information, including statements relating to the Company’s future plans and objectives or expected results, may include forward-looking statements. Forward-looking statements are based on numerous assumptions and are subject to all of the risks and uncertainties inherent in resource exploration and development. As a result, actual results may vary materially from those described in the forward-looking statements
Caution Regarding Forward Looking Statements:
Certain information included in this press release, including information relating to future financial or operating performance and other statements that express the expectations of management or estimates of future performance constitute “forward-looking statements”. Such forward-looking statements include, without limitation, statements regarding copper, gold and silver forecasts, the financial strength of the Company, estimates regarding timing of future development and production and statements concerning possible expansion opportunities for the Company. Where the Company expresses or implies an expectation or belief as to future events or results, such expectation or belief are based on assumptions made in good faith and believed to have a reasonable basis. Such assumptions include, without limitation, the price of and anticipated costs of recovery of, copper concentrate, gold and silver, the presence of and continuity of such minerals at modeled grades and values, the capacities of various machinery and equipment, the availability of personnel, machinery and equipment at estimated prices, mineral recovery rates, and others. However, forward-looking statements are subject to risks, uncertainties and other factors, which could cause actual results to differ materially from future results expressed, projected or implied by such forward-looking statements. Such risks include, but are not limited to, interpretation and implications of drilling and geophysical results; estimates regarding timing of future capital expenditures and costs towards profitable commercial operations. Other factors that could cause actual results, developments or events to differ materially from those anticipated include, among others, increases/decreases in production; volatility in metals prices and demand; currency fluctuations; cash operating margins; cash operating cost per pound sold; costs per ton of ore; variances in ore grade or recovery rates from those assumed in mining plans; reserves and/or resources; the ability to successfully integrate acquired assets; operational risks inherent in mining or development activities and legislative factors relating to prices, taxes, royalties, land use, title and permits, importing and exporting of minerals and environmental protection. Accordingly, undue reliance should not be placed on forward-looking statements and the forward-looking statements contained in this press release are expressly qualified in their entirety by this cautionary statement. The forward-looking statements contained herein are made as at the date hereof and the Company does not undertake any obligation to update publicly or revise any such forward-looking statements or any forward-looking statements contained in any other documents whether as a result of new information, future events or otherwise, except as required under applicable security law.
To view the source version of this press release, please visit https://www.newsfilecorp.com/release/42720
VANCOUVER, British Columbia, Feb. 07, 2019 (GLOBE NEWSWIRE) — Aben Resources Ltd. (TSX-V: ABN) (OTCQB: ABNAF) (Frankfurt: E2L2) (the “Company”) announces, pursuant to its stock option plan, the Company has granted incentive stock options to its directors, officers, employees and consultants to purchase up to an aggregate of 4,000,000 common shares in the capital stock of the Company, exercisable for a period of two years, at a price of $0.16 per share. The Company’s 10% rolling stock option plan was approved by the shareholders at the Annual General Meeting of the Company held on July 25, 2018.
About Aben Resources:
Aben Resources is a Canadian gold exploration company developing gold-focused projects in British Columbia, the Yukon Territory, and Saskatchewan. Aben is a well-funded junior exploration company with over $5 million in its treasury and no debt.
For further information on Aben Resources Ltd. (TSX-V: ABN), visit our Company’s web site at www.abenresources.com.
ABEN RESOURCES LTD.
“Jim Pettit”
______________________
JAMES G. PETTIT
President & CEO
For further information contact myself or:
Don Myers
Aben Resources Ltd.
Director, Corporate Communications
Telephone: 604-687-3376
Toll Free: 800-567-8181
Facsimile: 604-687-3119
Email: info@abenresources.com
Neither TSX Venture Exchange nor its Regulation Services Provider (as that term is defined in the policies of the TSX Venture Exchange) accepts responsibility for the adequacy or accuracy of this release.
This release includes certain statements that may be deemed to be “forward-looking statements”. All statements in this release, other than statements of historical facts, that address events or developments that management of the Company expects, are forward-looking statements. Although management believes the expectations expressed in such forward-looking statements are based on reasonable assumptions, such statements are not guarantees of future performance, and actual results or developments may differ materially from those in the forward-looking statements. The Company undertakes no obligation to update these forward-looking statements if management’s beliefs, estimates or opinions, or other factors, should change. Factors that could cause actual results to differ materially from those in forward-looking statements, include market prices, exploration and development successes, continued availability of capital and financing, and general economic, market or business conditions. Please see the public filings of the Company at www.sedar.com for further information.
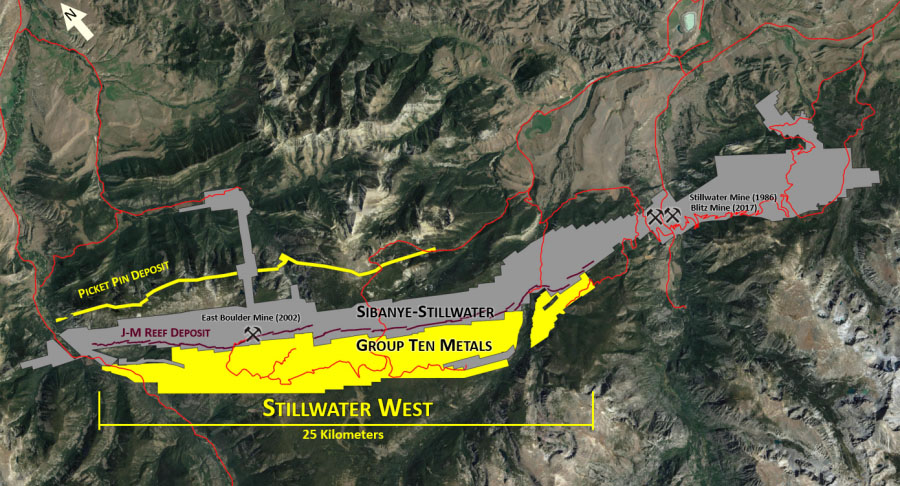
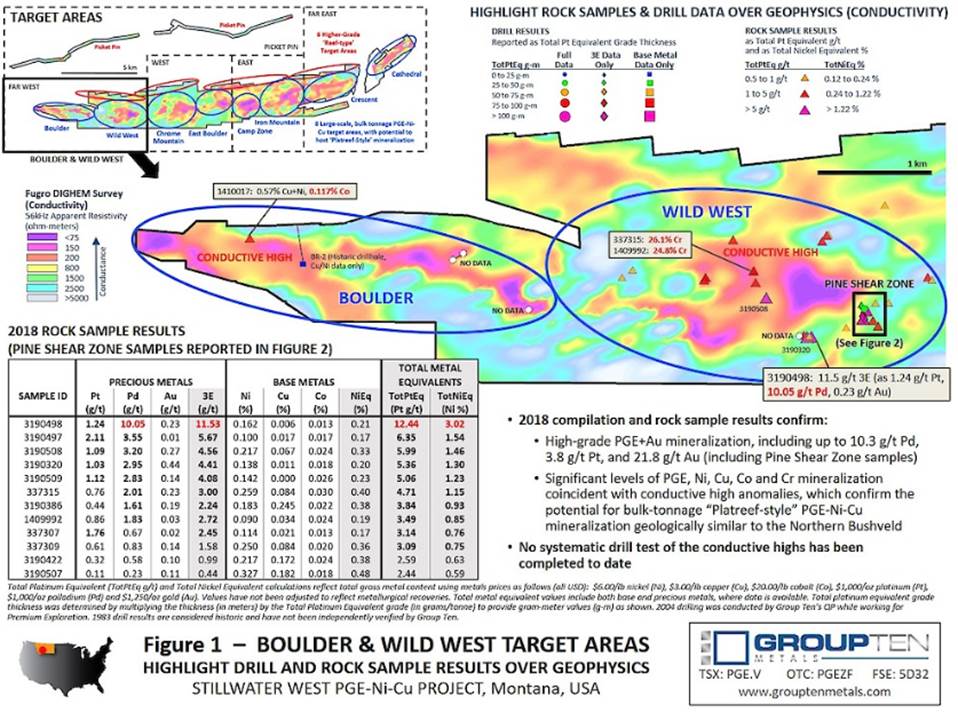
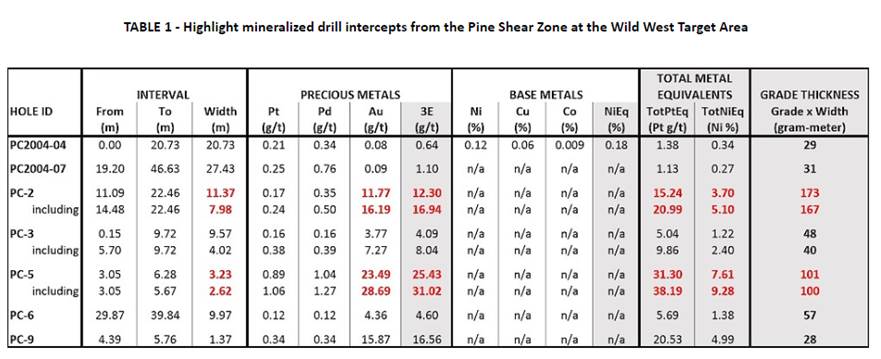
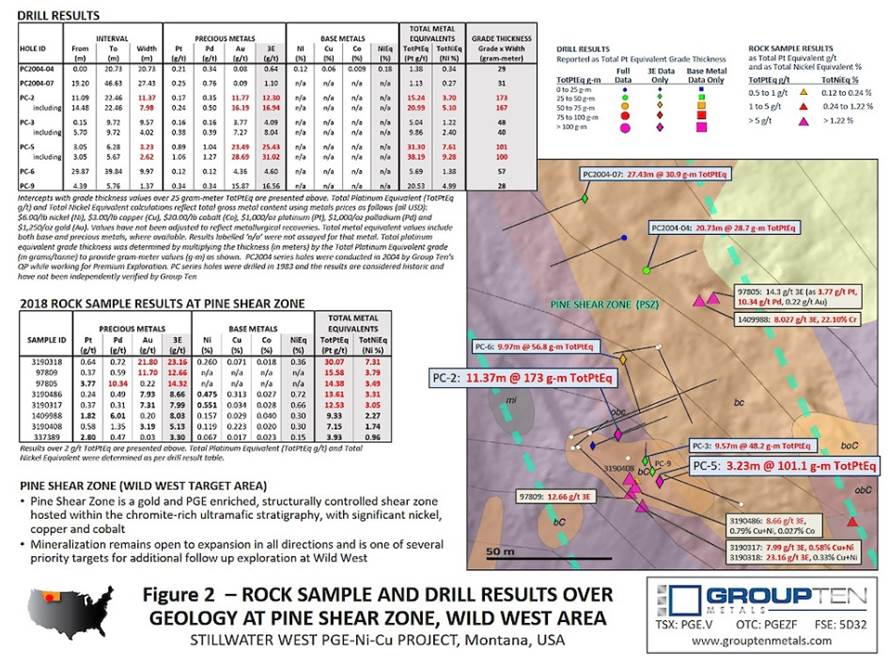
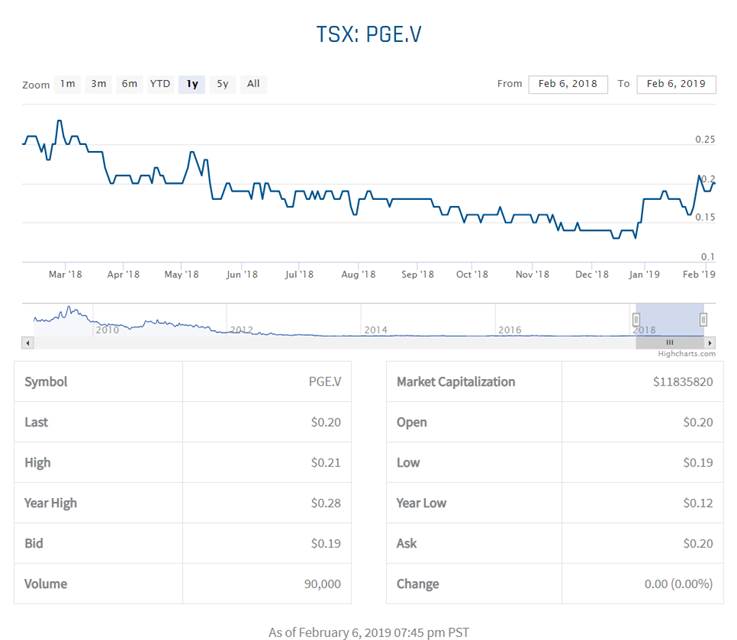
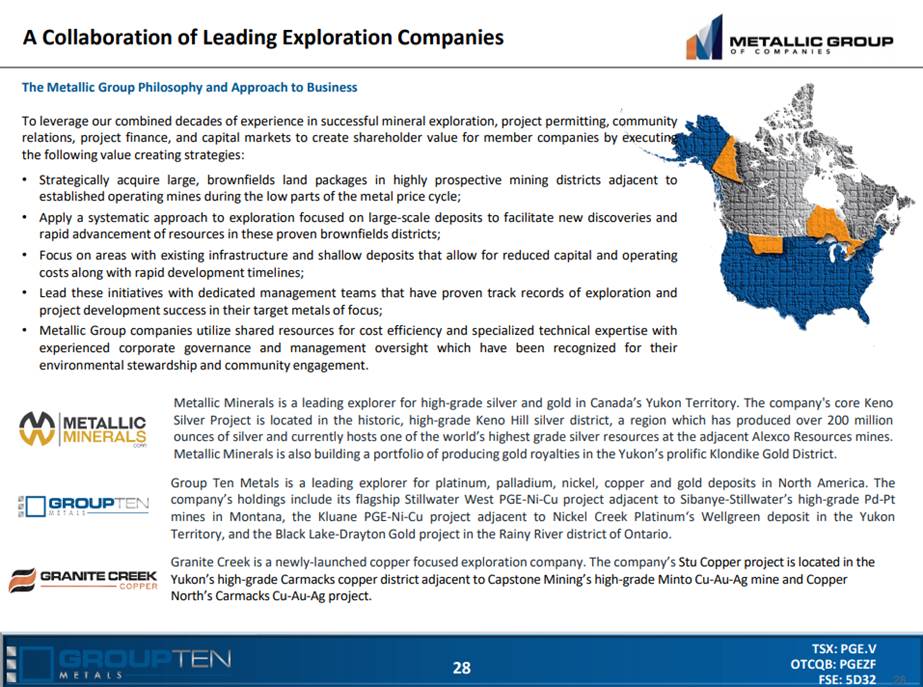
Michael Rowley of President and CEO of Group Ten Metals (TSX: PGE) sits down with Maurice Jackson of Proven and Probable to discuss the company’s latest press release regarding the High-Grade Palladium, Platinum, and Gold results from the Wild West and Boulder Target Areas, which are the beginning 2 out of 14 Target Area results. Shareholders will be extremely impressed with the company’s findings.
Source: Maurice Jackson for Streetwise Reports (2/7/19)

Michael Rowley, president and CEO of Group Ten Metals, sits down with Maurice Jackson of Proven and Probable to discuss his company’s recent drill results at its Montana PGE project that is also showing significant gold mineralization.
Disclosure:
1) Maurice Jackson: I, or members of my immediate household or family, own shares of the following companies mentioned in this article: Group Ten Metals and Metallic Minerals. I personally am, or members of my immediate household or family are, paid by the following companies mentioned in this article: None. My company has a financial relationship with the following companies mentioned in this article: Group Ten Metals and Metallic Minerals are sponsors of Proven and Probable. Proven and Probable disclosures are listed below.
2) The following companies mentioned in this article are billboard sponsors of Streetwise Reports: None. Click herefor important disclosures about sponsor fees.
3) Statements and opinions expressed are the opinions of the author and not of Streetwise Reports or its officers. The author is wholly responsible for the validity of the statements. The author was not paid by Streetwise Reports for this article. Streetwise Reports was not paid by the author to publish or syndicate this article. The information provided above is for informational purposes only and is not a recommendation to buy or sell any security. Streetwise Reports requires contributing authors to disclose any shareholdings in, or economic relationships with, companies that they write about. Streetwise Reports relies upon the authors to accurately provide this information and Streetwise Reports has no means of verifying its accuracy.
4) This article does not constitute investment advice. Each reader is encouraged to consult with his or her individual financial professional and any action a reader takes as a result of information presented here is his or her own responsibility. By opening this page, each reader accepts and agrees to Streetwise Reports’ terms of use and full legal disclaimer. This article is not a solicitation for investment. Streetwise Reports does not render general or specific investment advice and the information on Streetwise Reports should not be considered a recommendation to buy or sell any security. Streetwise Reports does not endorse or recommend the business, products, services or securities of any company mentioned on Streetwise Reports.
5) From time to time, Streetwise Reports LLC and its directors, officers, employees or members of their families, as well as persons interviewed for articles and interviews on the site, may have a long or short position in securities mentioned. Directors, officers, employees or members of their immediate families are prohibited from making purchases and/or sales of those securities in the open market or otherwise from the time of the interview or the decision to write an article until three business days after the publication of the interview or article. The foregoing prohibition does not apply to articles that in substance only restate previously published company releases.
Proven and Probable LLC receives financial compensation from its sponsors. The compensation is used is to fund both sponsor-specific activities and general report activities, website, and general and administrative costs. Sponsor-specific activities may include aggregating content and publishing that content on the Proven and Probable website, creating and maintaining company landing pages, interviewing key management, posting a banner/billboard, and/or issuing press releases. The fees also cover the costs for Proven and Probable to publish sector-specific information on our site, and also to create content by interviewing experts in the sector. Monthly sponsorship fees range from $1,000 to $4,000 per month. Proven and Probable LLC does accept stock for payment of sponsorship fees. Sponsor pages may be considered advertising for the purposes of 18 U.S.C. 1734.
The Information presented in Proven and Probable is provided for educational and informational purposes only, without any express or implied warranty of any kind, including warranties of accuracy, completeness, or fitness for any particular purpose. The Information contained in or provided from or through this forum is not intended to be and does not constitute financial advice, investment advice, trading advice or any other advice. The Information on this forum and provided from or through this forum is general in nature and is not specific to you the User or anyone else. You should not make any decision, financial, investments, trading or otherwise, based on any of the information presented on this forum without undertaking independent due diligence and consultation with a professional broker or competent financial advisor. You understand that you are using any and all Information available on or through this forum at your own risk.
Images provided by the author.
Click here for the complete press release.
Stefan Axell
Director, Corporate Affairs
416-306-6328
info@franco-nevada.com
Sandip Rana
Chief Financial Officer
416-306-6303
VANCOUVER, BC / ACCESSWIRE / February 6, 2019 / NV Gold Corporation (TSX-V: NVX; OTC PINK: NVGLF) (“NV Gold” or the “Company“) is pleased to announce that Dr. Marcus Johnston has joined the Company as Vice President of Exploration, after serving as a consultant and Exploration Manager for NV Gold since early 2018.
“I am pleased to welcome Dr. Marcus Johnston to NV Gold’s executive management team as VP Exploration, after assisting the Company as Exploration Manager over the past year,” John E. Watson, Chairman of NV Gold commented. “We are currently reviewing multiple priority accretive exploration projects in preparation for the 2019 season, with the objective of securing an advanced mineral project to actively explore utilizing our multiple extensive geological databases, and in-house technical team and Board. Dr. Johnston’s extensive experience of evaluating and exploring properties in Nevada, will play a key role in advancing our mineral property portfolio in 2019. With a tight corporate share structure, low burn rate, and focused management team, we look forward to a positive year ahead. I wish to thank our supportive and patient shareholders, as displayed in the recent AGM voting, as we ensure we select and advance key mineral properties for exploration.”
Dr. Marcus Johnston, PhD in Economic Geology, brings more than 20 years of experience in exploration and mining, with an emphasis on mineral systems in Nevada. Dr. Johnston has consulted to various private groups over the past four years, including NV Gold, since early 2018. Prior to this, he has worked with Renaissance Gold Inc., Victoria Gold Corp., and Newmont Gold Corp. Dr. Johnston began his research on Carlin-type deposits in 1997, which led directly to the discovery of the Helen Zone (current resource is 713,000 oz gold and 237,000 oz silver) near the old Cove open pit in north-central Nevada, and revitalization of the entire McCoy mining district (now owned by Premier Gold Mines Ltd.). Dr. Johnston has evaluated more than 500 properties in Nevada, and played an integral role in advancing numerous exploration projects and active mines. Dr. Johnston holds a BSc from George Mason University, an MSc from the University of North Carolina Wilmington, a PhD from the Ralph J. Roberts Center for Research in Economic Geology at the University of Nevada, Reno, and is an active member and former President and Director of the Geological Society of Nevada.
NV Gold reports the strong support and re-election of John Watson (Chairman and CEO), Peter A. Ball (President & COO), Dr. Quinton Hennigh, Dr. Odin Christensen, and Alfred “Alf” Stewart as Directors of the Company at its annual general meeting held January 30, 2019. At the meeting, the Company’s shareholders also approved the renewal of the Company’s stock option plan and the re-appointment of Davidson & Company LLP as auditors of the Company, as set out in the Company’s management information circular dated December 11, 2018.
The Company announces that it has granted incentive stock options to an officer and consultant under its Stock Option Plan entitling them to purchase an aggregate of up to 375,000 common shares of the Company. The stock options are exercisable on or before January 30, 2024 at a price of $0.17 per share. In addition to receiving stock options, Dr. Johnston will also receive a one-time bonus of 190,000 shares of the Company in respect of his appointment, subject to TSX Venture Exchange acceptance.
About NV Gold Corporation
NV Gold is a junior exploration company based in Vancouver, British Columbia that is focused on delivering value through mineral discoveries. Leveraging its highly experienced in-house technical knowledge, NV Gold’s geological team intends to utilize its geological databases, which contains a vast treasury of field knowledge spanning decades of research and exploration, combined with a portfolio of mineral properties in Nevada, to prioritize key projects for focused exploration programs.
On behalf of the Board of Directors,
John E. Watson
Chairman and CEO
For further information, visit the Company’s website at www.nvgoldcorp.com or contact:
Peter A. Ball, President & COO
Phone: 1-888-363-9883
Email: peter@nvgoldcorp.com
Neither the TSX Venture Exchange nor its Regulation Service Provider (as that term is defined in the policies of the TSX Venture Exchange) accepts responsibility for the adequacy or accuracy of this release.
Forward Looking Statements
This news release includes certain forward-looking statements or information. All statements other than statements of historical fact included in this release are forward-looking statements that involve various risks and uncertainties. The expectation of creating shareholder value from NVX’s efforts as owner of the Properties and the Databases and other future plans and objectives of the Company, including exploration plans, are forward-looking statements that involve various risks and uncertainties. There can be no assurance that such statements will prove to be accurate and actual results and future events could differ materially from those anticipated in such statements. Important factors that could cause actual results to differ materially from the Company’s plans or expectations include market prices, availability of capital and financing, general economic, market or business conditions, regulatory changes, timeliness of government or regulatory approvals and other risks detailed herein and from time to time in the filings made by the Company with securities regulators. The Company disclaims any intention or obligation to update or revise any forward-looking statements whether as a result of new information, future events or otherwise except as otherwise required by applicable securities legislation.
SOURCE: NV Gold Corporation
View source version on accesswire.com:
https://www.accesswire.com/534601/NV-Gold-Appoints-Dr-Marcus-Johnston-PhD-as-VP-Exploration

|
|
TSX Trading symbol: U
TORONTO , Feb. 5, 2019 /CNW/ – Uranium Participation Corporation (“UPC”) (TSX:U) reports its estimated net asset value at January 31, 2019 was CAD$673.5 million or CAD$4.88 per share. As at January 31, 2019 , UPC’s uranium investment portfolio consisted of the following: View PDF
|
(in thousands of Canadian dollars, except quantity amounts) |
Quantity |
Fair Value |
|||
|
Investments in Uranium: |
|||||
|
Uranium oxide in concentrates (“U3O8“) |
14,159,354 lbs |
$ |
537,859 |
||
|
Uranium hexafluoride (“UF6“) |
1,117,230 KgU |
$ |
129,227 |
||
|
$ |
667,086 |
||||
|
U3O8 fair value1 per pound: |
|||||
|
– In Canadian dollars1 |
$ |
37.99 |
|||
|
– In United States dollars |
$ |
28.90 |
|||
|
UF6 fair value1 per KgU: |
|||||
|
– In Canadian dollars1 |
$ |
115.67 |
|||
|
– In United States dollars |
$ |
88.00 |
|||
|
1 Fair values are month-end spot prices published by Ux Consulting Company, LLC, translated at the Bank of Canada’s month-end daily exchange rate of $1.3144 |
On the last trading day of January 2019 , the common shares of UPC closed on the TSX at a value of CAD$4.78 , which represents a 2.05% discount to the net asset value of CAD$4.88 per share.
About Uranium Participation Corporation
Uranium Participation Corporation is a company that invests substantially all of its assets in uranium oxide in concentrates (“U3O8“) and uranium hexafluoride (“UF6“) (collectively “uranium”), with the primary investment objective of achieving appreciation in the value of its uranium holdings through increases in the uranium price. UPC provides investors with a unique opportunity to gain exposure to the price of uranium without the resource or project risk associated with investing in a traditional mining company. Additional information about Uranium Participation Corporation is available on SEDAR at www.sedar.com and on UPC’s website at www.uraniumparticipation.com.
Caution Regarding Forward-Looking Information
This press release contains certain forward-looking statements and forward-looking information that are based on UPC’s current internal expectations, estimates, projections, assumptions and beliefs. Forward-looking statements generally can be identified by the use of forward-looking terminology such as “may”, “will”, “expect”, “intent”, “estimate”, “anticipate”, “plan”, “should”, “believe” or “continue” or the negative thereof or variations thereon or similar terminology and include statements with respect to UPC’s investment objectives.
By their very nature, forward-looking statements involve numerous factors, assumptions and estimates. A variety of factors, many of which are beyond the control of UPC, may cause actual results to differ materially from the expectations expressed in the forward-looking statement. These factors include, but are not limited to, changes in commodity prices and foreign exchange as well as the risk that UPC will not obtain the anticipated benefits of its agreements with third parties. For a description of the principal risks of UPC, see “Risk Factors” in UPC’s Annual Information Form dated May 14, 2018 for the year ended February 28, 2018 , a copy of which is available at www.sedar.com.
These and other factors should be considered carefully, and readers are cautioned not to place undue reliance on these forward-looking statements. Although management reviews the reasonableness of its assumptions and estimates, unusual and unanticipated events may occur which render them inaccurate. Under such circumstances, future performance may differ materially from those expressed or implied by the forward-looking statements. Except where required under applicable securities legislation, UPC does not undertake to update any forward-looking information statement.
SOURCE Uranium Participation Corporation
View original content: http://www.newswire.ca/en/releases/archive/February2019/05/c9193.html

February is now upon us and it’s time to share another construction update and some recent photos. Once again, we remain on schedule to enter production in Q4 of this year.

East Main Shaft
We have temporarily stopped lateral development on the 2770 and 2850 levels in order to install utilities in the shaft.
The utilities installed to date include two, very impressive, 350 hp ventilation fans and the accompanying ventilation ducting that runs down the entire length of the east main shaft. This provides a strong, constant flow of fresh air to the 2770 and 2850 levels.
We have also installed a 10-inch dewatering line from surface down to the 2850 level for future dewatering pumps.
Up next: The resumption of lateral development mining on both the 2770 and 2850 levels


East-North Vent Shaft
The headframe has been installed along with the jumbo nest. This is used to swing the drill jumbo in and out of the shaft during shaft sinking activities.
All hoist sheave wheels have been installed and all ropes have been wound onto the main hoist as well as the three Galloway winches and the emergency auxiliary hoist. All headframe support backlegs are installed and the electrical and safety systems have been installed
Please get in touch with any questions and be sure to subscribe to our mailing list to receive the latest news releases and updates as they are released.
David Swisher, SVP of Operations


