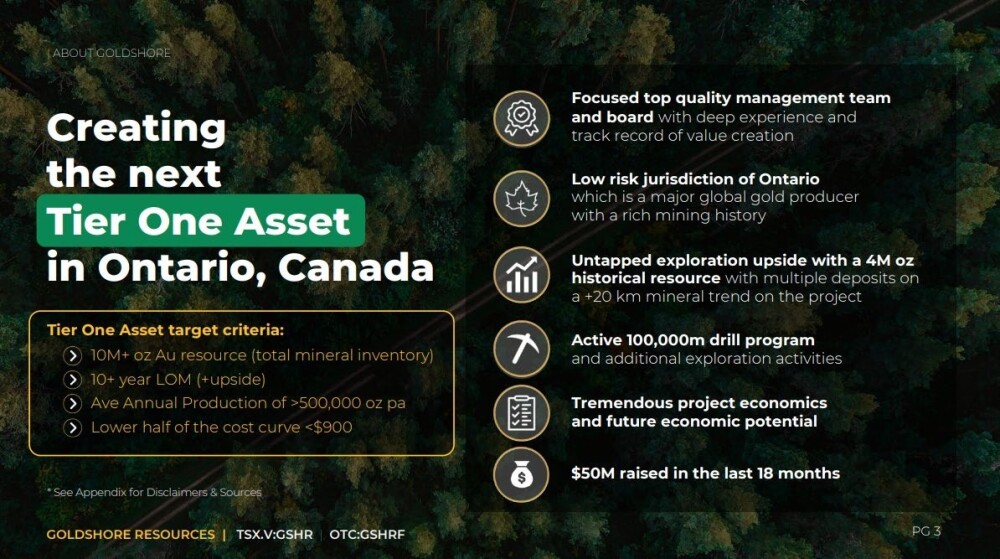
Creating
the next
Tier One Asset
in Ontario, Canada
Original Source: https://www.streetwisereports.com/article/2022/04/28/gold-shore-resources-creating-a-new-asset-in-ontario.html?m_t=2022_04_28_11_54_13
Joining us for a conversation is Brett Richards the CEO of
Goldshore Resources Inc.
(GSHR:TSX – GSHRF:OTC – 8X00:FSE)
$0.53
2022/4/29 18:13:59
| Volume: 178,258 Market Cap: 61.19m PE Ratio: 2.70 Year High: $0.98 Year Low: $0.39 Shares Out: 115,458,038 Float: 132,943,270 | Institute Hold’gs: 0.40% (as of 03/31/22) Institutions Bought Prev 3 Mo: 0 |
Goldshore Resources Inc. (GSHR:TSX; GSHRF:OTC; 8X00:FSE). Mr. Richards, it’s a pleasure to be speaking with you today, to have you introduce us to Goldshore Resources, which is focused on creating the next Tier One Asset in Ontario, Canada.
Before we deep dive into company specifics, Mr. Richards, please introduce us to Goldshore Resources, and the exciting opportunity the company presents to the shareholders.
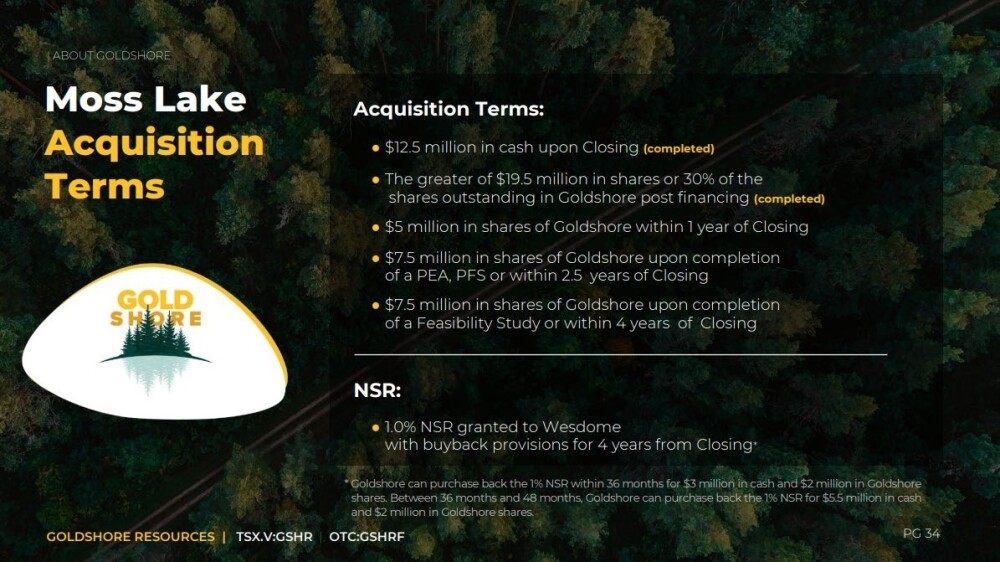
Thanks Maurice. Goldshore Resources was founded in January 2021 with the acquisition of the Moss Lake Project from
Wesdome Gold Mines Ltd.
(WDO:TSX)
$13.11 +0.38%
2022/4/29 18:13:59
| Volume: 449,376 Market Cap: 1.87b PE Ratio: 13.90 Year High: $16.77 Year Low: $8.90 Shares Out: 142,419,793 Float: 142,500,000 | Institute Hold’gs: 65.60% (as of 03/31/22) Institutions Bought Prev 3 Mo: 2,483,412 |
Streetwise Reports Articles
See More Live DataWesdome Gold Mines Ltd. (WDO:TSX) for $52M in cash and shares. Subsequent to that, we raised $25M and then received approval from the TSXV, and we were admitted for trading on June 4, 2021. Since that time, we have been focused on a comprehensive exploration approach to the asset —commencing with a VTEM geophysical survey, which will guide (is guiding) a 100,000m drill program. Currently, we are about 20% of the way through the program—and we expect to complete the program in 2022. During this period, we will conduct extensive metallurgical test work, prepare the project from an ESG standpoint for a feasibility study, and prepare the project for the next phase of development drilling. After which (Q1 2023) we will update the resource estimation and prepare a new preliminary economic analysis (“PEA”) – (end of Q1 2023). These are the steps we are taking to create the next Tier One Asset in Ontario, Canada.
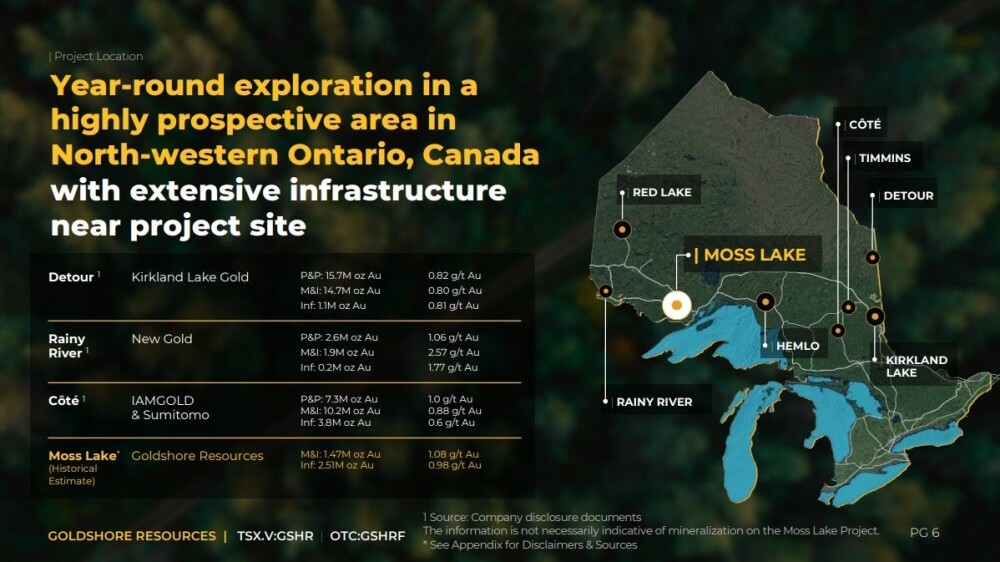
Let’s find out more! Mr. Richards, please acquaint us with your flagship Moss Lake Property beginning with your location and some of your neighbors in the region.
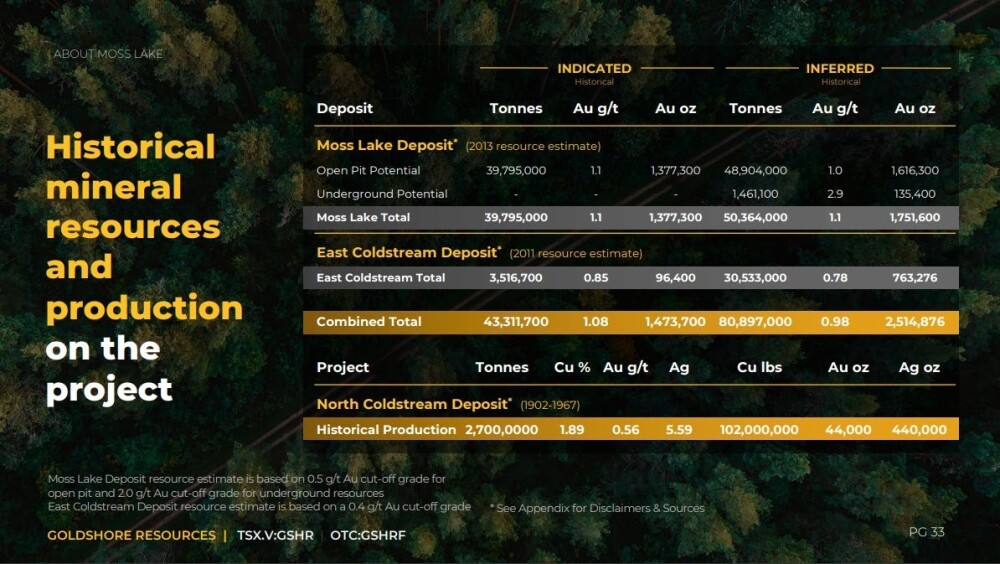
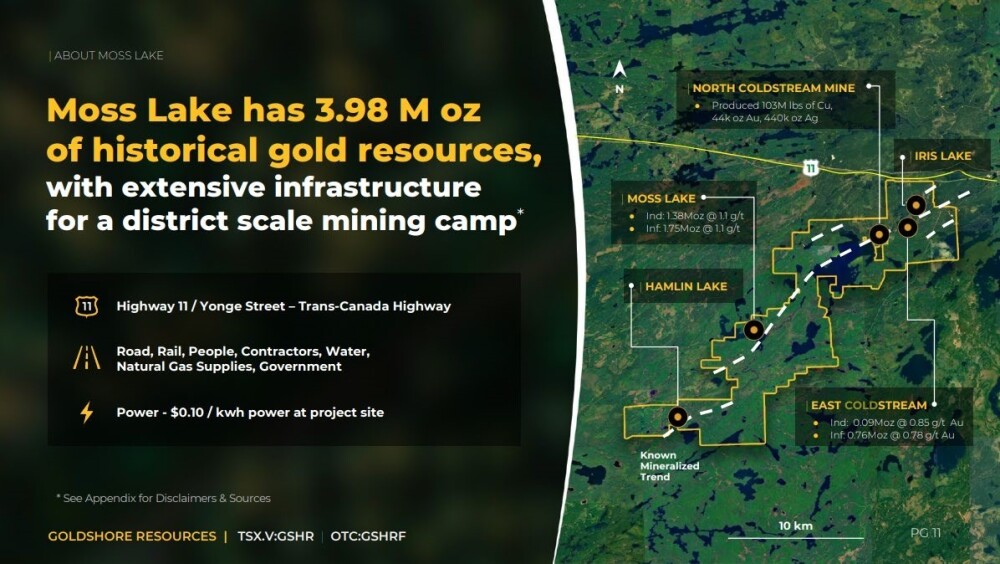
We are apx. 120 km west of Thunder Bay, Ontario on the Trans-Canada highway. We have the flagship Moss Lake Gold project as our core focus, but in 2014 and 2015, Wesdome acquired additional lands adjacent to the Moss Lake Gold project that included Coldstream, North Coldstream, and Iris Lake to the northeast; and Hamlin Lake to the south-west. We have a c.4m oz historical resource, estimated by Moss Lake in 2013, and had a historical PEA done in 2013 that input parameters were updated by Wesdome in 2020. The Moss Lake Property has a rich history of gold and silver production dating back to the early 1900s.
Tell us more.
The area has been explored by prospectors for a long time, literally over 100 years. The region of the Shebandowan Greenstone belt is a fairly complex region geologically and structurally, but the Moss Lake Project is in an area contained within intermediate to felsic volcaniclastic rocks of the northeast-trending, fault-bounded central intermediate to felsic metavolcanic belt, is vertical to steeply southeast dipping and possibly overturned. Two northeast-trending regional fault structures cross the property from northeast to southwest. We have a domain boundary area at Moss Lake that is a sheer zone style of deposit hosted with diorite intrusions with high resistors and high chargeability—bordered with domains of high conductors (magnetite and iron), which to the north-east and south-west are very different styles of deposit and host copper-gold-silver, and to the northeast, those elements along with lead-zinc-molybdenum and in North Coldstream, cobalt. The North Coldstream mine actually produced a copper-gold concentrate for many years in the 1940s through the 1960s, before being closed and decommissioned in 1982 due to the low copper price.
I am curious is the infrastructure still intact?
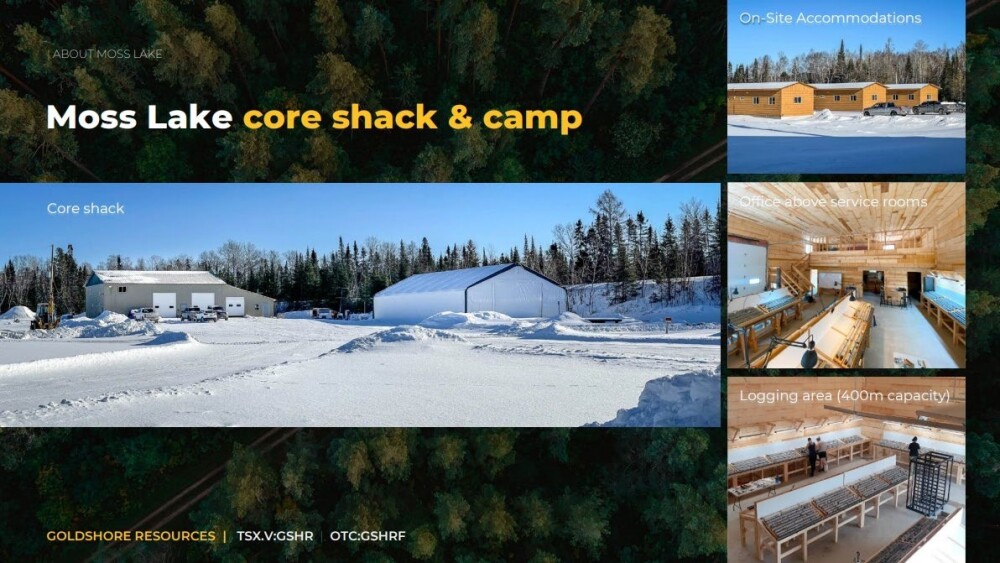
There is no infrastructure still intact at North Coldstream, as it has been decommissioned—but one day, I will look forward to mining the high-grade area of historic tailings that have been decommissioned. But when we speak of infrastructure, there is substantial infrastructure to build a district-scale mining camp at Moss Lake.
Why do I say that? Because our land package is quite extensive and touches on the Trans-Canada highway—Highway 11 (the longest street in the world—Yonge Street). With that access, we have: very inexpensive / high-capacity electric grid power; natural gas; 4 lane highway; both CN and CP Rail lines within 1 km., with a rail spur near our site; access to people / contractors / consultants and a skilled workforce in Thunder Bay, and an international airport within 120 km of our site. These are all literally on our doorstep, which makes building a large-scale mining camp in the area, extremely doable.
Let’s fast forward to 2020 when I understand a robust PEA was completed. Can you walk us through the numbers?
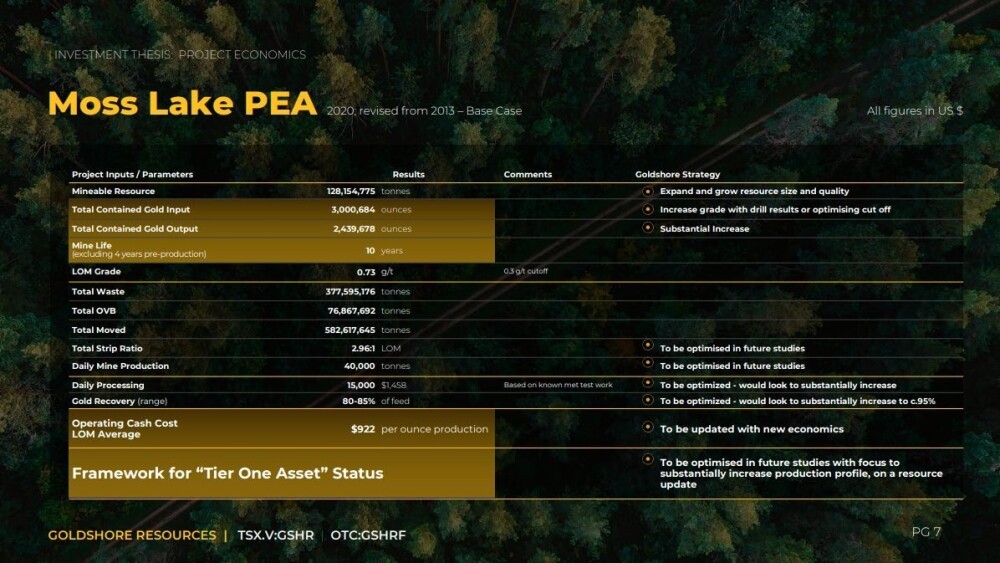
Yes—no problem. The 2013 PEA that was updated by Wesdome in 2020 has a number of caveats to the framework of becoming a Tier One Asset, but what we need to do is increase the size of the resource to closer to 10M oz.
The raw numbers are:
- 128M tonnes is the mineable resource.
- 3M oz Au gets pulled in the life of mine (“LOM”) plan [mineable pit shell(s)].
- 45M Au is the output for a 10-year LOM, o.
- 245K oz Au production per year for 10 years.
- Pre-production CapEx is CA$542M.
- Cash costs are apx. CA$926 / oz.
- 5% discount rate.
- You will note the recoveries are quite low at 80% in the Mian Zone and 85% in the QES Zone, and we look to increase these to mid 90%+ recoveries, which will go straight to the net present value (“NPV”) of the project.
Before we go on-site, can you share some of the key economic outputs for Moss Lake Property?
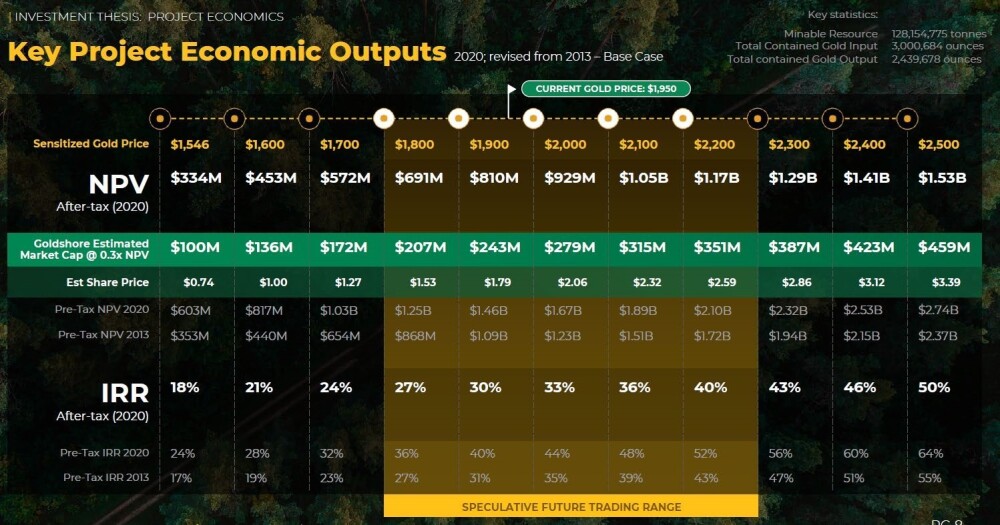
Well, the economic outputs are quite staggering in my view. The post-tax NPV of the project at the base case gold price used ($1,546) was $334M, and when sensitized up to today’s trading range—it is anywhere from $691M to $1.1B—and that is our starting point before we add any ounces to the project.
Companies at our stage of development trade at 0.3X NPV, and that puts us at an estimated share price trading range from $1.53 ($1,800 Au) to $2.59 ($2,200 Au), and today we are trading at $0.50—so it is easy to see why I am excited about this project, and it is very easy to see the value creation that we can deliver on as we take steps to make this a Tier One Asset.
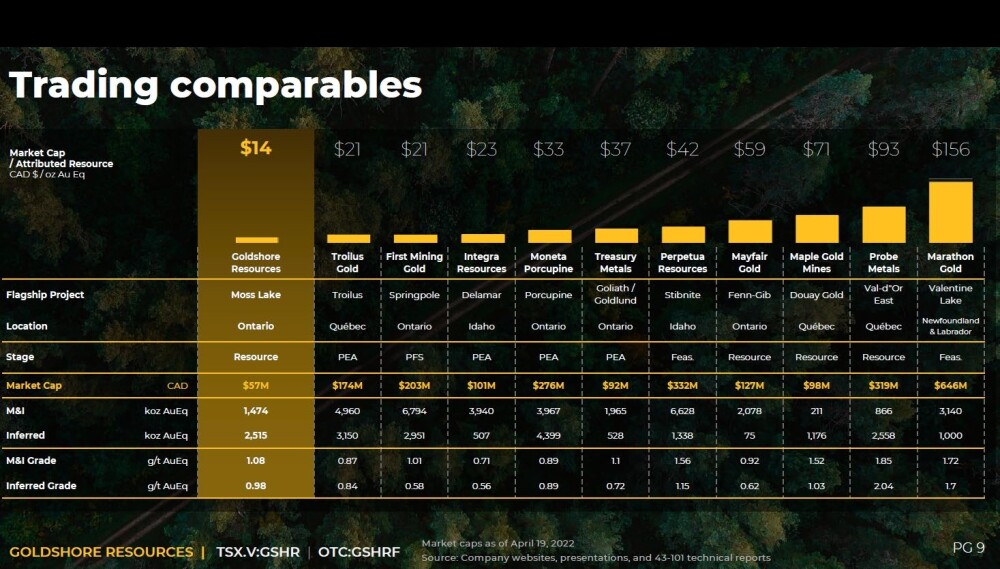
When we look at trading comparables on a like-for-like basis with respect to the style of deposit, jurisdiction, stage of development, etc., we are trading at a fraction of the mean of our peer group on a market cap to per ounce basis, and again, this is our starting point. So also again, you can easily see the room for share price appreciation throughout the remainder of this year and as we head towards a resource estimation update and new PEA.
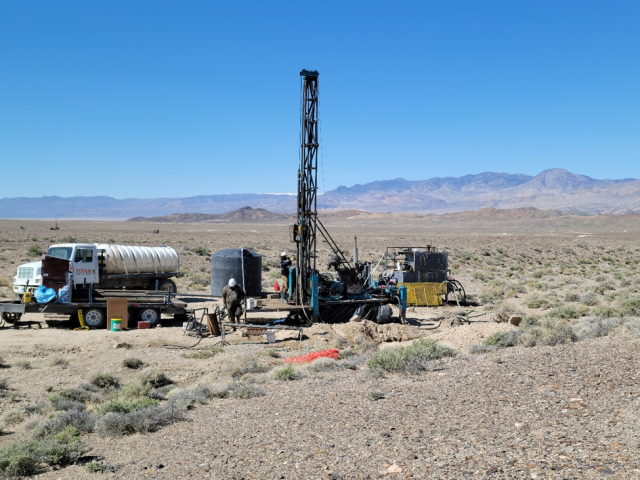
Let’s get some boots on the ground and visit the Moss Lake Property where the company is currently undergoing a massive 100,000 Meter Drill Program.
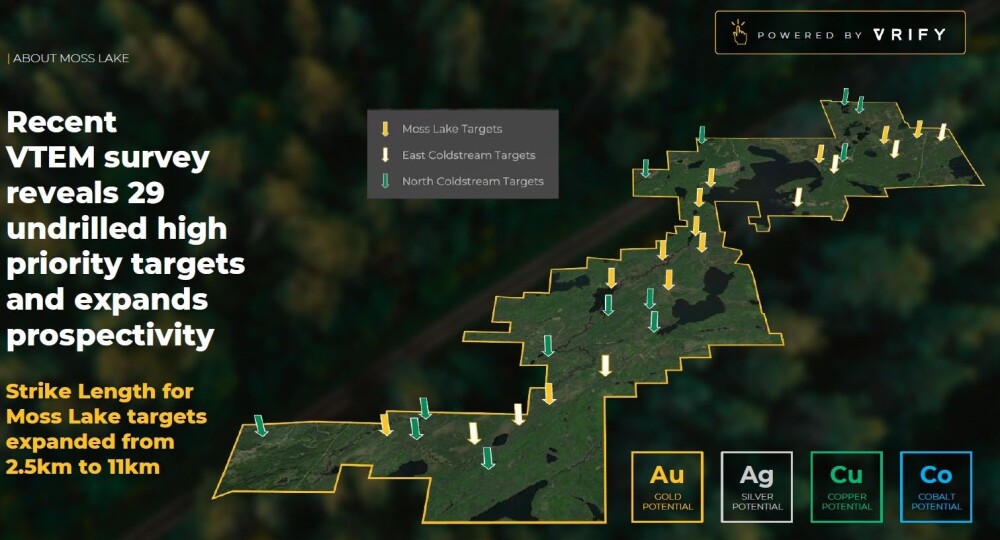
Beginning with geophysical airborne analysis what can you share with us? What was the VTEM able to determine?
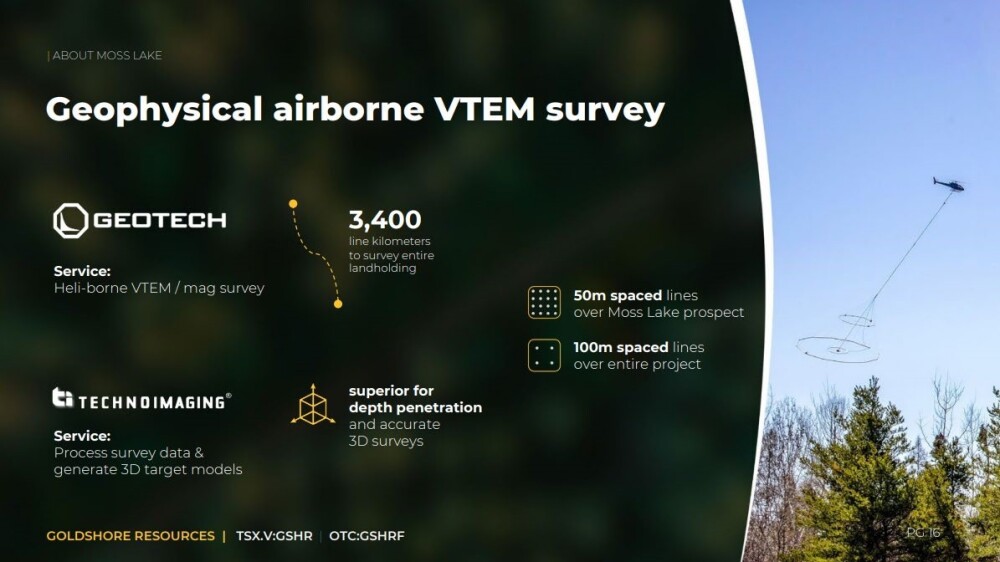
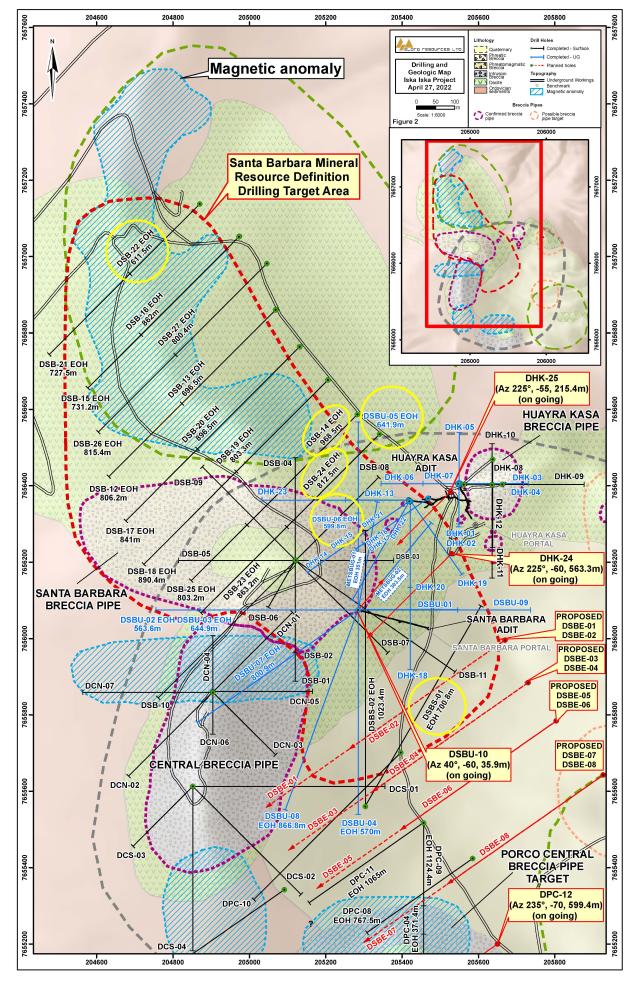
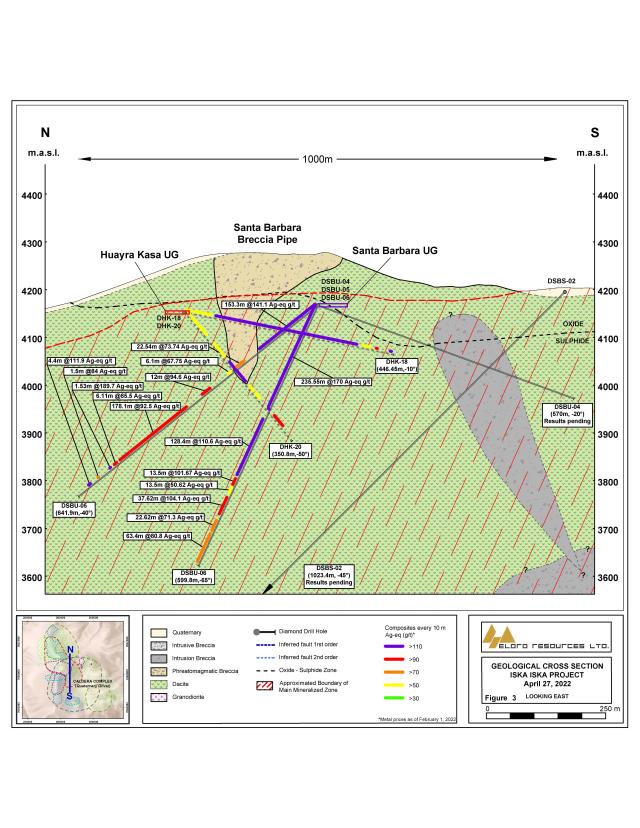
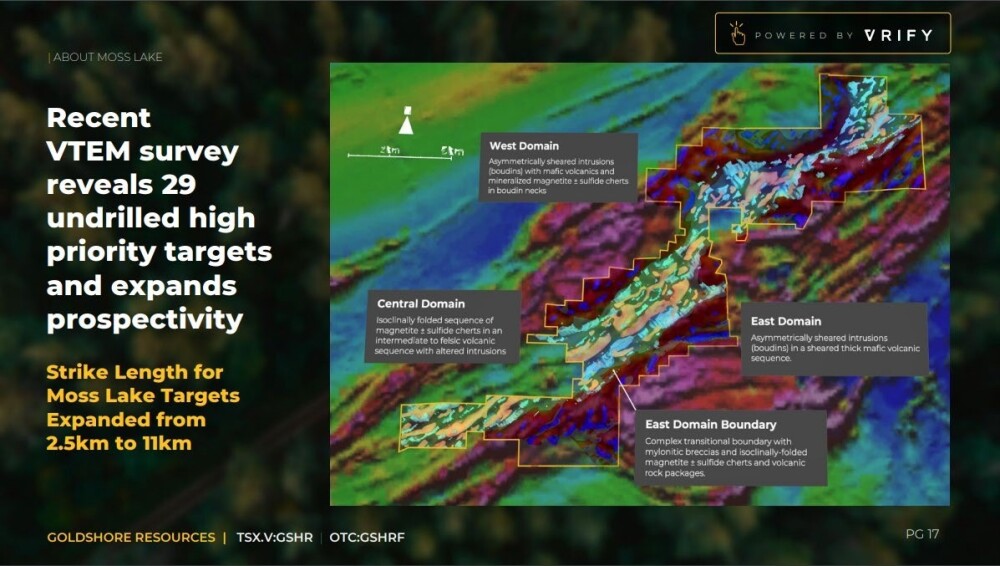
The VTEM survey ended up being an invaluable part of our analysis of this project. Geotech and TechnoImaging did an amazing job of not only putting this together, but also putting the interpretation together for us to better identify high-probability drill targets in not just Moss Lake, but also in the northeast Coldstream area, and the south-west Hamlin Lake area. We now have 29 brand new targets that are very compelling when you look at layering: historical exploration work; historical drill data; historical production data (at North Coldstream) and then align the VTEM model with our current drilling plans—it is very compelling.
Mr. Richards, I’m going to turn the controls over to you to give us an underground view of the Moss Lake Property, and have you share with us what has Market excited about the opportunity before us.
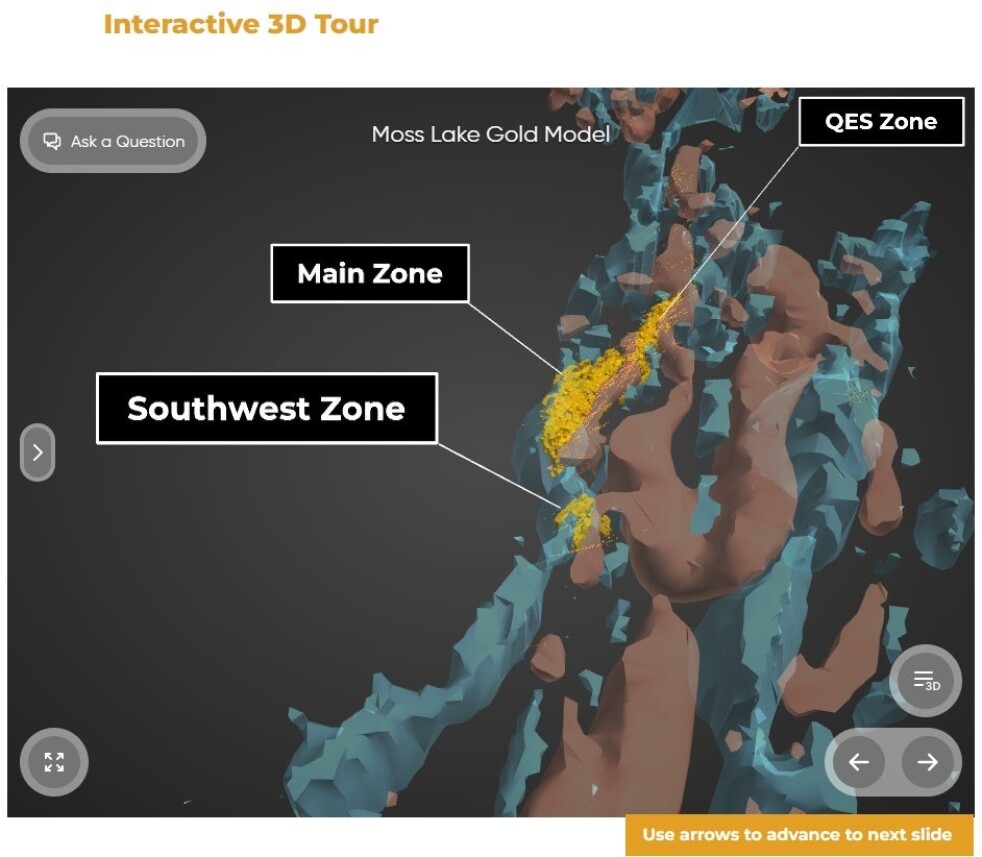
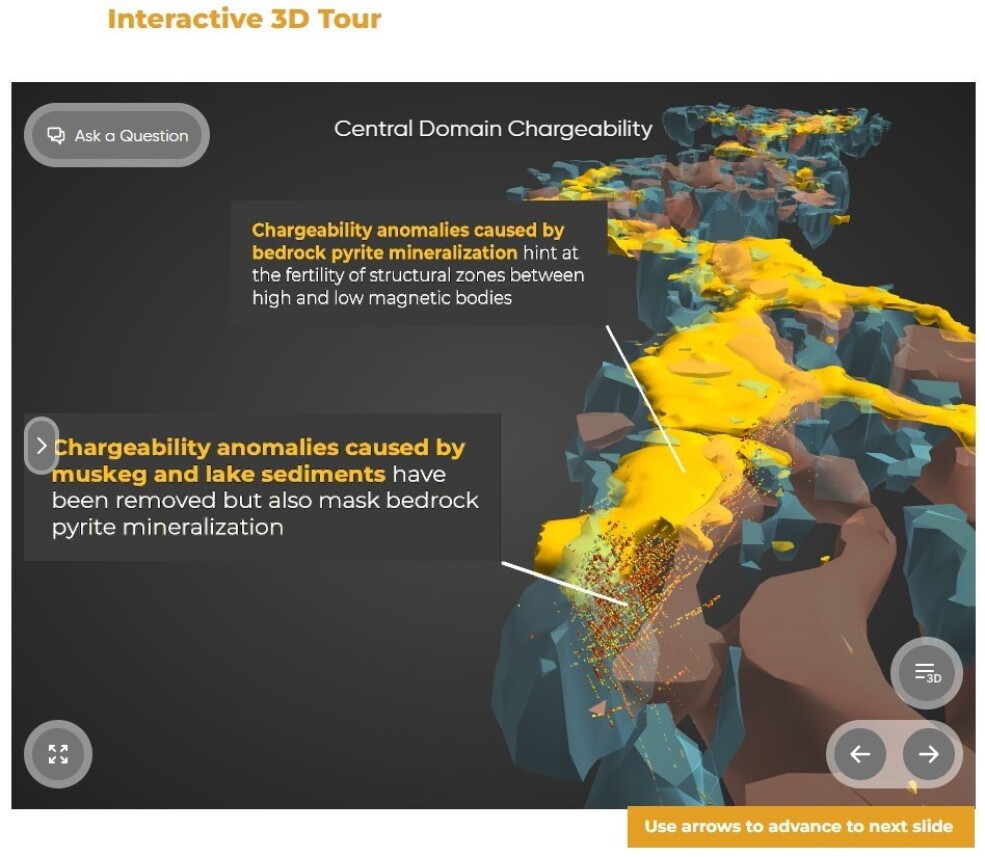
The 3D interactive model can be found on our website at this location: Technical Analysis: Goldshore’s VTEM Results Greatly Expand the Prospectivity (goldshoreresources.com)
The 3D model is contained within the VTEM interpretation press release, which describes everything going on over the entire property.
I must admit, there is an awful lot to unpack here, but if you take away nothing else from the VTEM interpretation, I want to leave people with this: This is our Moss Lake deposit that was used for the historical PEA—it contains 3.0M oz Au input, and is modeled in 3-dimensional view.
That same geophysical signature is found in 11 different areas along the strike of Moss Lake, over a distance of 12 km. The existing resource above has a strike length of 2.5km long, the projected resource can be extrapolated over a 12km strike. This area along the 12km strike also has known mineralization from historic drilling (all fairly similar to the Moss Lake resource)—which compounds the certainty of positive drill results when we get to drilling it.
This is incredibly meaningful, and illustrates the tremendous potential Moss Lake has (irrespective of the additional potential of Coldstream and Hamlin Lake) of becoming not only a Tier One Asset but resource growth way beyond this theoretical barrier the major mining companies claim as their starting point; which is 10M oz. Au eq.
Before we leave the Moss Lake Property, multilayered question, what is the next unanswered question for Goldshore Resources, when can we expect a response, what determines success, and what can we expect as far as news flow?
I think the questions I get asked the most are: “just how big can Moss Lake be?”, and “why has no one else explored this project or this region?”, and “what makes Goldshore so special to do this?”
I appreciate there are a lot of armchair cynics looking at (and understanding how) the Shebandowan Greenstone Belt can be a district-scale mining camp like Red Lake, Timmins, or Abitibi. However, many things have changed over the past 10 years to allow for these low-grade / bulk tonnage deposits to shine technically and economically.
Detour Lake (Kirkland Lake—now Agnico Eagle) is a great example of how to take a project like this through stages of development / resource growth / production capacity phases of expansion, to becoming a generational sized / scaled mine. We are trying to follow that path, in as methodical a way as possible, in the essence of creating and maximizing shareholder value.
What has changed?
Primarily the gold price, and the trading range that now binds the gold price between $1,800 and $2,200 / oz for the foreseeable future. This not only allows for the low grade / bulk tonnage deposits to shine, but because they are so geared economically to the gold price—when the gold price runs—the NPV of these styles of projects goes up hundreds of millions of dollars, with every $100 increase in the gold price.
So, our focus has always been treating this as a real project—de-risking the project geologically, metallurgically, environmentally, socially, and trying to put our collective experience of building mines to work, thinking forward about project nuances down the road, and addressing them now.
So just how big can Moss Lake be?
I don’t know—but what I do know is that we can visibly see a path to 10M oz and becoming a Tier One Asset.
Leaving the project site, let’s discuss some important topics germane to the projects . . . Is the Moss Lake Property 100% owned or do they have earn-in options?
Moss Lake property is 100% owned by Moss Lake Project Inc., which is 100% owned by Goldshore Resources. We own 100% of the project and Wesdome is a 22% shareholder in Goldshore Resources.
Are you fully permitted?
We are permitted to conduct the exploration activities for the next period / stage of development, but these are provincial permits required for land disturbances (water usage / trail building / road building, etc.) and other small permits as well.
There will however be a comprehensive permitting exercise down the road when this goes from feasibility study to financing / construction decision.
Is the ultimate goal for Goldshore Resources to build a mine or arbitrage?
The ultimate goal for Goldshore Resources is to build as large an economic resource as possible, and frame that resource into a viable / credible project through the PEA process. Where Goldshore takes it after this stage, is still to be defined—however, myself and Pete Flindell (VP Exploration) have built 3 mines together in our career; and several members of our Board and Advisory Board have also built mines and run single or multi-operation mining companies over their careers. So, we are well-positioned to take this in any direction where we think we will maximize the return for our shareholders.
I have always said that partnering with a mid-tier or major mining company that has the financial / technical / project / operating experience in these types of deposits is going to maximize the value for our shareholders (and provide a liquidity event) and that may well be the case. However, nothing is certain in this world, and we have to prepare the company for all possible outcomes.
We’ve discussed the good, let’s address the bad. What can go wrong and what are your actions plan to mitigate that wrong?
In mining, anything and everything can go wrong—and it usually does. Mining companies are classic for over-promising and under-delivering, and we are taking a conservative approach to deliver on promises and deliver on targets.
There are however a lot of challenges that delay the delivery of these targets (covid / supply chain disruptions / labor shortages etc.) but ultimately, we need to mitigate the risk of not executing in whatever / whichever way we need to do that. We need to execute—and we need to deliver!
I don’t see a large degree of traditional geological / metallurgical / other technical risk in the Moss Lake project, and with its extensive infrastructure availability, it is a large mine “waiting to be built.” However, getting through the necessary steps and stages has proven to be challenging due to the delays as listed above—and these factors continue to be delays in the steps and stages. My job is to keep the market close to all of this and to ensure that we are mitigating the risk(s) as much as possible over these next months of critical development for the Goldshore story.
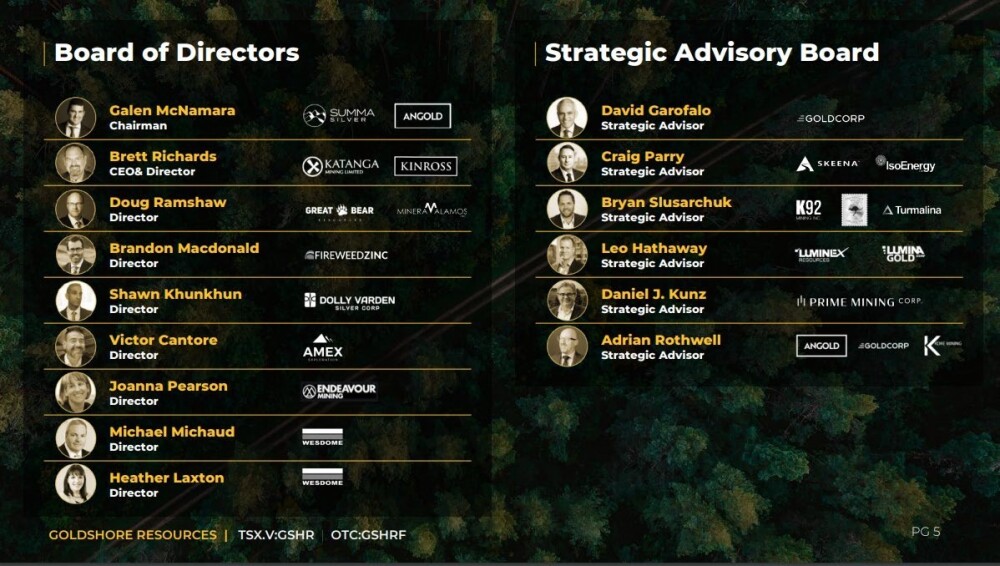
Switching gears . . . Let’s discuss the people responsible for increasing shareholder value. Mr. Richards, please introduce us to your Board of Directors and Management Team, and what skill sets do they bring to Goldshore Resources?
Yes—the Board and Board Advisory Team is comprised of first-rate people—first and foremost. These individuals bring a breadth of experience in capital markets, corporate governance, and corporate finance, and everyone has played a role in their careers in building large mining enterprises in some cases from small micro-cap starting points; to exponential multiples of first investment.
To highlight one individual and not name them all would be an injustice to the group, as they are all tremendous individuals with complementary and aggregated skill sets. I feel Goldshore might have the strongest Board and Advisory Board of any junior mining company in Canada today.
Who is Brett Richards and what makes him qualified for the task at hand?
Brett Richards—well, after 36 years in the mining and metals space, I have learned that you are never too old to learn new things, and just when you think you have figured it out—you realize there is more to learn. It is why I surround myself with exceptional people who are over-achievers in their own right. I can lead people—but one person cannot make a great company—exceptional teams make exceptional companies.
I have been fortunate enough to work for some great organizations and some of which I have cofounded. Since the 1980s—those companies have included: Co-Steel Inc., Kinross Gold, Katanga Mining, Avocet plc, Roxgold, Midnight Sun Mining, Octéa, African Thunder Platinum, and Richards Enterprises Inc. Most recently, and prior to coming to Goldshore, I worked for private equity clients such as Pala Investments, Gramercy, Genii, BNF, and the Carlyle Group.
I have a background in mechanical engineering, mineral economics, and a master’s in business administration-management engineering. However, the more important stuff is that I am a purveyor, collector, and drinker of fine red wine, and also an avid sports enthusiast.
How about boots on the ground, who do you have on your technical team?
Well, the key to the technical competency of the organization starts with our VP, Exploration—Pete Flindell. Pete and I have worked together on probably 10+ projects over the past 15+ years and he is a world-renowned senior geologist with experience in apx. 50 countries on every habitable continent.
Pete is a collaborative teacher—who loves to build teams; train teams; share ideas and experiences and those who have worked with Pete and under his direction, praise his geological leadership.
We have a team of about 5 senior geologists, 12 junior geologists, 12 geo techs, and about 30 drillers. Again, to mention one would do the rest of the team not mentioned an injustice, as we have built a great team of people on the ground.
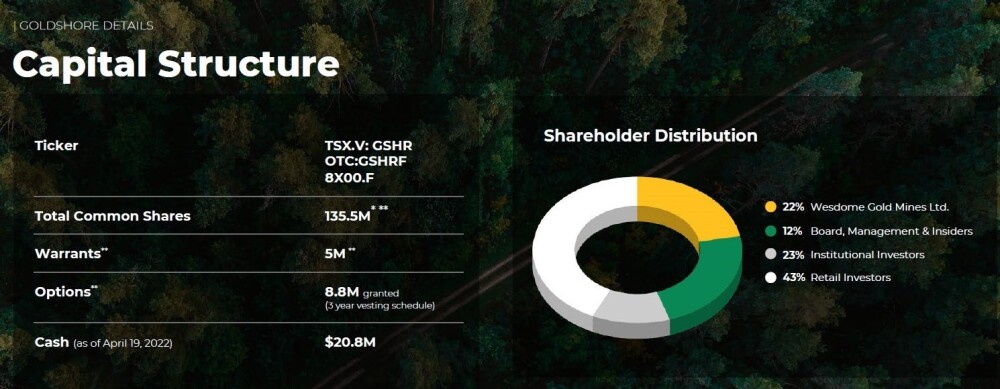
Let’s get into some numbers . . . Mr. Richards, please provide the capital structure for Goldshore Resources, current shares outstanding.
Sure—here are the following high-level numbers:
- 135M shares outstanding.
- 5M shares out fully diluted.
- $20M in the treasury.
Since we are covering numbers, how does Goldshore Resources compare with some of your peers?
As mentioned in the previous valuation discussion, we trade at a significant discount to our peers. As illustrated on the chart below, we are trading at $14/ounce today and the median of our peer group is around $40/ ounce.

How many cash and cash equivalents do you have?
CA$20M.
How much debt do you have?
CA$0.
What is your burn rate?
CA$2M per month (+/-).
What percentage of ownership does management have and who are the major shareholders?
- Management holds – 12%.
- Wesdome – 22%.
- Resources Fund (Europe) – 3%.
- Brett Richards – 3%.
- Galen McNamara – 3%.
What is the float?
- 135M shares outstanding.
- 5M shares out fully diluted.
- However, the free float is about $80M shares (as of April 19, 2022).
Are there any redundant assets on the books that we should know about?
No.
Are there any change in control fees, if yes, what is the compensation?
No—however, Wesdome has ROFR rights on a change of control.
Is management charging a consultant fee for any services?
No.
In closing . . . Sir, what keeps you up at night that we don’t know about?
In 2021, it was the pandemic and the impact it has had on the health (personal and mental health) of our employees and contractors—and now with that subsiding, I think the various macro-drivers of gold price (which present global crises and global instability): Russia/Ukraine crisis; hyper-inflation; the US and global economic policies—basically the headline of every newspaper is what keeps most of up at night. The world order feels like it is changing, and with that comes a lot of uncertainty about the future and that of our kids’ and grandkids’ future.
Last question what did I forget to ask? (This is an actual question; the floor is yours)
I think you have covered everything—but one final note to those looking at buying Goldshore Resources: “Why do you want to buy gold? Why do you want to buy gold equity? What moves the needle in gold equities and separates them from other gold equities? The answers to all of these questions are better served by holding Goldshore Resources than holding any other junior gold equity in the capital markets.
Safety, security, a hedge against inflation, a hedge against various global economic uncertainty, size, scale, resource potential, visibility to production . . . Goldshore Resources’ potential and its “Quest to 10M oz of Gold” will deliver the best result to all of those questions.
Please visit our website at https://goldshoreresources.com/.
Mr. Richards, it’s been a pleasure speaking with you today, wishing you Gold Shore Resources the absolute best sir.
My pleasure.
| Want to be the first to know about interesting Gold investment ideas? Sign up to receive the FREE Streetwise Reports’ newsletter. | Subscribe |
Disclosure:
Proven and Probable LLC receives financial compensation from its sponsors. The compensation is used to fund both sponsor-specific activities and general report activities, website, and general and administrative costs. Sponsor-specific activities may include aggregating content and publishing that content on the Proven and Probable website, creating and maintaining company landing pages, interviewing key management, posting a banner/billboard, and/or issuing press releases. The fees also cover the costs for Proven and Probable to publish sector-specific information on our site, and also to create content by interviewing experts in the sector. Proven and Probable LLC does accept stock options and cash as payment consolidation for sponsorship. Sponsor pages may be considered advertising for the purposes of 18 U.S.C. 1734.
The Information presented in Proven and Probable is provided for educational and informational purposes only, without any express or implied warranty of any kind, including warranties of accuracy, completeness, or fitness for any particular purpose. The Information contained in or provided from or through this forum is not intended to be and does not constitute financial advice, investment advice, trading advice, or any other advice. The Information on this forum and provided from or through this forum is general in nature and is not specific to you the User or anyone else. YOU SHOULD NOT MAKE ANY DECISION, FINANCIAL, INVESTMENTS, TRADING, OR OTHERWISE, BASED ON ANY OF THE INFORMATION PRESENTED ON THIS FORUM WITHOUT UNDERTAKING INDEPENDENT DUE DILIGENCE AND CONSULTATION WITH A PROFESSIONAL BROKER OR COMPETENT FINANCIAL ADVISOR. You understand that you are using any and all Information available on or through this forum AT YOUR OWN RISK.”
All Rights Reserved.
Images provided by the author.
1) Maurice Jackson: I, or members of my immediate household or family, own securities of the following companies mentioned in this article: Goldshore Resources Inc. I personally am, or members of my immediate household or family are, paid by the following companies mentioned in this article: Goldshore Resources Inc.
2) The following companies mentioned in this article are billboard sponsors of Streetwise Reports: None. Click here for important disclosures about sponsor fees.
3) Statements and opinions expressed are the opinions of the author and not of Streetwise Reports or its officers. The author is wholly responsible for the validity of the statements. The author was not paid by Streetwise Reports for this article. Streetwise Reports was not paid by the author to publish or syndicate this article. Streetwise Reports requires contributing authors to disclose any shareholdings in, or economic relationships with, companies that they write about. Streetwise Reports relies upon the authors to accurately provide this information and Streetwise Reports has no means of verifying its accuracy.
4) This article does not constitute investment advice. Each reader is encouraged to consult with his or her individual financial professional and any action a reader takes as a result of information presented here is his or her own responsibility. By opening this page, each reader accepts and agrees to Streetwise Reports’ terms of use and full legal disclaimer. This article is not a solicitation for investment. Streetwise Reports does not render general or specific investment advice and the information on Streetwise Reports should not be considered a recommendation to buy or sell any security. Streetwise Reports does not endorse or recommend the business, products, services or securities of any company mentioned on Streetwise Reports.
5) From time to time, Streetwise Reports LLC and its directors, officers, employees or members of their families, as well as persons interviewed for articles and interviews on the site, may have a long or short position in securities mentioned. Directors, officers, employees or members of their immediate families are prohibited from making purchases and/or sales of those securities in the open market or otherwise from the time of the decision to publish an article until three business days after the publication of the article. The foregoing prohibition does not apply to articles that in substance only restate previously published company releases.