The Best Video on Why and When to Buy and Sell Physical Precious Metals:
I’m a licensed broker for Miles Franklin Precious Metals Investments, The Only Online Dealer that is Licensed and Bonded Period! Where we provide unlimited options to expand your precious metals portfolio, from:
Shear Domain at the Moss Deposit increases to 3.35Moz at 1.84 g/t Au within 56.5Mt
Vancouver, British Columbia–(Newsfile Corp. – May 8, 2023) – Goldshore Resources Inc. (TSXV: GSHR) (OTCQB: GSHRF) (FSE: 8X00) (“Goldshore” or the “Company“) is pleased to announce an updated mineral resource estimate (the “MossMRE“) for the Moss deposit (“Moss” or the “Moss Deposit“) and a maiden mineral resource estimate (the “East Coldstream MRE” and, together with the Moss MRE, the “MRE“) for the East Coldstream deposit (“East Coldstream” or the “East Coldstream Deposit“), both located at its 100%-owned Moss Gold Project in Northwest Ontario, Canada (the “Moss Gold Project” or the “Project“).
Moss Gold Project global inferred resource grows 44% to 6.00Moz at 1.02 g/t, within 183.6Mt.
Moss MRE grows with 24% more contained gold ounces and 32% more tonnes from 4.17Moz Au in 121.7Mt (November 2022 mineral resource estimate) to 5.42Moz Au at 1.03 g/t Au within 163.6Mt (open pit and underground).
The shear domain has increased in contained metal and tonnage from the November 2022 mineral resource estimate by 52% and 63%, respectively, to 3.35M ozAu at 1.84 g/t Au within 56.5Mt (open pit only).
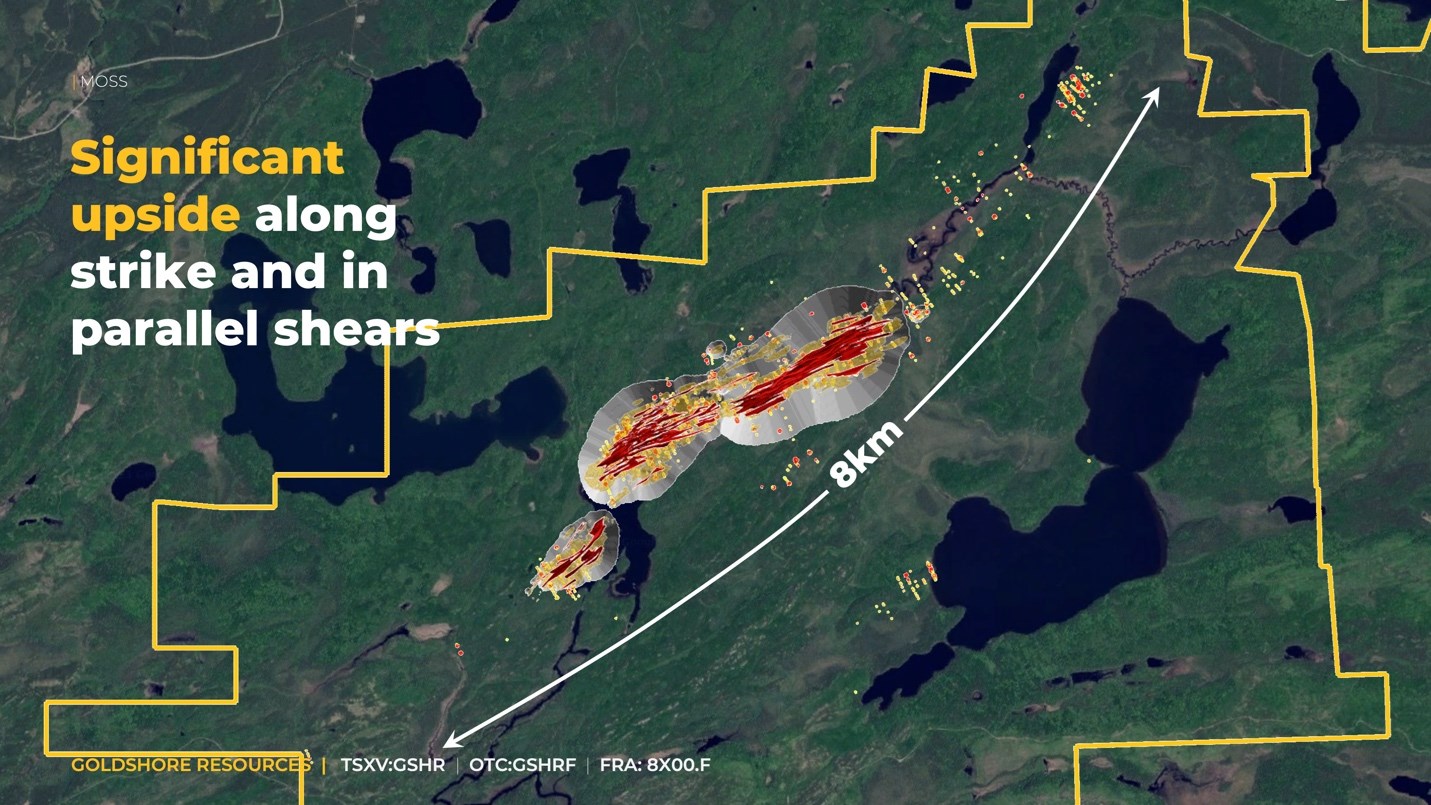
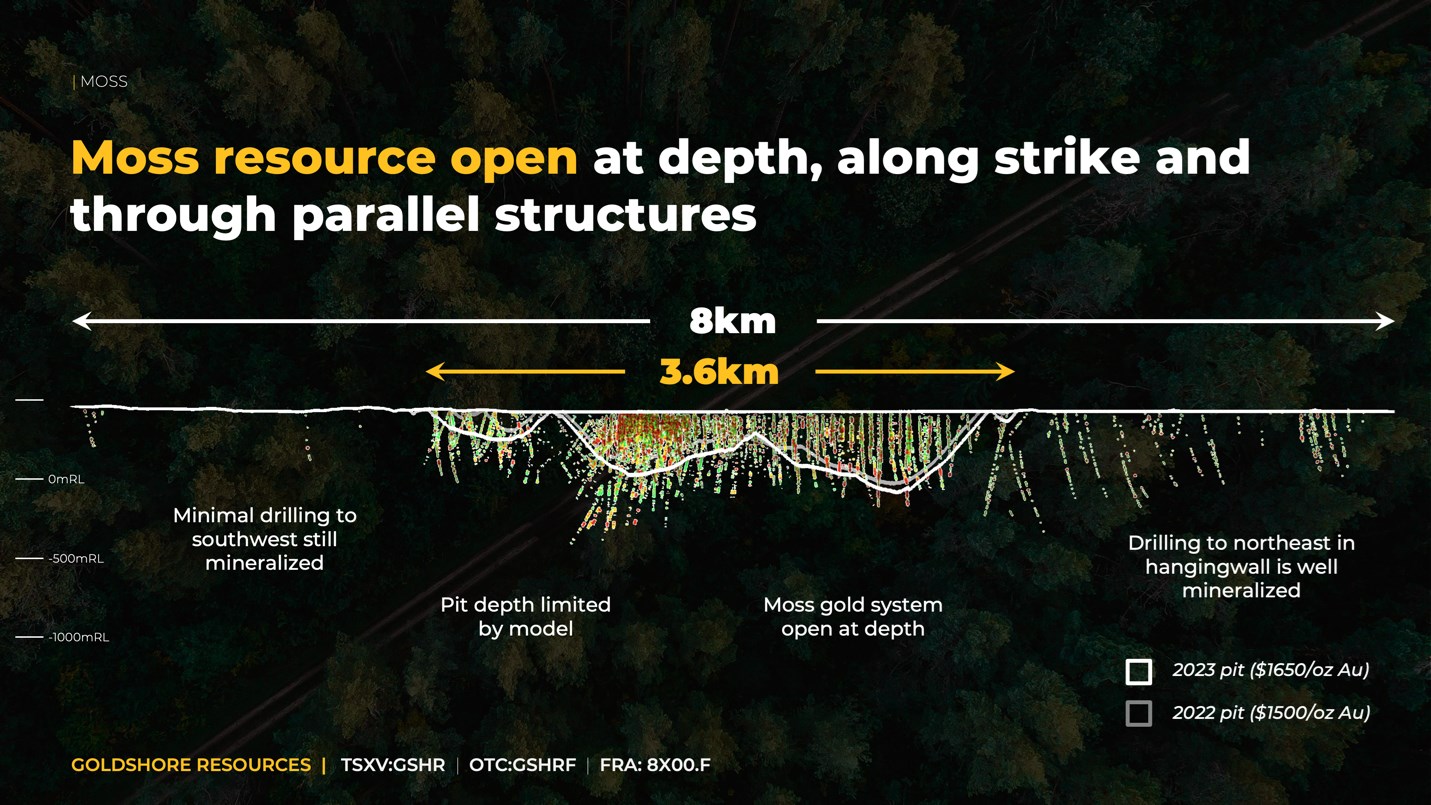
There is clear expansion potential over the 8km-long belt through strike extensions (in both directions) and parallel shears where gold mineralization has been intersected but is sparsely drilled.
East Coldstream MRE introduced at 580Koz at 0.91 g/t Au in 20.0Mt (open pit and underground).
Implied stripping ratios are 5.2:1 for Moss and 6.4:1 for East Coldstream.
This resource increase implied by the Moss Gold Project demonstratesthe scale of the project and the opportunity for a high-grade open-pit gold project.
Work is well underway on studies to support a preliminary economic assessment (“PEA”) planned for later this year.
The Moss Gold Project is host to 29 additional targets over a 35 km trend, which the Company continues to evaluate, and prioritize for future drill campaigns.
The Company has incurred discovery costs of approximately CAD$10 per ounce of inferred Au resource (all-in) including acquisition costs and overheads. This can also be measured as approximately 76 ounces Au per meter drilled (all-in costs included) in the 78,000 meters drilled to date.
Summary of the MRE
Open-Pit and Underground Constrained Inferred MRE for the Moss Deposit and East Coldstream Deposit with an Effective Date of May 5, 2023:
Moss Open Pit
Inferred Resources
Tonnes
Grade
Contained Metal
(Domains)
(Mt)
(g/t Au)
(Moz Au)
Shear
56.5
1.84
3.35
Intrusion
104.5
0.55
1.83
Total
161.0
1.00
5.18
Moss Underground
Inferred Resources
Tonnes
Grade
Contained Metal
(Domains)
(Mt)
(g/t Au)
(Moz Au)
All
2.6
2.90
0.24
Total
2.6
2.90
0.24
East Coldstream Open Pit
Inferred Resources
Tonnes
Grade
Contained Metal
(Domains)
(Mt)
(g/t Au
(Moz Au)
All
19.8
0.89
0.57
Total
19.8
0.89
0.57
East Coldstream Underground
Inferred Resources
Tonnes
Grade
Contained Metal
(Domains)
(Mt)
(g/t Au
(Moz Au)
All
0.2
2.24
0.01
Total
0.2
2.24
0.01
Grand Total
183.6
1.02
6.00
Note: Based on a US$1,650 per ounce gold price and economic cut-off grade of 0.35 g/t Au for open pit and 2.07 g/t Au and 2.00 g/t Au for underground resources (Moss and East Coldstream, respectively). Please review “Notes to Accompany Moss MRE” and “Notes to Accompany East Coldstream MRE” for additional information.
President and CEO Brett Richards stated: “This announcement is an important milestone for Goldshore and the Moss Gold Project. We are pleased with the results of the MRE, as it illustrates the size, scale, and potential of the Moss Gold Project that we have been communicating for the past many months. This important step in the development of the Project will now shift to commencing a PEA by putting a mining project around the resource with the goal of understanding the economic outputs.
“Today’s MRE is a first step towards understanding a potential first phase of the Moss Gold Project, as we believe it represents only a small portion of the mineralization or potential mineralization on our land package. We still have 29 additional targets to drill test, including several gold targets, but also 4 interesting base metal and battery mineral targets.
“We will now start to run scenario planning for the PEA with respect to how we construct a Phase 1 project of a clearly larger mineral resource, while investigating various leaching methodologies, including heap leach. When we have a clear picture of the scope of the PEA, we will guide the market as to when we believe the results of it will be available to the market.”
Notes to Accompany Moss MRE
Numbers have been rounded to reflect the precision of an inferred mineral resource estimate. Totals may vary due to rounding.
Estimation has been completed within the two separate reported geological domains: a higher-grade shear domain which occurs within a larger lower-grade intrusive domain; modelling of domain boundaries has considered both geology and grade.
Gold cut-off for open pit has been calculated based on a gold price of US$1,650/oz, mining costs of US$2.70 per tonne, processing costs of US$12.50 per tonne, and mine-site administration costs of US$2.50 per tonne processed. Metallurgical recoveries of 92.5% are based on prior metallurgical test work.
Gold cut-off for underground MSO shapes have been calculated based on a gold price of US$1,650/oz, mining costs of US$86.25 per tonne, processing costs of US$12.50 per tonne, and mine-site administration costs of US$2.50 per tonne processed. Metallurgical recoveries of 92.5% are based on prior metallurgical test work.
An economic cut-off grade of 0.35 g/t Au was applied to mineralized rock in the optimized open pit for processing determination.
Mineral Resources conform to NI 43-101, and the 2019 CIM Estimation of Mineral Resources & Mineral Reserves Best Practice Guidelines and 2014 CIM Definition Standards for Mineral Resources & Mineral Reserves.
Neither the qualified person nor the Company are aware of any environmental, permitting, legal, title, taxation, socio-economic, marketing, or political factors that might materially affect the Moss MRE.
Mineral resources are not mineral reserves as they do not have demonstrated economic viability. The quantity and grade of reported inferred resources in the MRE are uncertain in nature and there has been insufficient exploration to define these inferred resources as indicated and/or measured resources. The Company will continue exploration intended to upgrade the inferred mineral resources to indicated mineral resources.
Notes to Accompany East Coldstream MRE
Numbers have been rounded to reflect the precision of the inferred mineral resource estimates. Totals may vary due to rounding.
Estimation has been completed within two geological zones: a strongly altered higher-grade shear zone surrounded by a lower-grade domain; modelling of domain boundaries has considered both geology and grade.
Gold cut-off has been calculated based on a gold price of US$1,650/oz, mining costs of US$2.70 per tonne, processing costs of US$12.50 per tonne, and mine-site administration costs of US$2.50 per tonne processed. Metallurgical recoveries of 96.5% are based on prior metallurgical test work.
Gold cut-off for underground MSO shapes have been calculated based on a gold price of US$1,650/oz, mining costs of US$86.25 per tonne, processing costs of US$12.50 per tonne, and mine-site administration costs of US$2.50 per tonne processed. Metallurgical recoveries of 96.5% are based on prior metallurgical test work.
An economic cut-off grade of 0.35 g/t Au was applied to mineralized rock in the optimized open pit for processing determination.
Mineral Resources conform to NI 43-101, and the 2019 CIM Estimation of Mineral Resources & Mineral Reserves Best Practice Guidelines and 2014 CIM Definition Standards for Mineral Resources & Mineral Reserves.
Neither the qualified person nor the Company are aware of any environmental, permitting, legal, title, taxation, socio-economic, marketing, or political factors that might materially affect the East Coldstream MRE.
Mineral resources are not mineral reserves as they do not have demonstrated economic viability. The quantity and grade of reported inferred resources in the East Coldstream MRE are uncertain in nature and there has been insufficient exploration to define these inferred resources as Indicated and/or measured resources. The Company will continue exploration intended to upgrade the inferred mineral resources to indicated mineral resources.
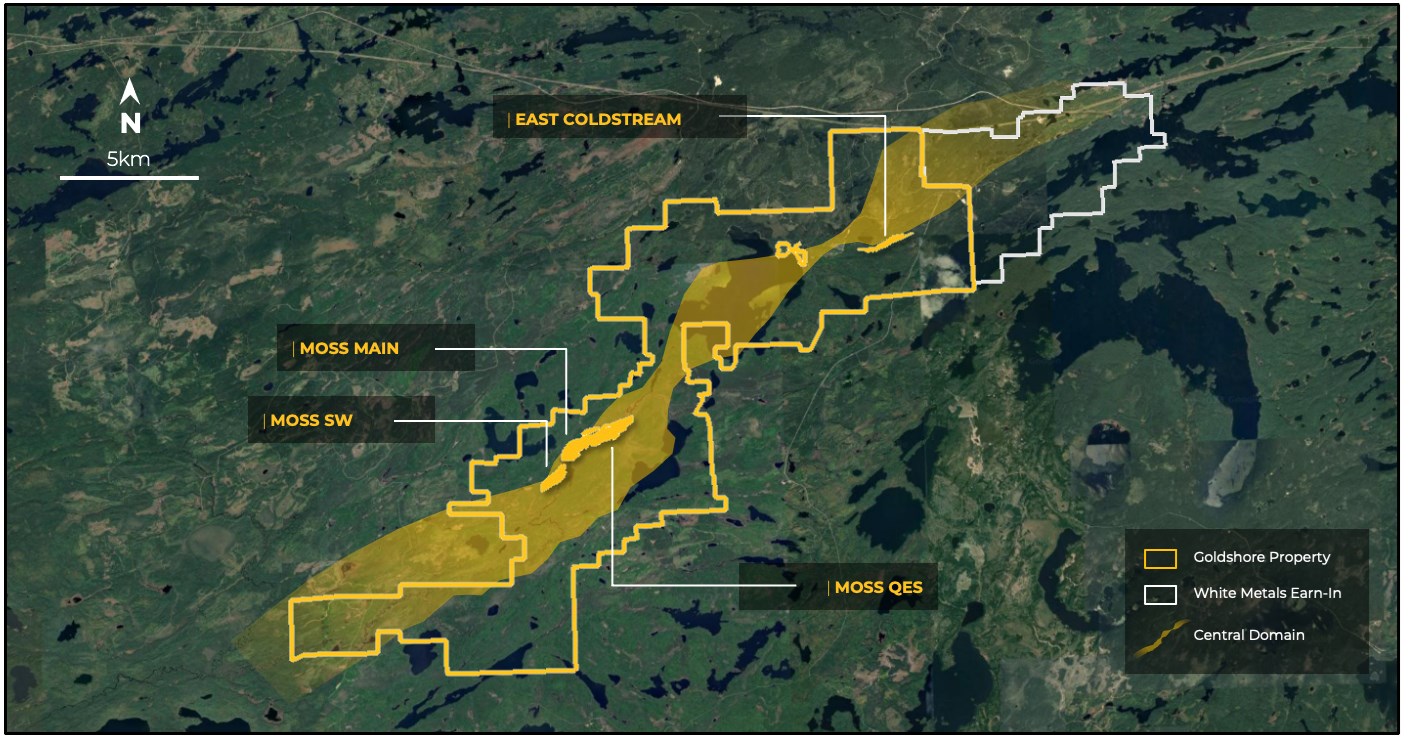
Figure 1: Location of Moss Deposit and East Coldstream Deposit in the Moss Gold Project
Details of the MRE will be provided in a technical report with an effective date of May 5, 2023, prepared in accordance with National Instrument 43-101 (“NI 43-101“) standards, which will be filed under the Company’s SEDAR profile within 45 days of this news release. The MRE was prepared by independent mining consulting firm CSA Global Canada (“CSA Global“), a division of ERM Consultants Canada Ltd., in accordance with the Canadian Institute of Mining, Metallurgy and Petroleum (“CIM“) Definition Standards on Mineral Resources and Reserves (2014).
Additional Exploration Potential
The modelled shear and intrusion domains extend to much greater depth below the optimized open pit constraining the reported Moss MRE. The shears are also open along strike, beyond the modelled strike length of 3.6 km. Historical drilling has intercepted gold mineralization over a total strike length of 8 km, which has been a focus of Goldshore’s summer soil geochemistry and structural mapping programs. Furthermore, there remains potential for additional parallel shears with gold mineralization in historical drill holes 500 m to the southeast of the Moss Deposit.
Figure 2: Upside along strike and through parallel shears at the Moss Deposit
The Moss Deposit is a structurally controlled gold deposit within the greenstone terrain of the Archean Superior Province. Mineralization is localized where the major NE-trending Wawiag Fault Zone cuts a dioritic to granodioritic intrusion complex. The deposit is defined by a series of anastomosing centimeter- to meter-scale NE-trending shear zones carrying higher-grade gold mineralization, and lower-grade gold mineralization associated with weaker shearing and a more brittle-style deformation and veining in the intrusion rock mass and adjacent wall rocks between the shear zones. Mineralization is associated with pyrite, sericite and chlorite alteration and millimeter- to centimeter-scale irregular quartz-carbonate veinlets.
Detailed geological logging and multi-element geochemical analysis of drill core from 120 new holes total 68,802m from the 2021-23 drilling has supported modelling of discrete shear domains within the larger altered and variably mineralized intrusion domain, which includes adjacent volcanic wall rocks. The shear domains have a different higher-grade gold population to the low-grade intrusion domain and these domains have been estimated separately using different search parameters. Importantly, this allows a more accurate representation of the true grade variability within the deposit than has been achieved in previous estimates.
CSA Global was provided with the wireframes for resource estimation by Goldshore. Goldshore modelled the shear zones domain using a combination of geological features, including core orientation data, and raw assay values above 1 g/t Au using explicit digitizing methods in Micromine 3D geological modelling software. CSA Global modelled the intrusion domain using implicit modelling techniques in Leapfrog using a cut-off grade of 0.20 g/t Au in 15-meter downhole composites. Statistical and geostatistical assessment of 1 m composites confirmed that the shear domains should be estimated within hard boundaries separating them from the intrusion domain. Statistical analysis was used to determine high-grade capping for each shear zone wireframe and ranged from 30 to 60 g/t Au.
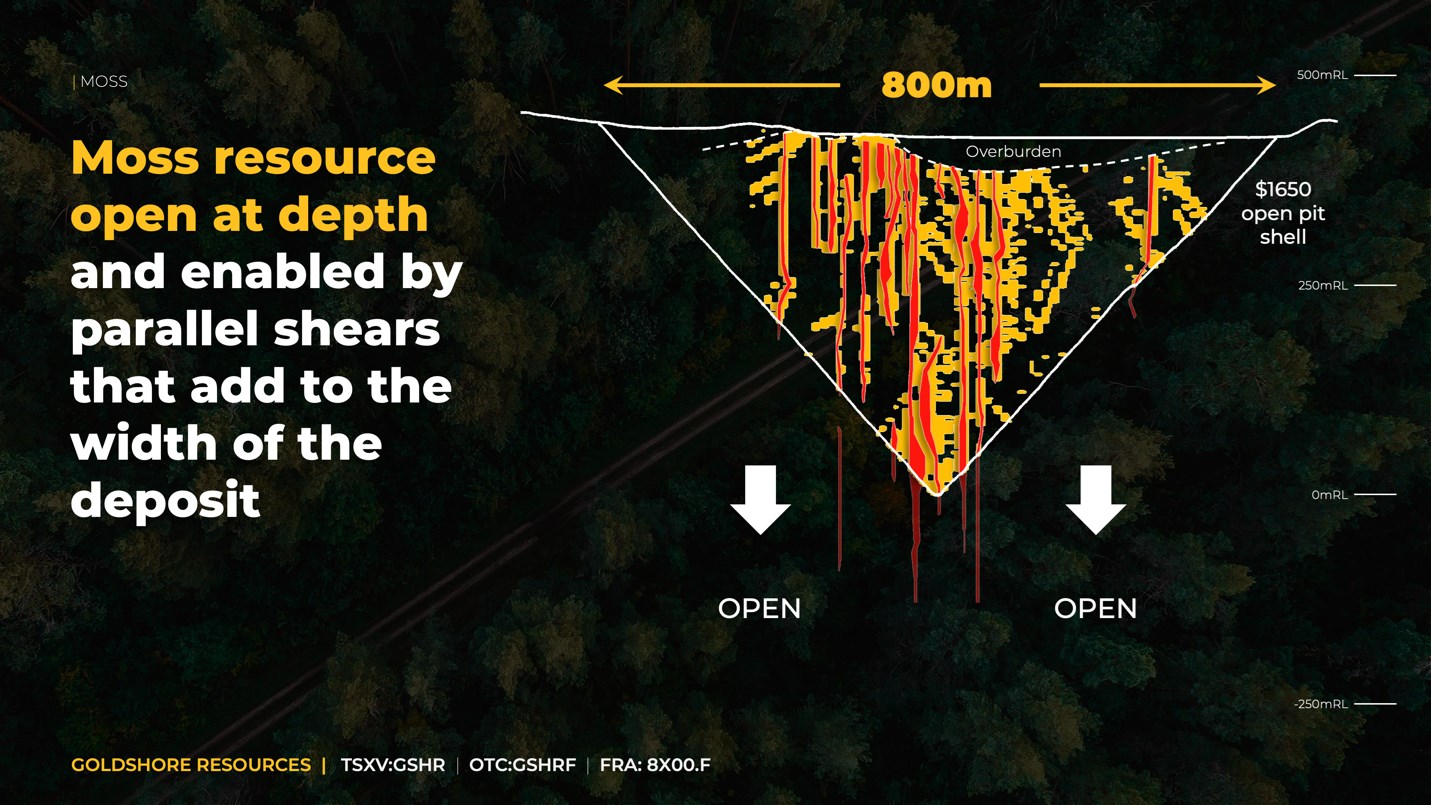
The Moss MRE was estimated with a block size of 9 x 9 x 3 m utilizing subblocks and constrained within wireframes with a minimum width of 3 x 3 x 1 m. Gold content was estimated using ordinary kriging methods using dynamic anisotropy variogram models. Mineral resources are presented as undiluted and in situ. The historical underground voids from Noranda’s 1980’s exploration program have been removed from the geological model.
Figure 4: Moss Deposit resource model within the US$1650 pit shell
The East Coldstream Deposit is a structurally controlled gold deposit located approximately 15 km northeast of the Moss Deposit within the Moss Gold Project area. The East Coldstream Deposit’s mineralized zones are located on the south margin of a shear zone which separates a gabbroic intrusion to the north from a mafic-intermediate volcanic suite to the south. Mineralization is found within sheared volcanic units, proximal to sills of quartz and quartz-feldspar porphyries and distinctive, brick-red syenites. The mineralized zones show silica, carbonate, and hematite alteration. Mineralization consists of fine disseminations of pyrite and lesser chalcopyrite throughout the silica-hematite zones as well as within quartz-carbonate veinlets. Iron carbonate is present in areas proximal to strong silicification. The two main mineralized zones have been cut by a north-south-trending diabase dike.
Sixteen new drill holes, totaling 7,973 m, were drilled in the East Coldstream Deposit to gather the required geological understanding of the deposit. Mineralization was modeled by CSA Global guided by alteration wireframes provided by Goldshore. Implicit modelling techniques were utilized in wireframing a NE-trending shear zones carrying higher-grade gold mineralization which is subdivided into two parallel domains (Z-2 and Z-4), and two satellite subparallel lenses (Z-1 and Z-3). A lower grade wireframe was developed surrounding the shear zone domains representing mineralization associated with more brittle-style veining in the felsic to intermediate metavolcanic rocks, gabbros, and porphyries between the main shear zones.
Exploratory data analysis was used to determine high-grade capping for composites of two of the shear zones, with top cuts ranging from 13 to 15 g/t Au. The East Coldstream MRE was estimated with a block size of 6 x 6 x 6 m utilizing sub-blocks and constrained within wireframes with a minimum width of 3 x 3 x 3 m. Gold content was estimated using ordinary kriging methods using dynamic anisotropy and informed by variogram models. Mineral Resources are presented as undiluted and in situ.
Figure 6: East Coldstream Deposit resource within the US$1650 open pit shell
The Moss Deposit has been evaluated by several diamond drill programs since the 1970s and earlier. The greatest number of drill holes were completed between 1986 and early 1992 by Tandem/Storimin and Noranda Inc. (311 drill holes for 86,196 meters). A smaller drilling program in 2008 served to validate the older data and lead to the completion of the historical resource estimate by Moss Gold Mines Ltd. in 2013.
The East Coldstream Deposit has been evaluated by several diamond drill programs since 1987. Most of the historic drilling was conducted between 2010 and 2011 by Foundation Resources who completed total of 66 diamond drillholes in the Coldstream deposit, totaling 16,988 m.
There are little documented QA/QC procedures or data available for programs prior to 2008.
The ongoing Goldshore drilling program utilizes full industry-standard survey control and QAQC programs and is designed to systematically redrill the deposits and validate as much of the historical drilling as possible through collar surveys, re-logging, and re-sampling.
Mineral Resource Classification
The Moss MRE has been classified as an inferred mineral resource. This resource classification reflects the fact that much of the drill hole data used for the resource estimate is historical, and no QA/QC data or reports exist for the majority of these drill holes. Statistical assessment of historical data and recent data provided some support for the historical data, but also included some inconsistencies. Goldshore’s planned program of infill and confirmatory drilling is expected to support classification of indicated mineral resource in subsequent mineral resource updates.
Reasonable Prospects for Eventual Economic Extraction
To support reasonable prospects for eventual economic extraction for the MRE, CSA Global used the estimated block model to generate an optimized open pit using Datamine NPV Scheduler software and the following assumptions: a gold price of US$1,650/oz, plant recovery of 92.5% and 96.5% for Moss Deposit and the East Coldstream Deposit, respectively; processing costs of US$12.50/tonne, mine-site general and administration costs of US$2.50/tonne processed, mining costs of US$2.70/tonne moved, and an overall pit slope angle of 50 degrees. NPV Scheduler Software is widely used by mining engineers to apply the Lerchs-Grossman algorithm to block models in order to generate optimized pit shells upon which economic open pit mine designs may be based.
The MRE is are constrained within the selected optimized pit shells which reach a maximum depth of approximately 450m and 250m in the Moss Deposit and East Coldstream Deposit, respectively.
Next Steps
In late 2022, Goldshore commenced an extensive program of relogging and resampling of all historical drill holes whose collars have been located and accurately surveyed. Where possible, these drill holes are also being surveyed using modern downhole surveying equipment. Resampling of historical drill core is ongoing, although most core blocks are now illegible rendering resampling impossible.
Pete Flindell, VP Exploration for Goldshore, said, “This MRE has highlighted the larger scale of gold mineralization on the Moss Gold Project. It remains conservative in many areas because of the concerns over historical drill data and we look forward to updating the quality and quantity of the mineral resource inventory following a comprehensive infill drill program. In the meantime, our field programs continue to develop our better exploration targets with the potential to add significantly to our resource base. At the same time, we will be working on the PEA, which will optimize and evaluate the many mining and milling options available to us. These include a high recovery flotation-regrind-leach mill process, potential heap leaching of low-grade mineralization and mining at different scales to maximize gold grades fed to the mill.“
Qualified Person Statements
Dr. Matthew Field (Pr. Sci. Nat), Manager – Resources at CSA Global is an independent “qualified person” under NI 43-101 and responsible for the MRE. Dr. Field has prepared and approved the scientific and technical information related to the MRE contained in this news release.
Peter Flindell, P.Geo., MAusIMM, MAIG, Vice President – Exploration of the Company, and a “qualified person” under NI 43-101 has also reviewed and approved the scientific and technical information contained in this news release.
About Goldshore
Goldshore is an emerging junior gold development company, and owns the Moss Gold Project located in Ontario. Wesdome Gold Mines Ltd. is currently a large shareholder of Goldshore. Supported by an industry-leading management group, board of directors and advisory board, Goldshore is positioned to advance the Moss Gold Project through the next stages of exploration and development.
Neither the TSXV nor its Regulation Services Provider (as that term is defined in the policies of the TSXV) accepts responsibility for the adequacy or accuracy of this release.
For More Information – Please Contact:
Brett A. Richards President, Chief Executive Officer and Director Goldshore Resources Inc.
This news release contains statements that constitute “forward-looking statements.” Such forward looking statements involve known and unknown risks, uncertainties and other factors that may cause the Company’s actual results, performance or achievements, or developments to differ materially from the anticipated results, performance or achievements expressed or implied by such forward-looking statements. Forward looking statements are statements that are not historical facts and are generally, but not always, identified by the words “expects,” “plans,” “anticipates,” “believes,” “intends,” “estimates,” “projects,” “potential” and similar expressions, or that events or conditions “will,” “would,” “may,” “could” or “should” occur.
Forward-looking statements in this news release include, among others, statements relating to expectations regarding the exploration and development of the Project, the filing of a technical report supporting the MRE, commencement of a preliminary economic assessment and prefeasibility study, and other statements that are not historical facts. By their nature, forward-looking statements involve known and unknown risks, uncertainties and other factors which may cause our actual results, performance or achievements, or other future events, to be materially different from any future results, performance or achievements expressed or implied by such forward-looking statements. Such factors and risks include, among others: the Company may require additional financing from time to time in order to continue its operations which may not be available when needed or on acceptable terms and conditions acceptable; compliance with extensive government regulation; domestic and foreign laws and regulations could adversely affect the Company’s business and results of operations; the stock markets have experienced volatility that often has been unrelated to the performance of companies and these fluctuations may adversely affect the price of the Company’s securities, regardless of its operating performance; the impact of COVID-19; the ongoing military conflict in Ukraine; and other risk factors outlined in the Company’s public disclosure documents.
The forward-looking information contained in this news release represents the expectations of the Company as of the date of this news release and, accordingly, is subject to change after such date. Readers should not place undue importance on forward-looking information and should not rely upon this information as of any other date. The Company undertakes no obligation to update these forward-looking statements in the event that management’s beliefs, estimates or opinions, or other factors, should change.
NOT FOR DISTRIBUTION TO THE U.S. NEWSWIRE OR FOR DISSEMINATION IN THE UNITED STATES
Vancouver, British Columbia, May 08, 2023 (GLOBE NEWSWIRE) — Terra Balcanica Resources Corp. (“Terra” or the “Company”) (CSE:TERA; FRA:UB1) is pleased to announce positive assay results from surface rock chip and soil sampling at its 80.4 km2 Ceovishte license in southern Serbia and closing of the 1st tranche of the previously announced non-brokered private placement financing of units (the ”Units”) for gross proceeds of $404,650 (the “Offering”).
Highlights
Surface rock sample include concentrations as high as 53.5 g/t Au, 78.6 g/t Ag and 2.47 % Cu with up to 0.39% Co and 0.45% Bi (Table 1);
> 900 m strike length of Au-Ag-As-Bi-Cu-Te anomalism in soil geochemistry defines new target, with soil assays returning up to 2.42 g/t Au (Figure 2);
Mineralization is controlled by potassic altered diorites hosting quartz-chalcopyrite veins withsecondary copper mineralogy at surface (Figure 3) and a gold-bismuth-cobalt rich epithermal assemblage;
Drill-ready with both porphyry and epithermal mineralization visible at collar locations.
Terra Balcanica CEO, Dr. Aleksandar Mišković, commented:“Detailed prospecting, rock chip and soil sampling at our Serbian Ceovishte licence not only confirmed the existence of a sizable hydrothermal system responsible for multi-ounce gold assays at surface near the Medjurečje locality but also defined a new, 900-m-wide, topographically depressed, semi-circular gold-silver-coppersoil anomaly northeast of the high-grade Au zone that is characterized by potassic altered andesitesinterpreting by Terra’s technical team to represent a previously neglected porphyry target. This confirms the potential of our Serbian assets and represents a significant diversification of the Company’s polymetallic portfolio already defined by our Viogor Zanik project. It sets the stage for drilling of the shallow high grade gold targetlater this year.”
The Ceovishte license totals over 80 km2 of highly prospective land for gold and copper exploration in the historic Raska mining district of southern Serbia (Figure1). The license area drapes southern slopes of the Golija Mountain, a part of the well-known Kopaonik metallogenic zone. This area features the Kiževak and Sastavci Pb-Zn-Ag mines including the Karadak deposit, all owned by Adriatic Metals plc. The historical Yugoslav GKZ, non-NI 43-101 compliant resource estimates for Kiževak is 3.9 Mt of ore grading 3.92 % Zn, 2.15 % Pb and 31 g/t Ag categorized according to the Yugoslav A+B+C1 resource nomenclature (www.adriaticmetals-serbia.com/our-projects/adriatic-metals-serbia-sastavci). The Raska mining district also holds the Rudnica Cu-Au porphyry target and is a northerly extension of the partially exploited, world class Trepča Pb-Zn-Ag skarn deposit of the norther Serbian province of Kosovo. Trepča features a non-NI 43-101 compliant resource of 60.5 Mt of ore grading over 8.0 % Pb+Zn and >159 Moz of Ag.
Figure 1. Geological map of the Ceovishte license area in southern Serbia. The black rectangle labelled Figure 2 is Terra’s primary area of interest within the license. It encapsulates Au-Cu mineralized Neogene volcanic rocks which intruded an ultramafic country rock of the West Vardar Ophiolite. Previous operators conducted work in the south of the Ceovishte license and overlooked the Au-Cu potential of the north where Terra has conducted a successful soil and rock chip sampling campaign and is planning a maiden drilling program in early Q3 of 2023 (click here to view image).
Figure 2. Map displaying Au in soil (ppb), and anomalous Au-Ag-As-Bi-Cu-Te signature.Sampling verifies the location of known mineralization and reveals > 900 m strike length of new prospective ground open to the NE. Rock sample IDs can be correlated with results in Table 1. The drill target is labelled where rock chips return up to 53.5 g/t Au and 1.45 % Cu. Note the location of anomalous Au in soil forming an arcuate pattern around the depressed centre, interpreted as possible concentric fractures around a porphyry intrusive which crops out in the south and northwest. (WGS84/UTM Zone 34N) (click here to view image).
Geology and Mineralization The Company is focussed on exploring the overlooked Au-Ag-Cu (Bi-Co) occurrences in the northern extents of the license where Neogene intrusive rocks of intermediate composition are emplaced within ultramafic rocks of the west Vardar Ophiolite Belt. Field observations and microscopy confirms biotite-magnetite-k-feldspar potassic alteration within the diorites, which are observed controlling the distribution of mineralization and are thus inferred as the causative intrusion and target for further exploration. Intrusive contacts and vein-hosted sulphides in the south dip shallowly to the NNE below ultramafic cover into an annular topography low.
Both hypogene sulphide mineralization and supergene oxide zones are present at Ceovishte and returned very encouraging assay results of a well-endowed Au-Ag-Cu system. Quartz-chalcopyrite veins are partially oxidised at surface producing a mixture of malachite, azurite and tenorite (Figure 3) and occur within the same outcrops as quartz-arsenopyrite-bismuthinite veins. Chalcopyrite is also observed finely disseminated within the potassic altered intrusives. Gossans and vuggy silica host the highest Au values up to 53.5 g/t.
Figure 3. Macroscopically observed copper mineralization in samples 103281 and 103276 which returned 1.45 % and 2.47 % Cu, respectively. Mineralization is vein-hosted within potassic altered diorites and comprises quartz, chalcopyrite, malachite, azurite and tenorite(click here to view image). Mineralized rock samples also return high bismuth and cobalt, which may have been stripped from the ultramafic country rocks by hydrothermal fluids and re-precipitated within the epithermal veins. Ceovishte therefore has characteristics of the 5-element vein (Ag-Bi-Co-Ni-As) style of mineralization.
Sample
Easting
Northing
Au (g/t)
Ag (g/t)
Bi (ppm)
Cu (%)
Co (ppm)
100851
476500
4815182
53.5
8.7
4490
0.03
12
100838
475554
4816186
0.19
78.6
2
0.01
71
100839
476417
4815188
11.0
10.1
3570
0.14
805
103273
476383
4815204
6.56
1.2
299
0.01
1300
103271
476335
4815157
0.48
1.8
20
0.12
21
103282
476479
4815173
10.95
0.82
299
0.02
3940
103264
476602
4815182
0.09
18.9
6
0.01
5.7
103267
475606
4816196
0.02
0.69
42
0.04
9
103262
475628
4816084
3.09
11.8
480
0.03
336
103269
475605
4816158
0.10
1.7
0.4
–
9
103276
476179
4815987
0.05
10.8
20
2.47
13
103279
476376
4815128
0.39
2.16
5
0.01
27
103280
476383
4815133
3.28
1.42
224
0.01
145
103277
476189
4815997
2.2
0.5
69
0.01
88
103281
476514
4815189
0.16
21.5
144
1.45
50
Table 1.Rock chip locations and assay results for key commodity elements. Samples can be seen with anomalous Au in soil Figure 1. (WGS84/UTM Zone 34N).
Soil Geochemistry Results from 386 B/C horizon soil samples successfully captured the signature of Au-Cu mineralization at Ceovishte. Two known occurrences were highlighted by the sampling, verifying the Au-Ag-As-Bi-Cu-Te grouping as representing mineralization, with a further 900 m strikelength anomaly being generated for follow up in the north of the survey. The newly defined target area returned assays up to 2.42 g/t Au and 424 ppm Cu in soil. This area has not seen rock chip sampling and offers significant exploration upside for extending the footprint of known Au-Cu mineralization.
Elevated commodity and pathfinder elements in soil correlate to a K-Ba-Na element grouping, indicating sub cropping intermediate composition intrusives rather than the ultramafic country rock which has a strong Ni-Co-Cr-Mg signature. Soil anomalism generates an annular pattern which surrounds a central topographic depression with enclosing ridges of ultramafic rock. This correlation could indicate concentric and ring radial fractures, which have formed around a central porphyry intrusive and focussed hydrothermal fluid flow. Potassic altered, Au-Cu mineralized diorite intrusives have been observed and sampled at both the southern and northern extents of this annular feature, with over 900 m of untested strike length in the northeast.
Future Exploration Program The norther Ceovishte licence is drill-ready with pad locations designed to test the depth extensions of the Au-Cu mineralization sampled on surface. Following positive results in maiden drilling geophysics will be considered to guide a larger phase II drilling program.
Follow up of the anomalous soil geochemistry will be undertaken in the northeast through geological/alteration mapping and rock chip assay. This will generate a pipeline of targets for drill testing. Further soil sampling will be completed in the northeast where the anomaly remains open to define its full spatial extent.
1st Tranche Private Placement Financing Closed The Company issued an aggregate of 4,760,586 Units at a price of $0.085 per Unit for gross proceeds of $404,650 pursuant to the Offering announced on April 4th, 2023. Each Unit consists of one common share in the capital of the Company (each, a “Common Share”) and one Common Share purchase warrant (each whole warrant, a “Warrant”). Each Warrant entitles the holder to purchase one Common Share at an exercise price of $0.13 until May 5th, 2026.
The Company intends to use the net proceeds of the Offering for working capital and to fund the Phase II drilling across its portfolio of properties. Finders’ fees in the amount of $8,057 were paid.
Giulio Bonifacio, Chair of the board of directors, Steven Latimer, a director, and Kim Oishi, a director (the “Insiders”) purchased 1,194,117 Units as part of the Offering. The issuance of the Units to the Insiders constitutes a “related party transaction” as this term is defined in Multilateral Instrument 61-101 – Protection of Minority Securityholders in Special Transactions (“MI 61-101”). The Company is relying on the exemption from valuation requirement and minority approval pursuant to subsection 5.5(a) and 5.7(a) of MI 61-101, respectively, as the securities do not represent more than 25% of the Company’s market capitalization, as determined in accordance with MI 61-101. The participation by Insiders in the Offering was approved by directors of the Company who are independent in connection with such transactions.
Pursuant to applicable Canadian securities laws, all securities issued and issuable in connection with the closing of the Private Placement will be subject to a four (4) month hold period ending September 6th, 2023.
This news release does not constitute an offer to sell or a solicitation of an offer to sell any of the securities in the United States. The securities have not been and will not be registered under the United States Securities Act of 1933, as amended (the “U.S. Securities Act”) or any state securities laws, and may not be offered or sold within the United States, or to or for the account or benefit of any U.S. person or any person in the United States, unless registered under the U.S. Securities Act and applicable state securities laws or an exemption from such registration is available. “United States” and “U.S. Person” are as defined in Regulation S under the U.S. Securities Act.
QAQC Representative rock samples were taken from surface outcrops and sent to ALS Bor, Serbia for sample preparation and subsequent wet chemical analysis at the Loughrea laboratory in Ireland, and ISO/IEC 17025:2017 certified test facility. Sample preparation PREP-31BY method involved crushing the core to a 70% fraction less than 2 mm in size, rotary split 1.0 kg and pulverizing the split to greater than 85% passing 75 microns. Silver and base metals were analysed by ICP MS after a four-acid digest (ME-MS61). Gold was assayed by 30g fire assay with ICP AES finish (Au-ICP21). Over limit samples for base metals were re-analysed by the four-acid digest ICP-AES analyses termed ME-OG62. Over-limit gold analysis was conducted by fire assay and gravimetric finish (Au-GRA21). Soil samples were taken in the B/C horizon and sent to ALS Bor, Serbia. Analysis was undertaken after dry screening to 180 microns by method AuME-TL44 an aqua regia digest followed by ICP analysis on a 50g sample. Over-assays were conducted by the OG-46 (base metals) and Au-AROR44 (gold) techniques.
Qualified Person Dr. Aleksandar Mišković, P.Geo, is the Company’s designated Qualified Person for this news release within the meaning of National Instrument 43-101 Standards of Disclosure of Mineral Projects (“NI 43-101”) and has reviewed and validated that the information contained in this news release as accurate.
About the Company Terra Balcanica is a polymetallic exploration company targeting large-scale mineral systems in the Balkans of southeastern Europe. The Company has 90% interest in the Viogor-Zanik Project in eastern Bosnia and Herzegovina, 100% of the Kaludra and Ceovishte mineral exploration licences in southern Serbia. The Company emphasizes responsible engagement with local communities and stakeholders. It is committed to proactively implementing Good International Industry Practice (GIIP) and sustainable health, safety, and environmental management.
ON BEHALF OF THE BOARD OF DIRECTORS
Terra Balcanica Resources Corp. “Aleksandar Mišković”
This news release contains certain forward-looking information and forward-looking statements within the meaning of applicable securities legislation (collectively “forward-looking statements”). The use of any of the words“will”, “intends” and similar expressions are intended to identify forward-looking statements. These statements involve known and unknown risks, uncertainties and other factors that may cause actual results or events to differ materially from those anticipated in such forward-looking statements. Such forward-looking statements should not be unduly relied upon. Actual results achieved may vary from the information provided herein as a result of numerous known and unknown risks and uncertainties and other factors. The Company believes the expectations reflected in those forward-looking statements are reasonable, but no assurance can be given that these expectations will prove to be correct. The Company does not undertake to update these forward-looking statements, except as required by law.
VANCOUVER, BC / ACCESSWIRE / May 5, 2023 / Stillwater Critical Minerals (formerly Group Ten Metals) (TSXV:PGE)(OTCQB:PGEZF)(FSE:5D32) (the “Company” or “SWCM”) announces that the Company has applied for TSX Venture Exchange approval to extend the expiry date on certain warrants that are due to expire May 21, 2023 (the “Warrants”). Per the application, 5,233,824 Warrants that were originally issued as part of a financing completed in November 2019 (see news release dated November 21, 2019) will be extended to a new expiration date of November 21, 2023. Each Warrant entitles the holder to acquire one common share at an exercise price of CDN$ 0.25.
About Stillwater Critical Minerals Corp.
Stillwater Critical Minerals (TSX.V:PGE | OTCQB:PGEZF) is a mineral exploration company focused on its flagship Stillwater West Ni-PGE-Cu-Co + Au project in the iconic and famously productive Stillwater mining district in Montana, USA. With the recent addition of two renowned Bushveld and Platreef geologists to the team, the Company is well positioned to advance the next phase of large-scale critical mineral supply from this world-class American district, building on past production of nickel, copper, and chromium, and the on-going production of platinum group and other metals by neighboring Sibanye-Stillwater. An expanded NI 43-101 mineral resource estimate, released January 2023, delineates a compelling suite of critical minerals contained within five Platreef-style nickel and copper sulphide deposits at Stillwater West, which host a total of 1.6 billion pounds of nickel, copper and cobalt, and 3.8 million ounces of palladium, platinum, rhodium, and gold, and remains open for expansion along trend and at depth.
Stillwater Critical Minerals also holds the high-grade Black Lake-Drayton Gold project adjacent to Treasury Metals’ development-stage Goliath Gold Complex in northwest Ontario, currently under an earn-in agreement with Heritage Mining, and the Kluane PGE-Ni-Cu-Co critical minerals project on trend with Nickel Creek Platinum‘s Wellgreen deposit in Canada‘s Yukon Territory.
Neither the TSX Venture Exchange nor its Regulation Services Provider (as that term is defined in the policies of the TSX Venture Exchange) accepts responsibility for the adequacy or accuracy of this release.
KELOWNA, BC / ACCESSWIRE / May 4, 2023 / Diamcor Mining Inc. (TSX-V.DMI)(OTCQB-DMIFF)(FRA:DC3A), (“Diamcor” or, the “Company”) a Canadian based diamond mining Company with a proven history in the mining, exploration, and sale of rough diamonds, announces today that it will be proceeding with an extensive drilling and bulk sampling program over the greater portions of its Krone-Endora at Venetia diamond mine project (the “Project”).
These efforts will be aimed at further identifying and locating additional material which is known to have shifted and eroded from the adjacent De Beers’ Venetia diamond mine. Diamcor’s establishment of infrastructure, two large processing plants, heavy equipment, and the extensive large-scale trial mining exercises completed to date in the initial area of 657 hectares of the Project’s total 5,888 hectares, have allowed Diamcor to refine unique approaches to mining using advanced technology and techniques to extract diamonds from the Project in a safe, efficient, and environmentally responsible manner. The previous establishment of these collective items will allow Diamcor to now advance these additional drilling and bulk sampling efforts in a very cost-effective and efficient manner.
“The considerable effort to date now allows us to proceed with this drilling and bulk sampling on the greater areas of the Project,” stated Mr. Dean Taylor, Diamcor’s CEO. “The knowledge gained from previous trial-mining and the sale of rough diamonds, along with recent modeling and initial input of some of the industry’s most respected geological experts, all point to the potential to identify significant additional material from the known shift and erosion off of Venetia.“
The initial trial-mining efforts undertaken to date have provided the Company with a better understanding of the shift and erosion of the estimated 1,000 vertical meters of material from the De Beers Venetia diamond mine kimberlite clusters that are known to have been displaced in the direction of Diamcor’s Krone and Endora properties. Both properties are co-located with De Beers Venetia mine, which is recognized as one of the top-producing diamond mines in the world. Trial mining exercises are expected to continue on portions of the initial area in conjunction with the additional drilling and bulk sampling exercises, with both items serving to further advance the recommended work programmes from the Project’s initial NI 43-101.
Further details on the parties involved in the management and independent oversight of these drilling and bulk sampling exercises will be outlined in a separate release to be issued by the Company in the coming days.
About Diamcor Mining Inc.
Diamcor Mining Inc. is a fully reporting publicly traded Canadian diamond mining company with a well-established history in the mining, exploration, and sale of rough diamonds. The Company is listed on the TSX Venture Exchange (V.DMI), and trades on the OTC QB International (DMIFF). The Company’s primary focus is on the development of its Krone-Endora at Venetia Project which is co-located and directly adjacent to De Beers’ Venetia Diamond Mine in South Africa. The Venetia diamond mine is recognized as one of the world’s top diamond-producing mines, and the deposits which occur on Krone-Endora have been identified as being the result of shift and subsequent erosion of an estimated 1,000 vertical meters of material from the higher grounds of Venetia to the lower surrounding areas in the direction of Krone and Endora. The Company focuses on the acquisition and development of mid-tier projects with near-term production capabilities and growth potential and uses unique approaches to mining that involves the use of advanced technology and techniques to extract diamonds in a safe, efficient, and environmentally responsible manner. The Company has a strong commitment to social responsibility, including supporting local communities and protecting the environment.
About the Tiffany & Co. Alliance
The Company has established a long-term strategic alliance and first right of refusal with Tiffany & Co. Canada, a subsidiary of world famous New York based Tiffany & Co., to purchase up to 100% of the future production of rough diamonds from the Krone-Endora at Venetia Project at market prices. In conjunction with this first right of refusal, Tiffany & Co. Canada also provided the Company with financing in an effort to advance the Project as quickly as possible. Tiffany & Co. is now owned by Moet Hennessy Louis Vuitton SE (LVMH), a publicly traded company which is listed on the Paris Stock Exchange (Euronext) under the symbol LVMH and on the OTC under the symbol LVMHF. For additional information on Tiffany & Co., please visit their website at www.tiffany.com.
About Krone-Endora at Venetia
In February 2011, Diamcor acquired the Krone-Endora at Venetia Project from De Beers Consolidated Mines Limited, consisting of the prospecting rights over the farms Krone 104 and Endora 66, which represent a combined surface area of approximately 5,888 hectares directly adjacent to De Beers’ flagship Venetia Diamond Mine in South Africa. On September 11, 2014, the Company announced that the South African Department of Mineral Resources had granted a Mining Right for the Krone-Endora at Venetia Project encompassing 657.71 hectares of the Project’s total area of 5,888 hectares. The Company has also submitted an application for a mining right over the remaining areas of the Project. The deposits which occur on the properties of Krone and Endora have been identified as a higher-grade “Alluvial” basal deposit which is covered by a lower-grade upper “Eluvial” deposit. The deposits are proposed to be the result of the direct-shift (in respect to the “Eluvial” deposit) and erosion (in respect to the “Alluvial” deposit) of material from the higher grounds of the adjacent Venetia Kimberlite areas. The deposits on Krone-Endora occur with a maximum total depth of approximately 15.0 metres from surface to bedrock, allowing for a very low-cost mining operation to be employed with the potential for near-term diamond production from a known high-quality source. Krone-Endora also benefits from the significant development of infrastructure and services already in place due to its location directly adjacent to the Venetia Mine, which is widely recognised as one of the top producing diamond mines in the world.
Qualified Person Statement:
Mr. James P. Hawkins (B.Sc., P.Geo.), is Manager of Exploration & Special Projects for Diamcor Mining Inc., and the Qualified Person in accordance with National Instrument 43-101 responsible for overseeing the execution of Diamcor’s exploration programmes and a Member of the Association of Professional Engineers and Geoscientists of Alberta (“APEGA”). Mr. Hawkins has reviewed this press release and approved of its contents.
This press release contains certain forward-looking statements. While these forward-looking statements represent our best current judgement, they are subject to a variety of risks and uncertainties that are beyond the Company’s ability to control or predict and which could cause actual events or results to differ materially from those anticipated in such forward-looking statements. Further, the Company expressly disclaims any obligation to update any forward looking statements. Accordingly, readers should not place undue reliance on forward-looking statements.
WE SEEK SAFE HARBOUR
Neither TSX Venture Exchange nor its Regulation Services Provider (as that term is defined in policies of the TSX Venture Exchange) accepts responsibility for the adequacy or accuracy of this release.
Burlington, Ontario–(Newsfile Corp. – May 4, 2023) – Silver Bullet Mines Corp. (TSXV: SBMI) (OTCQB: SBMCF) (‘SBMI’ or ‘the Company’) is pleased to announce it has received the previously announced cash advance on its first order for its silver products from a third-party (the “Purchaser”).
SBMI has received the sum of USD$225,000 from the Purchaser as a cash advance against the order for 500 kg of silver, to be delivered to the Purchaser in tranches or all at once. At today’s pricing this first order represents more than USD$430,000 (more than CDN$570,000).
The Purchaser has indicated it intends to purchase 500 kg from SBMI each month for six months, including this order.
The first order is currently being processed from the stockpile at the mill and SBMI anticipates shipping it in whole or in part within 30 days. The Company continues to work with the Purchaser and other potential purchasers to develop a customer base for its silver/gold production.
At the Buckeye Mine, mining is ongoing. As per SBMI’s January 16, 2023 press release, SBMI continues to drift along the vein to an area believed to contain higher grade mineralization (see page 8 of the Geologic Report dated January 8, 2021). The Company expects to encounter that area in the near future, although given the uncertainties inherent in mining no exact date can be given.
Peter M. Clausi Silver Bullet Mines Corp., VP Capital Markets pclausi@brantcapital.ca +1 (416) 890-1232
Cautionary and Forward-Looking Statements
This news release contains certain statements that constitute forward-looking statements as they relate to SBMI and its subsidiaries. Forward-looking statements are not historical facts but represent management’s current expectation of future events, and can be identified by words such as “believe”, “expects”, “will”, “intends”, “plans”, “projects”, “anticipates”, “estimates”, “continues” and similar expressions. Although management believes that the expectations represented in such forward-looking statements are reasonable, there can be no assurance that they will prove to be correct.
By their nature, forward-looking statements include assumptions, and are subject to inherent risks and uncertainties that could cause actual future results, conditions, actions or events to differ materially from those in the forward-looking statements. If and when forward-looking statements are set out in this new release, SBMI will also set out the material risk factors or assumptions used to develop the forward-looking statements. Except as expressly required by applicable securities laws, SBMI assumes no obligation to update or revise any forward-looking statements. The future outcomes that relate to forward-looking statements may be influenced by many factors, including but not limited to: the impact of SARS CoV-2 or any other global virus; reliance on key personnel; the thoroughness of its QA/QA procedures; the continuity of the global supply chain for materials for SBMI to use in the production and processing of mineralized material; the presence of mineable economic mineralized material; shareholder and regulatory approvals; activities and attitudes of communities local to the location of the SBMI’s properties; risks of future legal proceedings; income tax matters; fires, floods and other natural phenomena; the rate of inflation; availability and terms of financing; distribution of securities; commodities pricing; currency movements, especially as between the USD and CDN; effect of market interest rates on price of securities; and, potential dilution. SARS CoV-2 and other potential global pathogens create risks that at this time are immeasurable and impossible to define.
Vancouver, British Columbia–(Newsfile Corp. – May 3, 2023) – Goldshore Resources Inc. (TSXV: GSHR) (OTCQB: GSHRF) (FSE: 8X00) (“Goldshore” or the “Company“), is pleased to announce the preliminary results from its PEA-level metallurgical test work at the Moss Gold Project in Northwest Ontario, Canada (the “Moss Gold Project“). The results were produced from the recent metallurgical testing program completed by Base Metallurgical Laboratories in Kamloops, British Columbia under the overall supervision of Ausenco Engineering Canada Inc. (“Ausenco”).
Highlights:
Test work shows significantly increased gold recoveries from a flotation-regrind-leach process averaging:
93% recovery at Moss
98% recovery at East Coldstream
These results represent an 8% to 13% increase in gold recoveries from previously conducted standard leach test work.
Coarse bottle roll leach test results returned gold recoveries between 53% and 64%, which encourage investigation of a low recovery heap leach solution for low-grade mineralization that may bring gold production forward and reduce tailings.
President and CEO Brett Richards stated: “We are very pleased with the early results from the metallurgical test program, as recoveries have increased from the InnovExplo’s 2011 mineral resource estimate and subsequent 2013 preliminary economic assessment by 8%-13%. This detailed testing being undertaken will enhance the economics of our new mineral resource estimate due out in the near future; and the new preliminary economic assessment due to commence immediately thereafter. As well, these results also appear to provide early support for heap leaching the low-grade material, which positively changes the dynamics of an economic analysis.”
Technical Overview
Figure 1 shows the location of the samples that make up the metallurgical composites.
The metallurgical gold recovery test-work was conducted to assess the potential gold recoveries and potential process flowsheets for the Moss Gold Project, which include the Moss Gold Deposit (“Moss”) and East Coldstream Gold Deposit (“East Coldstream”). Testing started in early 2023 on composite and variability samples from the Main, QES and SW Zones at Moss, and from East Coldstream. The program included comminution testing, grind optimization for leaching and flotation, gravity concentration, and leach testing. Cyanide destruction and solid liquid separation testing are still ongoing and will be completed later in Q2 2023.
Gold Recovery Test Work Results Summary
The program evaluated 18 discrete composite samples representing the two gold deposits. Each composite consisted of multiple samples collected from diamond drill core and coarse rejects. Primary composites were selected for the Main / QES Zones (three samples), and one sample each for the SW Zone and East Coldstream deposits to reflect grade, spatial and lithological distributions. The composition of the primary pit composites was designed to have anticipated average grades that will be confirmed in a planned mineral resource estimate. Variability samples were selected to provide representation from higher grade shear zones and lower grade host rocks from the deposits.
Crushing and Grinding Testing
Comminution testing characterized sample hardness by Steve Morell Comminution (“SMC”) testing, Bond Rod Mill (“RWI”), Ball Mill Work Index (“BWI”) and Bond Abrasion Index (“Ai”) tests. Three samples from the Main QES deposit were used for this testing.
The results showed:
SMC Axb average value of 34.7, indicates the samples are competent.
Average RWI and BWI values of 18.4 and 19.5 (metric) respectively, considered hard to very hard range of hardness.
Average Ai value of 0.175 g, which is classified as low to moderately abrasive.
Gravity Concentration Testing
The Main and QES Zone composite samples were tested with the Extended Gravity Recoverable Gold protocol to determine their amenability to gravity concentration.
At full scale, this would be in the 10% to 15% gold recovery range.
Leach Testing
Coarse Particle Size Leach Tests
Intermittent bottle rolls leach tests were conducted on the samples at crush sizes of -6.25 mm and -2 mm to evaluate potential for heap leaching. Tests were run over 8 days with bottles rolled for 1 minute per hour.
The results showed:
Average leach extraction for the -6.25 mm crush size samples is 52.6% Au.
Average leach extraction for the -2 mm crush size samples is 64.2% Au.
Standard Leach Tests
Initial standard bottle rolls leach tests were completed on the primary composites from Main and QES Zones, over a range of grind sizes with 48 hours leaching and without gravity concentration prior to leaching. The results showed a weak relationship between grind size and recovery. As a result, a grind of 80% passing 100 microns was selected for further testing. The selected retention time was 48 hours. Gold leach extractions averaged 84% for these tests.
A total of 25 leach tests were conducted including initial screening tests and a bulk leach test (pending) that will generate sample for cyanide detox testing. The results showed:
Gold leach extractions ranging from 74% to 93%, averaging 83%, with final residue values of 0.08 g/t to 0.32 g/t gold, averaging 0.20 g/t gold.
Calculated gold head grades ranging from 0.40 g/t to 3.06 g/t gold, averaging 1.36 g/t gold.
Shear Zone samples and low-grade Intrusion domain samples showed similar leach extractions to higher grade shear zone samples, based on leach residue grades as a function of head grades.
Sodium cyanide consumption averaged 0.50 kg/t.
Flotation-Leach Tests
Testing was also completed using a flotation-leach flowsheet which includes:
Grinding to 80% passing 100 microns.
Flotation of a sulphide concentrate.
Concentrate regrind to 80% passing 15 microns followed by 48 hours leaching.
Flotation tailings leach without regrinding for 48 hours.
Results were positive with higher extractions than the standard leach tests. Key results include:
Sulphide concentrate mass recoveries averaged 11%, ranging from 5% to 19%.
Concentrate leach extractions averaged 96%, ranging from 92% to 98%.
Flotation tailings leach extractions averaged 76%, ranging from 69% to 90%.
Combined leach extractions averaged 93%, ranging from 87% to 98%.
Calculated gold head grades ranging from 0.60 g/t to 2.77 g/t gold, averaging 1.46 g/t gold.
Sodium cyanide consumption averaged 0.75 kg/t.
A summary of the results from the primary composites with the two flowsheets evaluated are shown in Table 1.
Table 1: Moss Project Primary Composite Leach Extractions Based on Flowsheet
Composite ID
Head Grade (Au g/t)
Recovery (Au%)
Whole Ore Leach
Flotation Leach
Main/QES West Composite
1.48
84
89
Main/QES Central Composite
0.53
80
87
Main/QES East Composite
1.98
86
96
Main/QES Combined Composite
1.14
82
93
Southwest Zone Composite
0.83
76
93
East Coldstream Composite
2.64
93
98
Plant recoveries will be estimated with typical plant losses for use in the planned mineral resource estimate.
Pete Flindell, VP Exploration for Goldshore, said, “These metallurgical test results affirm our belief that gold recoveries in the sulphide-bearing shear zone mineralization can be significantly improved by flotation, while the low sulphide-bearing low-grade intrusion domain mineralization may be amenable to heap leaching. Further test work is required to investigate the latter, but we have now established +90% gold recoveries for the bulk of the contained ounces at Moss and East Coldstream are achievable with a flotation-regrind-leach circuit.”
Qualified Persons
Peter Flindell, P.Geo., MAusIMM, MAIG, Vice President – Exploration of the Company and Tommaso Roberto Raponi, P.Eng., an independent consultant with Ausenco Engineering Canada Inc., are both “Qualified Persons” as defined by National Instrument 43-101 – Standards of Disclosure for Mineral Projects (“NI 43-101”) have reviewed and verified the scientific and technical information contained in this news release.
About Goldshore
Goldshore is an emerging junior gold development company, and owns 100% of the Moss Gold Project located in Ontario. Wesdome is currently a large shareholder of Goldshore. Well-financed and supported by an industry-leading management group, board of directors and advisory board, Goldshore is positioned to advance the Moss Gold Project through the next stages of exploration and development.
About Ausenco
Ausenco is a global diversified engineering, construction and project management company providing consulting, project delivery and asset management solutions to the resources, energy and infrastructure sectors. Ausenco’s experience in gold projects ranges from conceptual, pre-feasibility and feasibility studies for new project developments to project execution with EPCM and EPC delivery. Ausenco is currently engaged on a number of global projects with similar characteristics and opportunities to the Moss Gold Project.
Neither the TSXV nor its Regulation Services Provider (as that term is defined in the policies of the TSXV) accepts responsibility for the adequacy or accuracy of this release.
For More Information – Please Contact:
Brett A. Richards President, Chief Executive Officer and Director Goldshore Resources Inc.
This news release contains statements that constitute “forward-looking statements.” Such forward-looking statements involve known and unknown risks, uncertainties and other factors that may cause the Company’s actual results, performance or achievements, or developments to differ materially from the anticipated results, performance or achievements expressed or implied by such forward-looking statements. Forward-looking statements are statements that are not historical facts and are generally, but not always, identified by the words “expects,” “plans,” “anticipates,” “believes,” “intends,” “estimates,” “projects,” “potential” and similar expressions, or that events or conditions “will,” “would,” “may,” “could” or “should” occur.
Forward-looking statements in this news release include, among others, statements relating to expectations regarding the exploration and development of the Moss Gold Project, including gold recoveries, the release of an updated mineral resource estimate and preliminary economic assessment, and other statements that are not historical facts. By their nature, forward-looking statements involve known and unknown risks, uncertainties and other factors which may cause our actual results, performance or achievements, or other future events, to be materially different from any future results, performance or achievements expressed or implied by such forward-looking statements. Such factors and risks include, among others: the Company may require additional financing from time to time in order to continue its operations which may not be available when needed or on acceptable terms and conditions acceptable; compliance with extensive government regulation; domestic and foreign laws and regulations could adversely affect the Company’s business and results of operations; the stock markets have experienced volatility that often has been unrelated to the performance of companies and these fluctuations may adversely affect the price of the Company’s securities, regardless of its operating performance; and the impact of COVID-19.
The forward-looking information contained in this news release represents the expectations of the Company as of the date of this news release and, accordingly, is subject to change after such date. Readers should not place undue importance on forward-looking information and should not rely upon this information as of any other date. The Company undertakes no obligation to update these forward-looking statements in the event that management’s beliefs, estimates or opinions, or other factors, should change.
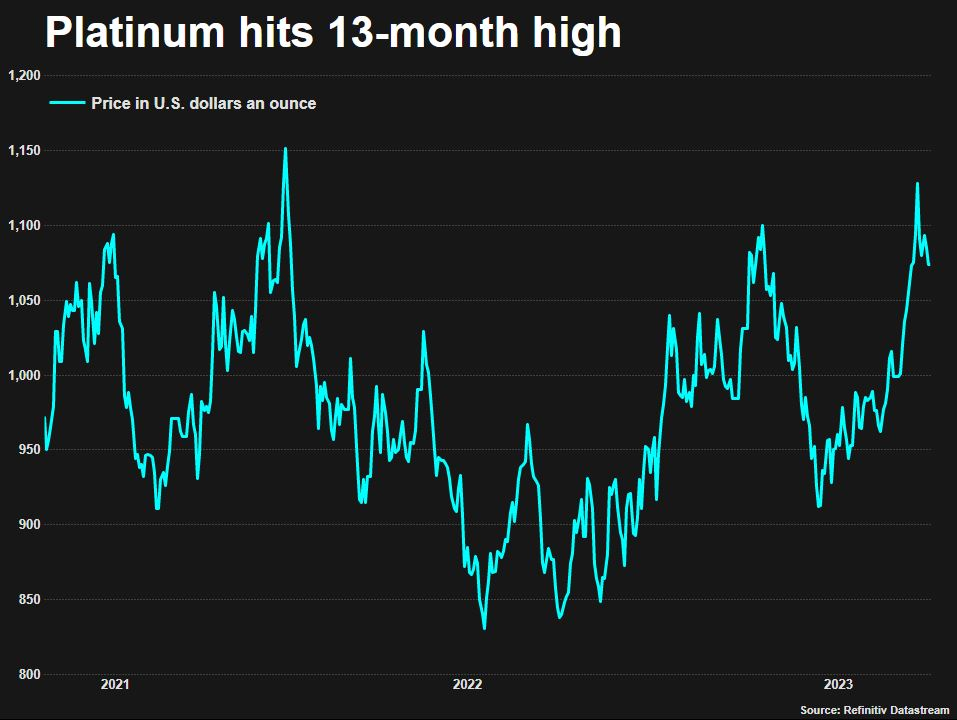
Platinum prices have shot up as speculators bet that power outages at South African mines and rising demand from auto makers and the hydrogen industry will create supply shortages.
Platinum is used to neutralize harmful engine emissions, as well as in other industries and jewellery. Prices leaped from just above $900 an ounce in late February to $1,132.17 on April 21 — the highest in more than a year — before easing to around $1,050 by Tuesday.
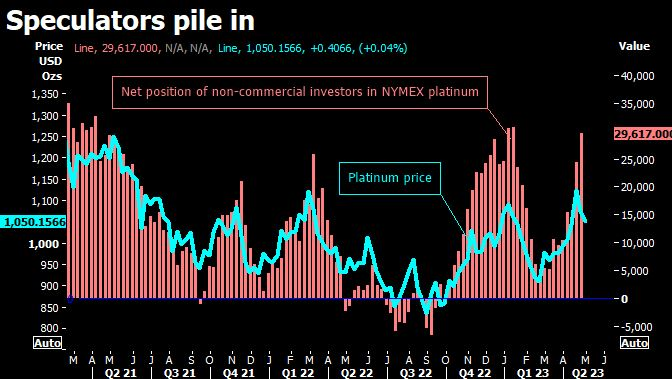
Speculative investors have expanded their net long position in NYMEX platinum futures to 1.5 million ounces from 145,000 ounces in late February, exchange data show.
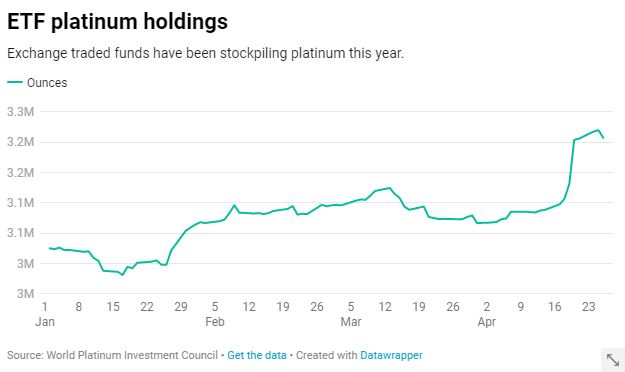
Exchange traded funds (ETFs) storing platinum for their shareholders meanwhile bought around 120,000 ounces in just a few days in late April, according to the World Platinum Investment Council (WPIC), which tracks funds.
Charting platinum prices and the net speculative position in NYMEX platinumExchange traded funds have increased their holdings of platinum
“We think this is the first year of serial deficits in the platinum market,” said Standard Chartered analyst Suki Cooper.
However, Cooper said prices could weaken in the short term before supply risks worsen later in the year.
South Africa produces 70-75% of mined platinum supply. Miners there have said rolling power cuts could cut their output by 5-15% this year, Cooper said, adding that Russian production may also disappoint.
“We’re now entering the winter period in South Africa and getting more frequent alerts on power outages,” she said. “The market is concerned.”
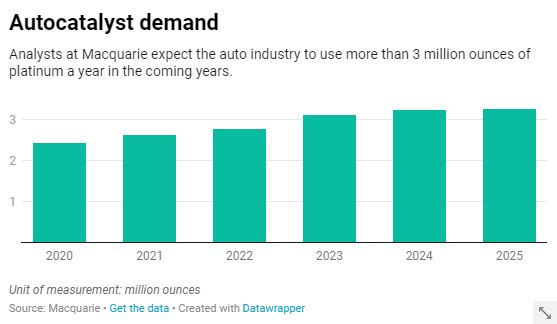
Demand from the auto industry — the biggest consumer of platinum — should rise by 8% this year as vehicle production increases, said StoneX analyst Rhona O’Connell.
O’Connell forecasts a 900,000 ounce deficit in the roughly 8 million ounce a year platinum market this year. The WPIC predicts a shortfall of around 500,000 ounces.
Investors also hope that large amounts of platinum will be used in the production and use of hydrogen.
But analysts at Macquarie said this could take years. “In our base case, the sector (across fuel cells and PEM electrolysers) would account for around 220,000 of demand in 2030 but be approaching 2 million ounces by 2040,” they wrote in a note.
Analysts at Macquarie expect the auto industry to use more than 3 million ounces of platinum a year in the coming years.