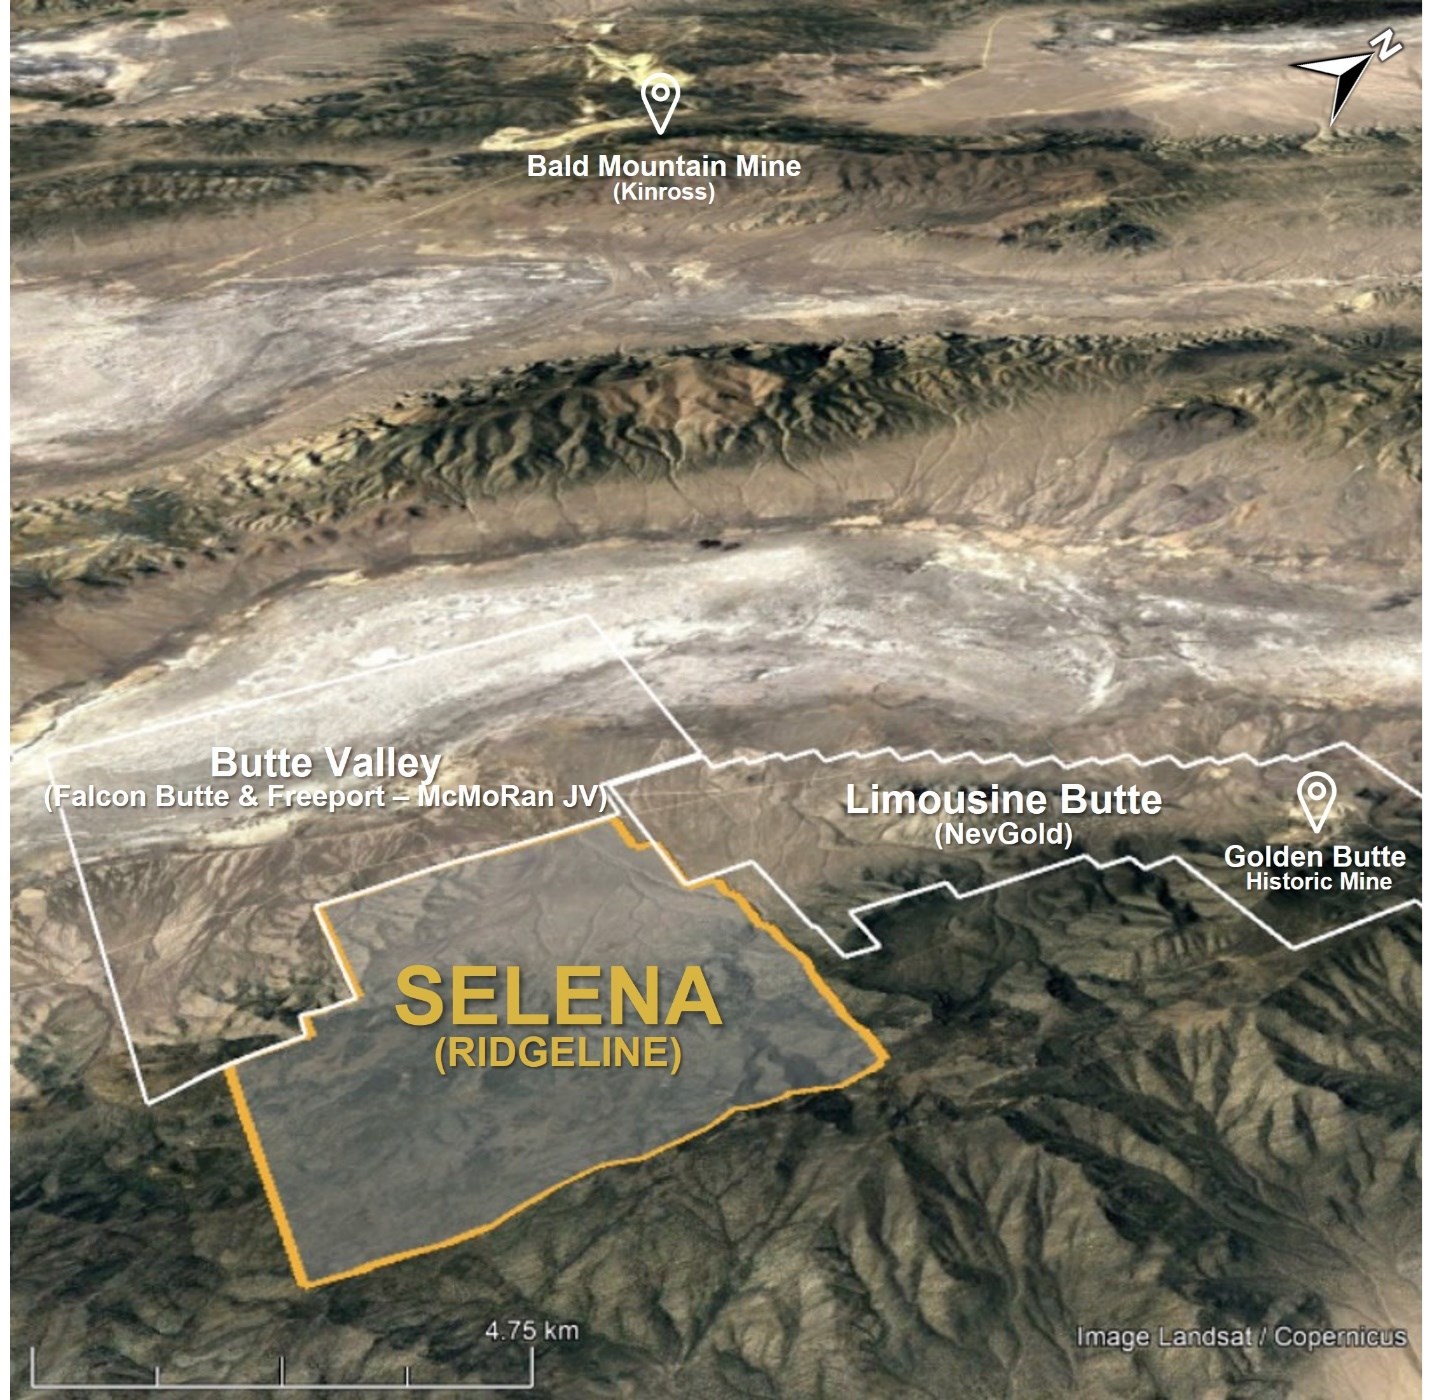
Vancouver, British Columbia–(Newsfile Corp. – July 24, 2023) – Ridgeline Minerals Corp. (TSXV: RDG) (OTCQB: RDGMF) (FSE: 0GC0) (“Ridgeline” or the “Company”) is pleased to announce the commencement of the Company’s diamond core drill program at the Selena project (“Selena”). Selena is host to a silver (“Ag”) – gold (“Au”) – lead (“Pb”) – zinc (“Zn”) carbonate replacement (“CRD”) style discovery located in White Pine County, Nevada (Figure 1).
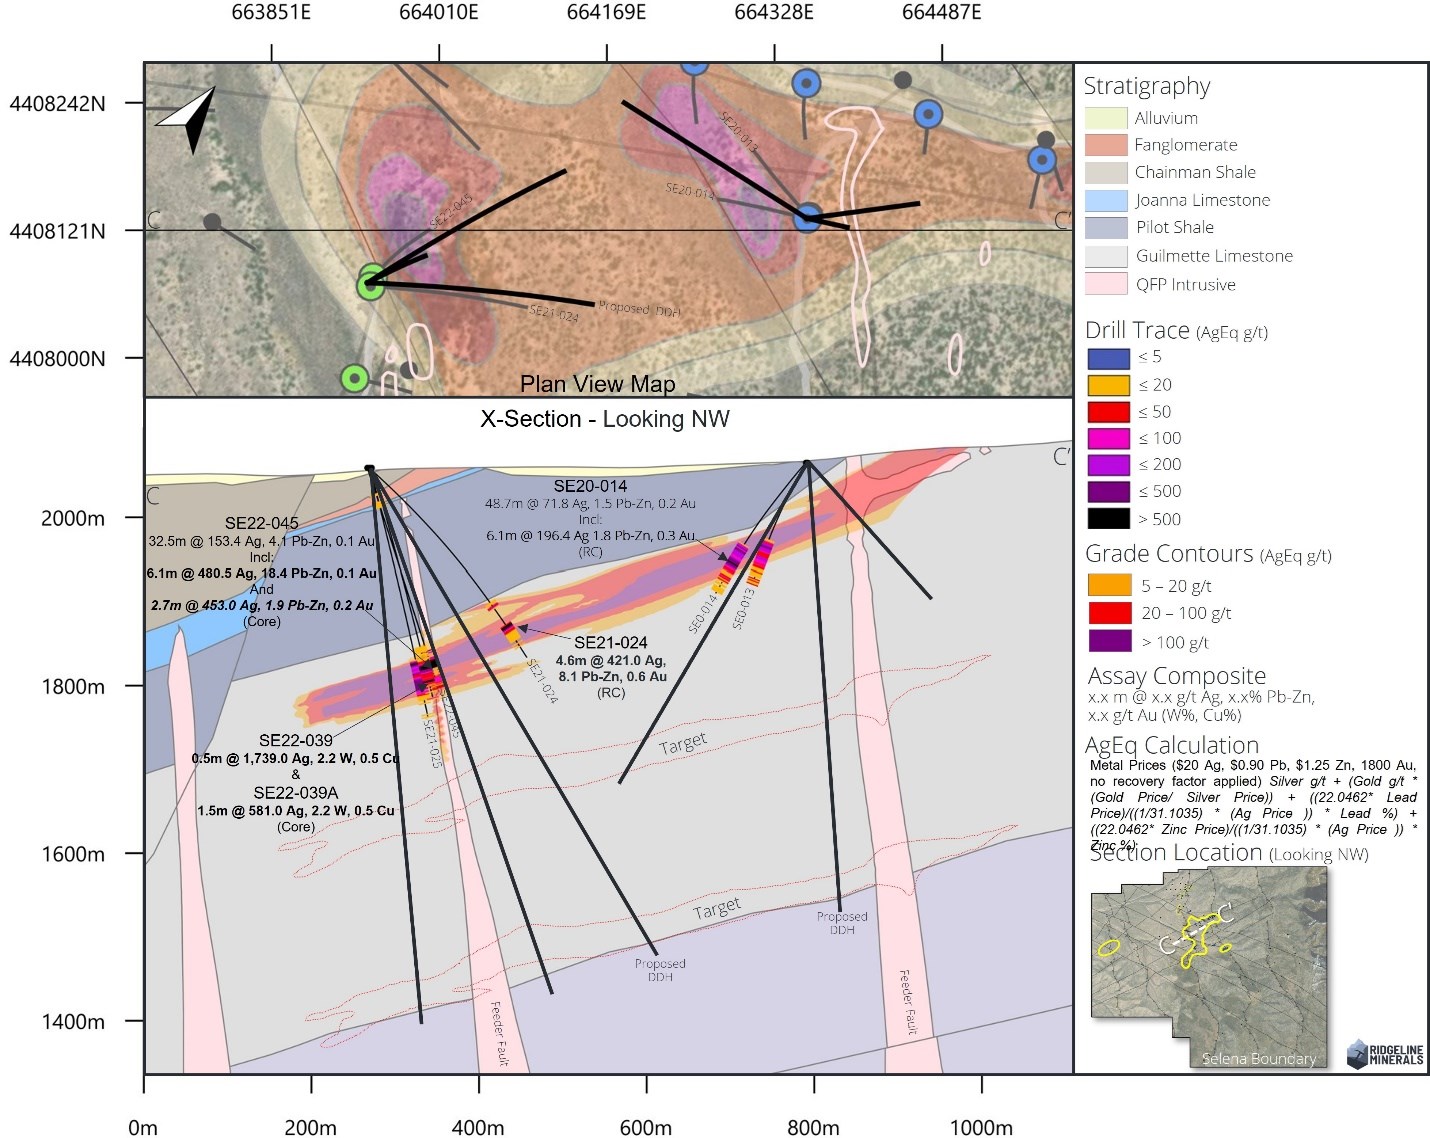
The drill program has been designed to follow-up on bonanza grade CRD intercepts drilled at the Chinchilla zone in 2022, with highlights including 6.1 meters (“m”) grading 480 grams per tonne (“g/t”) Ag, 12.0% Pb, 6.4% Zn, and 0.1 g/t Au in SE22-045 and 0.5 m grading 1,793 g/t Ag, 2.2% tungsten (“W”) and 0.5% copper (“Cu”) in SE22-039 (see January 24, 2023 press release HERE). The program will complete up to six (6) core holes for a total of 3,000 m with results to be released as they are received (Figure 2).
Mike Harp, Vice President, Exploration commented, “Last year’s program delivered the best intercepts in the project’s history. It also confirmed our theory that core drilling would significantly upgrade historical reverse circulation assay results, indicating substantial upside as we convert historically drilled RC intercepts to core. Our 2023 program will build off that success and focus on expanding the high-grade mineralization at two known “chimney” or feeder structures that make up the core of the Chinchilla Zone. We will also drill the lower half of the Guilmette Limestone host rocks, which we believe have potential to host multiple stacked CRD horizons adjacent to known chimney structures.”
Selena Project Selena is located in White Pine County, Nevada, approximately 64 kilometers (“km”) north of the town of Ely, NV. The project shares a property boundary with the Butte Valley project, a US $33M earn-in agreement between Freeport-McMoRan and Falcon Butte Minerals. The 100% owned project is comprised of 39 square kms of highly prospective exploration ground including Ridgeline’s shallow-oxide Ag-Au-Pb-Zn Chinchilla discovery. Subsequent drilling has continued to highlight the potential for high-grade CRD type mineralization (Ag-Au-Pb-Zn ±Cu) between Chinchilla and the Butte Valley Cu-Au-Ag porphyry located directly west of the property. (View the Selena VRIFY Deck Here)
Figure 1: Plan view map showing location of the Selena project which sits directly adjacent to the Butte Valley Porphyry, a US $33M earn-in exploration agreement between Freeport-McMoRan and Falcon Butte Minerals
Figure 2: X-Section C-C’ with scaled plan view map showing past Chinchilla zone intercepts and proposed chimney and manto targets to be tested beneath known high-grade CRD intercepts
QAQC Procedures Samples are submitted to American Assay Laboratories (AAL) of Sparks, Nevada, which is a certified and accredited laboratory, independent of the Company. Samples are prepared using industry-standard prep methods and analysed using FA-PB30-ICP (Au; 30 g fire assay) and ICP-5AM48 (48 element Suite; 0.5 g 5-acid digestion/ICP-MS) methods. AAL also undertakes its own internal coarse and pulp duplicate analysis to ensure proper sample preparation and equipment calibration. Ridgeline’s QA/QC program includes regular insertion of CRM standards, duplicates, and blanks into the sample stream with a stringent review of all results completed by the Company’s Qualified Person, Michael T. Harp, Vice President, Exploration.
Technical information contained in this news release has been reviewed and approved by Michael T. Harp, CPG. the Company’s Vice President, Exploration, who is Ridgeline’s Qualified Person under National Instrument 43-101 and responsible for technical matters of this release.
About Ridgeline Minerals Corp. Ridgeline is a discovery focused gold-silver explorer with a proven management team and a 192 km² exploration portfolio across six projects in Nevada and Idaho, USA. More information about Ridgeline can be found at www.RidgelineMinerals.com.
On behalf of the Board “Chad Peters” President & CEO
Further Information: Chad Peters, P.Geo. President & CEO Ridgeline Minerals Corp. (775) 304-9773 | info@ridgelineminerals.com
Neither the TSX Venture Exchange nor its Regulation Service Provider (as that term is defined in the policies of the TSX Venture Exchange) accepts responsibility for the adequacy or accuracy of this press release.
Cautionary Note regarding Forward-Looking Statements Statements contained in this press release that are not historical facts are “forward-looking information” or “forward-looking statements” (collectively, “Forward-Looking Information”) within the meaning of applicable Canadian securities legislation and the United States Private Securities Litigation Reform Act of 1995. Forward-Looking Information includes, but is not limited to, the anticipated benefits of the Earn-In Agreement and the transaction contemplated thereby. The words “potential”, “anticipate”, “meaningful”, “discovery”, “forecast”, “believe”, “estimate”, “expect”, “may”, “will”, “project”, “plan”, “historical”, “historic” and similar expressions are intended to be among the statements that identify Forward-Looking Information. Forward-Looking Information involves known and unknown risks, uncertainties and other factors which may cause the actual results to be materially different from any future results expressed or implied by the Forward-Looking Information. In preparing the Forward-Looking Information in this news release, Ridgeline has applied several material assumptions, including, but not limited to, assumptions that TSX Venture Exchange approval will be granted in a timely manner subject only to standard conditions; the current objectives concerning the Project can be achieved and that its other corporate activities will proceed as expected; that general business and economic conditions will not change in a materially adverse manner; and that all requisite information will be available in a timely manner. Forward-Looking Information involves known and unknown risks, uncertainties and other factors which may cause the actual results, performance, or achievements of Ridgeline to be materially different from any future results, performance or achievements expressed or implied by the Forward-Looking Information. Such risks and other factors include, among others, risks related to dependence on key personnel; risks related to unforeseen delays; risks related to historical data that has not been verified by the Company; as well as those factors discussed in Ridgeline’s public disclosure record. Although Ridgeline has attempted to identify important factors that could affect Ridgeline and may cause actual actions, events, or results to differ materially from those described in Forward-Looking Information, there may be other factors that cause actions, events or results not to be as anticipated, estimated or intended. There can be no assurance that Forward-Looking Information will prove to be accurate, as actual results and future events could differ materially from those anticipated in such statements. Accordingly, readers should not place undue reliance on Forward-Looking Information. Except as required by law, Ridgeline does not assume any obligation to release publicly any revisions to Forward-Looking Information contained in this news release to reflect events or circumstances after the date hereof or to reflect the occurrence of unanticipated events.
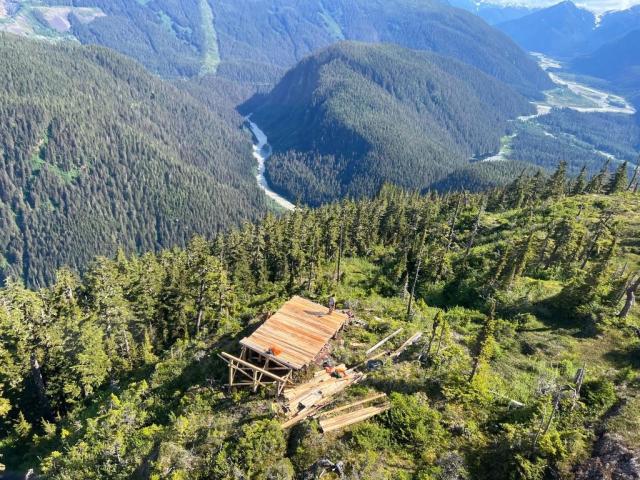
VANCOUVER, BC / ACCESSWIRE / July 28, 2023 / Blackwolf Copper and Gold Ltd. (“Blackwolf”, or the “Company”) (TSXV:BWCG)(OTC PINK:BWCGF) is pleased to announce the launch of the maiden drill program at the Cantoo Mountain Project (“Cantoo”) in Southwest Alaska. The Cantoo Property is located adjacent to the Canadian border and the historic Premier Gold Mine that is currently in redevelopment. Initial drill holes could be in excess of 700 meters to test the multiple structures. This marks the first modern exploration effort at Cantoo since the 1920s and the first ever diamond drill program testing Multiple stacked shallow-dipping vein structures and breccia, including a 30m (100ft) wide vein. During preliminary sampling, Blackwolf uncovered a significant 30-meter (100ft) vein exhibiting high-grade results of up to 30.4g/t Gold, 2860 g/t Silver, and 5.8% Copper outcropping at surface. The initial drill program is planned to cover up to 2000 meters in 4 drill holes over a 1.5 month period with Initial results expected early September.
Morgan Lekstrom, CEO and Director of Blackwolf, commented, “We are proud to commence this drill program, a testament to our commitment to unlocking the potential of this promising location. Cantoo stands out as one of the most compelling untested drill targets in the Golden Triangle. Notably, it lies just approximately 600 meters away from the Premier Mine on the Canadian side of the border. As we know, geology transcends boundaries and borders, and in this prolific region, which is also home to the renowned Brucejack Mine (acquired in 2021 for $2.8 Billion) and numerous other significant mining endeavors, we are poised to unveil the hidden treasures that lie beneath its surface.”
Blackwolf Copper and Gold Ltd, Friday, July 28, 2023, Press release picture
Figure 1: Sampling Results and Drill Plan
Blackwolf Copper and Gold Ltd, Friday, July 28, 2023, Press release picture
Photo 1: Drill pad under construction
Market Making Agreement
Blackwolf is also pleased to announce that it has retained PI Financial Corp. (“PI”) to trade the securities of Blackwolf on the TSX‐V for the purposes of maintaining an orderly market. In consideration of the services provided by PI, the Company will pay PI a monthly cash fee of $5,000 for a minimum term of six months and renewable thereafter. Blackwolf and PI are unrelated and unaffiliated entities. PI will not receive shares or options as compensation. The capital used for market making will be provided by PI.
QA/QC AND QUALIFIED PERSON
The analytical work on the Hyder project will be performed by MSALABS a certified, analytical services provider, at its laboratory in Langley, British Columbia. All samples will be prepared using procedure PRP-910 (dry, crush to 70% passing 2mm, riffle split off 250g, pulverize split to better than 85% passing 75 microns) and analyzed by method FAS-111 (30g fire assay with AAS finish) and IMS-130 (0.5g, aqua regia digestion and ICP-AES/MS analysis). Any samples containing >10g/t Au were reanalyzed using method FAS-415 (30g Fire Assay with gravimetric finish). Samples containing >100 ppm Ag and/or >1% Cu, Pb, & Zn are reanalyzed using method ICF-6 (0.2g, 4-acid digest and ore grade ICP-AES analysis). Samples containing >1000 g/t Ag were reanalyzed using method FAS-418 (30g fire assay with AAS finish) and samples containing >20% Pb were reanalyzed using method STI-8Pb (volumetric titration).
The reported work was completed using industry standard procedures, including a quality assurance/quality control (“QA/QC”) program consisting of the insertion of certified standard, blanks and duplicates into the sample stream. The Qualified Person has reviewed the data and detected no significant QA/QC issues.
Andrew Hamilton, P.Geo., Consultant to the Company, is a Qualified People under NI 43-101, will oversee the 2023 Program and has reviewed and approved the scientific and technical content of this release.
About Blackwolf Copper & Gold Ltd.
The Company holds a 100% interest in the high-grade Niblack copper-gold-zinc-silver VMS project, located adjacent to tidewater in southeast Alaska as well as five Hyder Area gold-silver and VMS properties in southeast Alaska and northwest British Columbia in the Golden Triangle, including the high-priority wide gold-silver veins at the Cantoo Property. Blackwolf’s founding vision is to be an industry leader in transparency, inclusion and innovation. Guided by our Vision and through collaboration with local and Indigenous communities and stakeholders, Blackwolf builds shareholder value through our technical expertise in mineral exploration, engineering and permitting. For more information on Blackwolf, please visit the Company’s website at www.blackwolfcopperandgold.com.
On behalf of the Board of Directors of Blackwolf Copper & Gold Ltd.
“Morgan Lekstrom” CEO and Director
For more information, contact:
Morgan Lekstrom 250-574-7350 (Mobile) 604-343-2997 (Office) rm@bwcg.ca
Neither the TSX Venture Exchange nor its Regulation Services Provider (as that term is defined in the policies of the TSX Venture Exchange) accepts responsibility for the adequacy or accuracy of this release.
Cautionary Statement Regarding Forward-Looking Information
All statements, trend analysis and other information contained in this press release about anticipated future events or results constitute forward-looking statements. Forward-looking statements are often, but not always, identified by the use of words such as “seek”, “anticipate”, “believe”, “plan”, “estimate”, “expect” and “intend” and statements that an event or result “may”, “will”, “should”, “could” or “might” occur or be achieved and other similar expressions. All statements, other than statements of historical fact, included herein, including, without limitation, statements regarding anticipated benefits of the Transaction, the closing of the Transaction, the Company’s position in the Golden Triangle and the Company bringing greater awareness to the Company and engaging with current and future shareholders are forward-looking statements. Although Blackwolf believes that the expectations reflected in such forward-looking statements and/or information are reasonable, undue reliance should not be placed on forward-looking statements since Blackwolf can give no assurance that such expectations will prove to be correct. These statements involve known and unknown risks, uncertainties and other factors that may cause actual results or events to differ materially from those anticipated in such forward-looking statements, including the risks, uncertainties and other factors identified in Blackwolf’s periodic filings with Canadian securities regulators, and assumptions made with regard to: the ability of Blackwolf and Optimum (the “Companies”) to complete the Transaction; the Companies’ ability to secure the necessary shareholder, securityholder, legal and regulatory approvals required to complete the Transaction; and the Companies’ ability to achieve the synergies expected as a result of the Transaction. Forward-looking statements are subject to business and economic risks and uncertainties and other factors that could cause actual results of operations to differ materially from those contained in the forward-looking statements. Important factors that could cause actual results to differ materially from Blackwolf’s expectations include risks associated with the business of the Companies; risks related to the satisfaction or waiver of certain conditions to the closing of the Transaction; non-completion of the Transaction; risks related to reliance on technical information provided by the Companies; risks related to exploration and potential development of the Companies’ projects; business and economic conditions in the mining industry generally; fluctuations in commodity prices and currency exchange rates; uncertainties relating to interpretation of drill results and the geology, continuity and grade of mineral deposits; the need for cooperation of government agencies and native groups in the exploration and development of properties and the issuance of required permits; the need to obtain additional financing to develop properties and uncertainty as to the availability and terms of future financing; the possibility of delay in exploration or development programs and uncertainty of meeting anticipated program milestones; uncertainty as to timely availability of permits and other governmental approvals; and other risk factors as detailed from time to time and additional risks identified in the Companies’ filings with Canadian securities regulators on SEDAR in Canada (available at www.sedar.com). Forward-looking statements are based on estimates and opinions of management at the date the statements are made. The Company does not undertake any obligation to update forward-looking statements except as required by applicable securities laws. Investors should not place undue reliance on forward-looking statements.
VANCOUVER, British Columbia, July 27, 2023 (GLOBE NEWSWIRE) — West Red Lake Gold Mines Ltd.(“West Red Lake Gold” or “WRLG” or the “Company”) (TSXV: WRLG)(OTCQB: WRLGF) is pleased to announce the appointment of independent director, Hugh Agro, to the Company’s board of Directors.
Mr. Agro, B.Sc., MBA, P.Eng.(non-practising) has over 35 years of leadership and business experience in the mining industry. Since 2017, Mr. Agro has served as President & CEO and Director of Revival Gold Inc., a U.S. focused gold exploration and development company. Prior to Revival Gold Inc., Mr. Agro co-founded Carbon Arc Capital Investments Inc., a private-equity backed investor in mining and metals and served as Executive Vice President, Strategic Development with Kinross Gold Corporation. At Kinross, Mr. Agro was a member of the Executive Leadership Team and responsible for strategic and operational leadership of Kinross’ growth initiatives including corporate development, global exploration and commercial activities in Russia. Previously, Mr. Agro held senior executive positions with Placer Dome and in investment banking with Deutsche Bank’s Global Metals and Mining Group. Mr. Agro has served on the Board and Audit Committees of Victoria Gold Corp., Chantrell Ventures and Americas Silver Corp. and currently serves as a Director of Fort Berens Estate Winery Ltd., an award-winning winery located in British Columbia, Canada. Mr. Agro holds a Bachelor of Science in Mining Engineering from Queen’s University (1989) and MBA Finance from UBC & London Business School (1997).
The appointment of Mr. Agro follows the resignation of Mr. Rob van Egmond from its Board of Directors effective 26, 2023. The Company would like to thank Mr. van Egmond for his contributions to the Company’s success to date.
Shane Williams, President and CEO comments, “We are delighted to welcome Hugh Agro to the West Red Lake Gold team. His qualifications and skillset expand the Board’s expertise as he brings a wealth of experience in executive leadership, strategy, technical expertise and finance. He will be a significant contributor to the expansion and development of West Red Lake Gold’s future.”
The Company has granted 400,000 stock options to Mr. Agro, which vest over a three year period with 25% vesting in 3 months from the grant date and 25% vesting on the first, second and third anniversary of the grant date at an exercise price of $0.69 and will be exercisable for a 5 year period expiring July 26, 2028.
In addition, 100,000 DSUs have been granted to Mr. Agro which will vest on the first anniversary of the grant date of July 26, 2023.
Further to its news release of July 6, 2023, the Company is pleased to announce that due to excess demand, it has increased its non-brokered flow-through private placement financing to $7,000,000 by the issuance of up to 10,000,000 flow-through shares at $0.70 per flow-through share (the “Offering”). The Offering is subject to TSXV approval. The Company intends to use the proceeds from the Offering for the exploration and advancement of its properties in Red Lake, Ontario.
ABOUT WEST RED LAKE GOLD MINES
West Red Lake Gold Mines Ltd. is a mineral exploration company that is publicly traded and focused on advancing and developing its flagship Madsen Gold Mine and the associated 47 Km2 highly prospective land package in the Red Lake district of Ontario. The highly productive Red Lake Gold District of Northwest Ontario, Canada has yielded over 30 million ounces of gold from high-grade zones and hosts some of the world’s richest gold deposits. WRLG also holds the wholly owned Rowan Property in Red Lake, with an expansive property position covering 31 Km2 including three past producing gold mines – Rowan, Mount Jamie and Red Summit.
ON BEHALF OF WEST RED LAKE GOLD MINES LTD.
“Shane Williams”
Shane Williams President & Chief Executive Officer
Neither the TSX Venture Exchange nor its Regulation Services Provider (as that term is defined in the policies of the TSX Venture Exchange) accepts responsibility for the adequacy or accuracy of this release.
Certain statements contained in this news release constitute “forward-looking statements”. When used in this document, the words “anticipated”, “expect”, “estimated”, “forecast”, “planned”, and similar expressions are intended to identify forward-looking statements or information. These statements are based on current expectations of management, however, they are subject to known and unknown risks, uncertainties and other factors that may cause actual results to differ materially from the forward-looking statements in this news release. Readers are cautioned not to place undue reliance on these statements. West Red Lake Gold Mines Ltd. does not undertake any obligation to revise or update any forward- looking statements as a result of new information, future events or otherwise after the date hereof, except as required by securities laws.
Costa Fuego Copper-Gold Project Preliminary Economic Assessment (PEA)1 Outlines One of World’s Lowest Capital Intensity, Major Copper Developments
Strong Economics: Costa Fuego PEA delivers using an 8% discount rate and long-term metal price assumptions of US$3.85/lb copper (Cu) and US$1,750/oz gold (Au)
Base-case post-tax Net Present Value (NPV8%) of US$1.10 Billion (approximately, within a range of US$733 Million to US$1.46 Billion) and Internal Rate of Return (IRR) of 21% (approximately, within a range of 17% to 25%)
Low Start-up Capital: US$1.05 Billion estimated, resulting in fast 3.5-year payback. Initial phases of open pit mining fully fund development of a bulk underground operation
Low Capital Intensity: One of the lowest capital intensities of global copper development projects
Approximately 112 ktpa Average CuEq2 Production Rate: Including 95 kt Cu and 49 koz Au during primary production (first 14 years) at C1 Cash Cost[3] of US$1.33/lb (estimated, net of by-product credits)
Initial Mine Life: 16-years with 1.41 Mt Cu and 718 koz Au produced for total revenue of approximately US$13.52 Billion and total free cash flow of approximately US$3.28 Billion (post-tax, after operating costs, capital costs, and royalties)
US$15 Million Investment Agreement with Osisko Gold Royalties
Strong endorsement from a leading North American royalty-streaming group with funds to be used to advance the Costa Fuego Pre-feasibility Studies (PFS), resource growth drilling programmes and general project advancement.
30,000 m drilling program across multiple targets to commence shortly
Single, Large Pit Scenario for Cortadera being studied in H2 2023
Strong Cash balance of $26 million
__________________________
1 The PEA is preliminary in nature and includes 3% of production feed from Inferred Mineral Resources that are considered too speculative geologically to have the economic considerations applied to them that would enable them to be categorised as Mineral Reserves (NI 43-101) or Ore Reserves (JORC 2012), and there is no certainty that the PEA will be realised. Mineral Resources that are not Mineral Reserves or Ore Reserves do not have demonstrated economic viability. References to “Mineral Reserves” in this announcement include Ore Reserves (JORC 2012). See page 39 for additional cautionary language. 2 The copper-equivalent (CuEq) annual production rate was based on the combined processing feed (across all sources) and used long-term commodity prices of: Copper US$3.85/lb, Gold US$1,750/oz, Molybdenum US$17/lb, and Silver US$21/oz; and estimated metallurgical recoveries for the production feed to the following processes: Concentrator (87% Cu, 56% Au, 37% Ag, 58% Mo), Oxide Leach (55% Cu only), & Low-grade Sulphide Leach (40% Cu only). 3 See page 16 for full non-IFRS measures disclaimer.
Hot Chili’s Managing Director and Chief Executive Officer Mr Christian Easterday is responsible for this announcement and has provided sign-off for release to the ASX and TSXV.
The Preliminary Economic Assessment referred to in this report is equivalent to a Scoping Study under JORC Code (2012) reporting guidelines. It has been undertaken for the purpose of initial evaluation of a potential development of the Costa Fuego Copper Project in Chile. It is a preliminary technical and economic study of the potential viability of the Costa Fuego Copper Project. The PEA outcomes, production target and forecast financial information referred to in the report are based on low level technical and economic assessments that are insufficient to support estimation of Ore Reserves. The PEA is presented in US dollars to an accuracy level of +/- 35%. While each of the modifying factors was considered and applied, there is no certainty of eventual conversion to Ore Reserves or that the production target itself will be realised. Further exploration and evaluation and appropriate studies are required before Hot Chili will be in a position to estimate any Ore Reserves or to provide any assurance of any economic development case. Given the uncertainties involved, investors should not make any investment decisions based solely on the results of the PEA.
Of the Mineral Resources scheduled for extraction in the PEA production plan, approximately 97% are classified as Indicated and 3% as Inferred during the 18-year evaluation period. The Company has concluded that it has reasonable grounds for disclosing a production target which includes a small amount of Inferred Mineral Resources. There is a low level of geological confidence associated with Inferred Mineral Resources and there is no certainty that further exploration work will result in the determination of Indicated Mineral Resources or that the production target itself will be realised. Inferred Mineral Resources comprise 2.5% of the production schedule in the first four years of operation. The viability of the development scenario envisaged in the PEA does not depend on the inclusion of Inferred Mineral Resources.
The Mineral Resources underpinning the production target in the PEA have been prepared by a competent person in accordance with the requirements of the JORC 2012. For full details on the Mineral Resource estimate, please refer to the ASX announcement of 31 March 2022. Hot Chili confirms that it is not aware of any new information or data that materially affects the information included in that release and that all material assumptions and technical parameters underpinning the estimate continue to apply and have not been changed.
To achieve the outcomes indicated in the PEA, including reaching Definitive Feasibility Study (“DFS”) stage, funding in the order of US$1.10 Billion will be required, including pre-production and working capital and assumed financing charges. Investors should note that that there is no certainty that Hot Chili will be able to raise that amount of funding when needed. One of the key assumptions is that the funding for the Project will be available when required. It is also possible that such funding may only be available on terms that may be dilutive to or otherwise affect the value of Hot Chili’s existing shares. It is also possible that Hot Chili could pursue other value realisation strategies such as debt financing, a sale or partial sale of its interest in the Costa Fuego Copper Project, sale of further royalties and/or streaming rights, sale of non-committed offtake rights, and sale of non-core assets.
This report contains forward-looking statements. Hot Chili has concluded that it has a reasonable basis for providing these forward-looking statements and believes it has a reasonable basis to expect it will be able to fund development of the Costa Fuego Copper Project. However, a number of factors could cause actual results or expectations to differ materially from the results expressed or implied in the forward-looking statements. Given the uncertainties involved, investors should not make any investment decisions based solely of the results of the PEA.
SUMMARY OF OPERATIONAL ACTIVITIES
Costa Fuego Copper-Gold Project Preliminary Economic Assessment (PEA)1 Outlines One of World’s Lowest Capital Intensity, Major Copper Developments
The Costa Fuego PEA has been prepared by Wood Australia Pty. Ltd. as an update to the historical Productora 2016 Pre-Feasibility Study (the “2016 PFS”). It follows significant regional consolidation and a near quadrupling of the Company’s resource inventory with the addition of the Cortadera porphyry resource, and the San Antonio high-grade satellite resource. The expanded resource base provided the opportunity to lift the scale of development for a combined development hub (Costa Fuego) and optimise infrastructure required to transport these resources to a proposed centralised processing plant at Productora. The PEA therefore presents a materially different project to that contemplated in the 2016 PFS.
The Costa Fuego PEA presents the largest copper development project listed on the Australian Securities Exchange (ASX). Already the ASX’s largest copper development resource, the PEA confirms Costa Fuego as having the largest potential copper production in the exchange’s development pipeline, (refer to ASX Announcement “Costa Fuego PEA Presentation”, released 28th June 2023, slide 51 “New Material Copper Supply”) at a time when the ASX is losing its significant copper-players, with Oz Minerals taken over by diversified-miner BHP and Newcrest under takeover by US-based Newmont.
The strong economics of Costa Fuego are described below in Table 1, using financial assumptions of an 8% discount rate and long-term metal price assumptions for the base case of US$3.85/lb copper (Cu) and US$1,750/oz gold (Au).
__________________________
1 The PEA is preliminary in nature and includes 3% of production feed from Inferred Mineral Resources that are considered too speculative geologically to have the economic considerations applied to them that would enable them to be categorised as Mineral Reserves (NI 43-101) or Ore Reserves (JORC 2012), and there is no certainty that the PEA will be realised. Mineral Resources that are not Mineral Reserves or Ore Reserves do not have demonstrated economic viability. References to “Mineral Reserves” in this announcement include Ore Reserves (JORC 2012). See page 19 for additional cautionary language.
Table 1. Copper Price Ranges: Lower-, Base-, and Upper-Case Scenarios1,2
Project Metric
Units
Copper Price
Lower(US$3.50/lb)
Base(US$3.85/lb)
Upper(US$4.20/lb)
Pre-Tax
NPV8%
US$M
1,046
1,540
2,029
IRR
%
19 %
24 %
29 %
Post-Tax
NPV8%
US$M
733
1,100
1,463
IRR
%
17 %
21 %
25 %
Annual Average Revenue
US$M
779
845
911
Annual Average EBITDA
US$M
384
445
506
Annual Average Free Cash Flow
US$M
226
271
315
Payback period (From First Production)
years
4.25
3.50
3.25
Post-Tax NPV8% /Start-up Capital
0.7
1.1
1.4
Within the base-case scenario of the PEA, the positive economics shown in Table 2 outline a project that leverages its low-elevation advantage to achieve low start-up capital costs and consequently one of the lowest capital intensities of global copper development projects at this scale. Annual average revenue of around US$845 Million allow the project to achieve a fast 3.5-year payback on the back of initial open pit mining that fully funds the project expansion and development of underground bulk mining.
______________________________
1 Certain terms of measurement used in this news release are not performance measures reported in accordance with International Financial Reporting Standards (“IFRS”). Non-IFRS terms measures used such as “Cash Cost”, “All-in Sustaining Costs”, “C1”, “Expansion Costs”, “Free Cashflow” and “All-in costs” are included because these statistics are measures that management uses internally to evaluate performance, to assess how the Project ranks against its peer projects and to assess the overall effectiveness and efficiency of the contemplated mining operations. These performance measures do not have a meaning within IFRS and, therefore, amounts presented may not be comparable to similar data presented by other mining companies. These performance measures should not be considered in isolation as a substitute for measures of performance in accordance with IFRS.
2 The PEA is preliminary in nature and includes 3% of production feed from Inferred Mineral Resources that are considered too speculative geologically to have the economic considerations applied to them that would enable them to be categorised as Mineral Reserves, and there is no certainty that the PEA will be realised. Mineral Resources that are not Mineral Reserves do not have demonstrated economic viability. See page 19 for additional cautionary language.
Table 2: Costa Fuego PEA1Economic Highlights2– Base Case
Project Metric
Units
Estimated Value
Financial Measures
Pre-tax
Cu US$3.85/lb
NPV8%
US$M
1,540
IRR
%
24
Post-tax
Cu US$3.85/lb
NPV8%
US$M
1,100
IRR
%
21
Payback period (from start of operations)
years
3.5
Open Pit Strip Ratio
W/P
1.8
Post-tax NPV/Start-up Capex
Ratio
1.1
Capital Costs Costs2
Total Pre-production Capital Expenditure
US$M
1,046
Expansion
US$M
708
Sustaining
US$M
1,014
Total
US$M
2,768
Operating Costs2
C1
$/lb Cu
1.33
Total Cash Cost (net by-products and including royalties)
$/lb Cu
1.43
All-in-Sustaining Cost
$/lb Cu
1.74
All-In Cost LOM
$/lb Cu
2.31
Mine Life & Metal Production
Primary Mine Production Including Ramp-up
years
14
Mine Life (Life of Mine Processing)
years
16
Primary Mine Production – Average Annual Copper Equivalent Metal[9]
kt
112
Primary Mine Production – Average Annual Copper Metal
kt
95
Primary Mine Production – Average Annual Gold Metal
koz
49
Following the pre-production Capital Cost of around US$1.05 Billion, operations are expanded to access the remaining deposits at an estimated Capital Cost of US$708 Million, with Sustaining Capital Costs bringing the total project Capital Cost to around US$2.77 Billion. Capital Cost incorporated a 20% contingency, with further contingency applied to the mining pit shells, which were developed using a copper price of US$3.30/lb to hedge against downside price risk impacting the production feed inventory.
Operating costs for Costa Fuego average (estimated net of by-products) a C1 Cash Cost of US$1.33/lb of copper, with an approximate average production rate of 112 ktpa CuEq4: Including 95 kt Cu and 49 koz Au during primary production (first 14 years).
__________________________
1 The PEA is preliminary in nature and includes 3% of production feed from Inferred Mineral Resources that are considered too speculative geologically to have the economic considerations applied to them that would enable them to be categorised as Mineral Reserves, and there is no certainty that the PEA will be realised. Mineral Resources that are not Mineral Reserves do not have demonstrated economic viability. See page 39 for additional cautionary language.
2 Certain terms of measurement used in this news release are not performance measures reported in accordance with International Financial Reporting Standards (“IFRS”). See page 40 for full non-IFRS measures disclaimer.
3 Includes Payability
4 The copper-equivalent (CuEq) annual production rate was based on the combined processing feed (across all sources) and used long-term commodity prices of: Copper US$3.85/lb, Gold US$1,750/oz, Molybdenum US$17/lb, and Silver US$21/oz; and estimated metallurgical recoveries for the production feed to the following processes: Concentrator (87% Cu, 56% Au, 37% Ag, 58% Mo), Oxide Leach (55% Cu only), & Low-grade Sulphide Leach (40% Cu only).
The Costa Fuego life-of-mine processing runs for 16-years, producing an estimated 1.41 Mt of copper and 718 koz of gold (plus 22 kt of molybdenum and 1.7 Moz of silver) for total revenue of approximately US$13.52 Billion and total free cash flow of approximately US$3.28 Billion (post-tax, after operating costs, capital costs, and royalties)
Revenues from the PEA metal payload are described in Table 3 below, with 85% of revenue deriving from copper. Costa Fuego is highly leveraged to the copper price, with analysis identifying that for every US$0.10/lb increase above US$ 3.85/lb Cu price, US$100 Million (approximately) is added in post-tax NPV8%
Table 3: Costa Fuego Revenue Breakdown1
LOM Revenue Contribution
Revenue (US$M)
% of Total
Copper in Concentrate
10,342
76 %
Copper Cathode
1,218
9 %
Gold
1,132
8 %
Molybdenum
799
6 %
Silver
32
0.2 %
Total
13,523
100 %
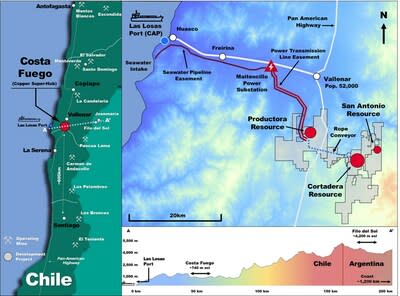
Hot Chili has been systematic in its approach to de-risking the project with over a decade of work in consolidating the deposits and securing infrastructure easements and surface rights. Costa Fuego is one of the very few projects globally that holds a granted water permit, approval for power connection to the national grid and the necessary easement corridors for water and power infrastructure that would support the advancement of the project to construction.
30,000 m drilling program across multiple targets to commence shortly
The Company plans to rapidly begin drilling high priority growth targets proximal to the current resource. Drilling will also test promising greenfield targets as shown in Figure 1. Further strategic regional consolidation options are concurrently being pursued, with mineral resource estimate upgrades expected in Q4 2023 and H1 2025.
_________________________________
1 Includes Payability
Figure 1. Exploration Growth Targets Across the Costa Fuego Project
Figure 1. Exploration Growth Targets Across the Costa Fuego Project (CNW Group/Hot Chili Limited)
Figure 2. Cortadera Porphyry Expansion Targets1
Figure 2. Cortadera Porphyry Expansion Targets (CNW Group/Hot Chili Limited)
Figure 2. Cortadera Porphyry Expansion Targets (CNW Group/Hot Chili Limited)
______________________________________
1 Refer to announcement dated 28th August 2019 for further information regarding Induced Polarisation (IP/MT– MIMDAS) Survey. * Resource Copper Equivalent (CuEq) considers assumed commodity prices and average metallurgical recoveries for the Mineral Resource from testwork. See Page 43 for complete Mineral Resource disclosure of Costa Fuego.
Single, Large Pit Scenario for Cortadera being studied in H2 2023
The Company is investigating a large single open pit scenario for Cortadera (no underground block cave) with the potential to materially increase processing feed inventory and mine-life.
This scenario would necessitate a second PEA, studied while refining of the model inputs for metallurgy, geotechnical engineering and hydrogeology, to be incorporated into the Pre-feasibility. Once both PEA scenarios are assessed, the Company would select a single scenario to complete the final stages of its PFS for Costa Fuego, which is expected to be completed by H2 2024.
SUMMARY OF CORPORATE ACTIVITIES
US$15 Million Investment Agreement with Osisko Gold Royalties
The significant investment by Osisko provides strong endorsement from one of North America’s leading royalty-streaming groups. The key elements of the royalty agreement, which closed in late July, are:
US$15 million in funds for growth and development with the investment (Royalty Consideration) to be used to advance the Costa Fuego Pre-Feasibility Studies (PFS), resource growth drilling programmes and for the general advancement of the Project
Clear “look-through” value given the Osisko NSR is equivalent to a 1.12% CuEq1 NSR royalty across payable metals for US$15 million and Hot Chili’s market capitalisation at the time of announcing the royalty was US$80 million
Buyback rights if a change of control event occurs prior to the fourth anniversary of Closing. The Osisko NSR can be reduced to 0.5% NSR royalty on copper and 2.5% NSR royalty on gold
Osisko to have a Right of First Offer (ROFO) with respect to the sale of any future royalty, stream, or similar interests by Hot Chili
Development and Growth Funding
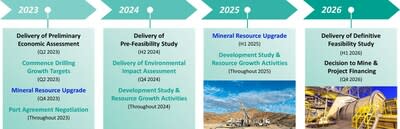
The Investment by Osisko has strengthened the Company’s cash position to approximately A$26 million and the project is now fully funded for the next 12 to 18 months to deliver the next steps in its growth and development plan, (refer Figure 3) including:
Commencement of 30,000 m drill program – preparations well-advanced, drilling operations set to commence in the coming week.
Completion of Costa Fuego resource upgrade by late 2023.
Delivery of Costa Fuego PFS by H2 2024 – The Company has already considerably advanced its PFS (approximately 80% complete) with minimal expenditure required for completion.
____________________________
1 CuEq considers assumed commodity prices and average metallurgical recoveries from test work. See qualifying statements on page 19.
Figure 3. Costa Fuego Project Roadmap1
Figure 3. Costa Fuego Project Roadmap (CNW Group/Hot Chili Limited)
Figure 4. Location of the Costa Fuego Project Regionally in Relation to Key Infrastructure
Figure 4. Location of the Costa Fuego Project Regionally in Relation to Key Infrastructure (CNW Group/Hot Chili Limited)
______________________________
1 The Mining Project delivery schedule mentioned herein is subject to various risks inherent to the mining industry, and external factors beyond the control of the project stakeholders, including but not limited to, geological and processing challenges, government policies, permits, or regulations, fluctuations in commodity prices, or market conditions. These external factors can impact the Project timeline and potentially result in delays. The delivery schedule provided is based on the best estimates and assumptions available at the time of its creation, and the Project team is committed to minimising disruptions and implementing mitigation measures to the best of their abilities. However, the effectiveness of these measures in avoiding delays cannot be guaranteed.
Drill Results Reported for Costa Fuego in Quarter 2 2023
No further drilling has been completed in Q2, subsequently there are no details to report.
Additional ASX Disclosure Information
ASX Listing Rule 5.3.2: There was no substantive mining production and development activities during the quarter.
ASX Listing Rule 5.3.3 – Schedule of Mineral Tenements as at 30 June 2023
The schedule of Mineral Tenements and changes in interests is appended at the end of this activities report.
ASX Listing Rule 5.3.4: Reporting under a use of funds statement in a Prospectus does not apply to the Company currently.
ASX Listing Rule 5.3.5: Payments to related parties of the Company and their associates during the quarter per Section 6.1 of the Appendix 5B totaled $151,667. This is comprised of directors’ salaries and superannuation of $151,667.
Health, Safety, Environment and Quality
Field operations during the period included geological reconnaissance activities, core-testing and logging, field mapping, and sampling exercises across the Cortadera, El Fuego and Productora landholdings. El Fuego field activities are run from the Cortadera operations centre and safety statistics are combined for reporting.
No safety incidents were recorded during the quarter. The Company’s HSEQ quarterly performance is summarised in Table 3 below.
Hot Chili’s sustainability framework ensures an emphasis on business processes that target long-term economic, environmental and social value. The Company is dedicated to continual monitoring and improvement of health, safety and the environmental systems. There is no greater importance than ensuring the safety of our people and their families.
Table 3 HSEQ Quarter 1 2023 Performance and Statistics
Deposit
Productora
Cortadera
Las Cañas
Timeframe
Q2 2023
Cum.
Q2 2023
Cum.
Q2 2023
Cum.
LTI events
0
0
0
6
0
1
NLTI events
0
2
0
5
0
1
Days lost
0
0
0
152
0
23
LTIFR index
0
0
0
24
0
170
ISR index
0
0
0
596
0
3,898
IFR Index
0
39
0
43
0
339
Thousands of manhours¹
2.1
51.2
7.9
257
0
5.9
Incidents on materials and assets
0
0
0
0
0
0
Environmental incidents
0
0
0
0
0
0
Headcount²
4
11
15
37
0
21
Notes: HSEQ is the acronym for Health, Safety, Environment and Quality. LTIFR per million-manhours. Safety performance is reported on a monthly basis to the National Mine Safety Authority on a standard E-100 form; (1) manhours; (2) Average monthly headcount (3) Cumulative statistics since April 2019.
Tenement Changes During the Quarter
During the Quarter, the Company has renewed the mining exploration concessions Porfiada I (replaces Porfiada I, which expired on June, 14th, 2023), Porfiada II (replaces Porfiada II, which expired on July, 5th, 2023), Porfiada III (replaces Porfiada III, which expired on June, 15th, 2023) and Porfiada IV (replaces Porfiada IV, which expired on July, 5th, 2023).
The Company’s existing tenements are detailed in the table below.
Table 4. Current Tenement (Patente) Holdings in Chile as at 30 June 2023
Cortadera Project
License ID
HCH % Held
HCH % Earning
Area (ha)
Agreement Details
MAGDALENITA 1/20
100% Frontera SpA
100
ATACAMITA 1/82
100% Frontera SpA
82
AMALIA 942 A 1/6
100% Frontera SpA
53
PAULINA 10 B 1/16
100% Frontera SpA
136
PAULINA 11 B 1/30
100% Frontera SpA
249
PAULINA 12 B 1/30
100% Frontera SpA
294
PAULINA 13 B 1/30
100% Frontera SpA
264
PAULINA 14 B 1/30
100% Frontera SpA
265
PAULINA 15 B 1/30
100% Frontera SpA
200
PAULINA 22 A 1/30
100% Frontera SpA
300
PAULINA 24 1/24
100% Frontera SpA
183
PAULINA 25 A 1/19
100% Frontera SpA
156
PAULINA 26 A 1/30
100% Frontera SpA
294
PAULINA 27A 1/30
100% Frontera SpA
300
CORTADERA 1 1/200
100% Frontera SpA
200
CORTADERA 2 1/200
100% Frontera SpA
200
CORTADERA 41
100% Frontera SpA
1
CORTADERA 42
100% Frontera SpA
1
LAS CANAS 16
100% Frontera SpA
1
LAS CANAS 1/15
100% Frontera SpA
146
CORTADERA 1/40
100% Frontera SpA
374
LAS CANAS ESTE 2003 1/30
100% Frontera SpA
300
CORROTEO 1 1/260
100% Frontera SpA
260
CORROTEO 5 1/261
100% Frontera SpA
261
ROMERO 1 AL 31
100% Frontera SpA
31
PURISIMA
100% Frontera SpA
20
NSR 1.5%
Note. Frontera SpA is a 100% owned subsidiary company of Hot Chili Limited
Productora Project
License ID
HCH % Held
HCH % Earning
Area (ha)
Agreement Details
FRAN 1, 1-60
80% SMEA SpA
220
FRAN 2, 1-20
80% SMEA SpA
100
FRAN 3, 1-20
80% SMEA SpA
100
FRAN 4, 1-20
80% SMEA SpA
100
FRAN 5, 1-20
80% SMEA SpA
100
FRAN 6, 1-26
80% SMEA SpA
130
FRAN 7, 1-37
80% SMEA SpA
176
FRAN 8, 1-30
80% SMEA SpA
120
FRAN 12, 1-40
80% SMEA SpA
200
FRAN 13, 1-40
80% SMEA SpA
200
FRAN 14, 1-40
80% SMEA SpA
200
FRAN 15, 1-60
80% SMEA SpA
300
FRAN 18, 1-60
80% SMEA SpA
273
FRAN 21, 1-46
80% SMEA SpA
226
ALGA 7A, 1-32
80% SMEA SpA
89
ALGA VI, 5-24
80% SMEA SpA
66
MONTOSA 1-4
80% SMEA SpA
35
NSR 3%
CHICA
80% SMEA SpA
1
ESPERANZA 1-5
80% SMEA SpA
11
LEONA 2A 1-4
80% SMEA SpA
10
CARMEN I, 1-50
80% SMEA SpA
222
CARMEN II, 1-60
80% SMEA SpA
274
ZAPA 1, 1-10
80% SMEA SpA
100
ZAPA 3, 1-23
80% SMEA SpA
92
ZAPA 5A, 1-16
80% SMEA SpA
80
ZAPA 7, 1-24
80% SMEA SpA
120
CABRITO, CABRITO 1-9
80% SMEA SpA
50
CUENCA A, 1-51
80% SMEA SpA
255
CUENCA B, 1-28
80% SMEA SpA
139
CUENCA C, 1-51
80% SMEA SpA
255
CUENCA D
80% SMEA SpA
3
CUENCA E
80% SMEA SpA
1
CHOAPA 1-10
80% SMEA SpA
50
ELQUI 1-14
80% SMEA SpA
61
LIMARÍ 1-15
80% SMEA SpA
66
LOA 1-6
80% SMEA SpA
30
MAIPO 1-10
80% SMEA SpA
50
TOLTÉN 1-14
80% SMEA SpA
70
CACHIYUYITO 1, 1-20
80% SMEA SpA
100
CACHIYUYITO 2, 1-60
80% SMEA SpA
300
CACHIYUYITO 3, 1-60
80% SMEA SpA
300
LA PRODUCTORA 1-16
80% SMEA SpA
75
ORO INDIO 1A, 1-20
80% SMEA SpA
82
AURO HUASCO I, 1-8
80% SMEA SpA
35
URANIO, 1-70
0 %
0 %
350
25-year Lease AgreementUS$250,000 per year (average for the 25 year term); plus 2% NSR all but gold; 4% NSR gold; 5% NSR non-metallic
JULI 9, 1-60
80% SMEA SpA
300
JULI 10, 1-60
80% SMEA SpA
300
JULI 11 1/60
80% SMEA SpA
300
JULI 12 1/42
80% SMEA SpA
210
JULI 13 1/20
80% SMEA SpA
100
JULI 14 1/50
80% SMEA SpA
250
JULI 15 1/55
80% SMEA SpA
275
JULI 16, 1-60
80% SMEA SpA
300
JULI 17, 1-20
80% SMEA SpA
100
JULI 19
80% SMEA SpA
300
JULI 20
80% SMEA SpA
300
JULI 21 1/60
80% SMEA SpA
300
JULI 22
80% SMEA SpA
300
JULI 23 1/60
80% SMEA SpA
300
JULI 24, 1-60
80% SMEA SpA
300
JULI 25
80% SMEA SpA
300
JULI 27 1/30
80% SMEA SpA
150
JULI 27 B 1/10
80% SMEA SpA
50
JULI 28 1/60
80% SMEA SpA
300
JULIETA 5
80% SMEA SpA
200
JULIETA 6
80% SMEA SpA
200
JULIETA 7
80% SMEA SpA
100
JULIETA 8
80% SMEA SpA
100
JULIETA 9
80% SMEA SpA
100
JULIETA 10 1/60
80% SMEA SpA
300
JULIETA 11
80% SMEA SpA
300
JULIETA 12
80% SMEA SpA
300
JULIETA 13, 1-60
80% SMEA SpA
298
JULIETA 14, 1-60
80% SMEA SpA
269
JULIETA 15, 1-40
80% SMEA SpA
200
JULIETA 16
80% SMEA SpA
200
JULIETA 17
80% SMEA SpA
200
JULIETA 18, 1-40
80% SMEA SpA
200
ARENA 1 1-6
80% SMEA SpA
40
ARENA 2 1-17
80% SMEA SpA
113
ZAPA 1 – 6
80% SMEA SpA
6
GSR 1%
JULIETA 1-4
80% SMEA SpA
4
Note. SMEA SpA is subsidiary company – 80% owned by Hot Chili Limited, 20% owned by CMP (Compañía Minera del Pacífico)
El Fuego Project
Licence ID
HCH % Held
HCH % Earning
Area (ha)
Exploration and Expenditure Commitment- Payments
Santiago 21 al 36
90% Frontera SpA
76
90% (HCH)-10% (Arnaldo del Campo) JV.6-year term.USD 300,000 already paid.USD 300,000 to be paid by September 7, 2023USD 6,600,000 final exercise payment to be paid by September 7, 2024.
Santiago 37 al 43
90% Frontera SpA
26
Santiago A, 1 al 26
90% Frontera SpA
236
Santiago B, 1 al 20
90% Frontera SpA
200
Santiago C, 1 al 30
90% Frontera SpA
300
Santiago D, 1 al 30
90% Frontera SpA
300
Santiago E, 1 al 30
90% Frontera SpA
300
Prima Uno
90% Frontera SpA
1
Prima Dos
90% Frontera SpA
2
Santiago 15 al 19
90% Frontera SpA
25
San Antonio 1 al 5
90% Frontera SpA
25
Santiago 1 AL 14 Y 20
90% Frontera SpA
75
Mercedes 1 al 3
90% Frontera SpA
50
Kreta 1 al 4
90% Frontera SpA
16
Mari 1 al 12
90% Frontera SpA
64
PORFIADA VII
90% Frontera SpA
300
PORFIADA VIII
90% Frontera SpA
300
PORFIADA IX
90% Frontera SpA
300
PORFIADA X
90% Frontera SpA
200
PORFIADA A
90% Frontera SpA
200
PORFIADA B
90% Frontera SpA
300
PORFIADA C
90% Frontera SpA
300
PORFIADA D
90% Frontera SpA
300
PORFIADA E
90% Frontera SpA
300
PORFIADA F
90% Frontera SpA
300
PORFIADA G
90% Frontera SpA
200
CORTADERA 1
100% Frontera SpA
200
CORTADERA 2
100% Frontera SpA
200
CORTADERA 3
100% Frontera SpA
200
CORTADERA 4
100% Frontera SpA
200
CORTADERA 5
100% Frontera SpA
200
CORTADERA 6
100% Frontera SpA
300
CORTADERA 7, 1-20
100% Frontera SpA
93
SAN ANTONIO 1
100% Frontera SpA
200
SAN ANTONIO 2
100% Frontera SpA
200
SAN ANTONIO 3
100% Frontera SpA
300
SAN ANTONIO 4
100% Frontera SpA
300
SAN ANTONIO 5
100% Frontera SpA
300
DORO 1
100% Frontera SpA
200
DORO 2
100% Frontera SpA
200
DORO 3
100% Frontera SpA
300
SANTIAGO Z 1/30
100% Frontera SpA
300
100% HCH Purchase Option AgreementUSD 200,000 already paid.USD 400,000 to be paid by January 22, 2024.NSR 1.5%
PORFIADA I
100% Frontera SpA
300
PORFIADA II
100% Frontera SpA
300
PORFIADA III
100% Frontera SpA
300
PORFIADA IV
100% Frontera SpA
300
PORFIADA V
100% Frontera SpA
200
PORFIADA VI
100% Frontera SpA
100
SAN JUAN SUR 1/5
90% Frontera SpA
10
90% (HCH) Option AgreementUSD 150,000 already paidUSD 4,000,000 by June 1, 2024.
SAN JUAN SUR 6/23
90% Frontera SpA
90
CHILIS 1
100% Frontera SpA
200
CHILIS 2
100% Frontera SpA
200
CHILIS 3
100% Frontera SpA
100
CHILIS 4
100% Frontera SpA
200
CHILIS 5
100% Frontera SpA
200
CHILIS 6
100% Frontera SpA
200
CHILIS 7
100% Frontera SpA
200
CHILIS 8
100% Frontera SpA
200
CHILIS 9
100% Frontera SpA
300
CHILIS 10
100% Frontera SpA
200
CHILIS 11
100% Frontera SpA
200
CHILIS 12
100% Frontera SpA
300
CHILIS 13
100% Frontera SpA
300
CHILIS 14
100% Frontera SpA
300
CHILIS 15
100% Frontera SpA
300
CHILIS 16
100% Frontera SpA
300
CHILIS 17
100% Frontera SpA
300
CHILIS 18
100% Frontera SpA
300
SOLAR 1
100% Frontera SpA
300
SOLAR 2
100% Frontera SpA
300
SOLAR 3
100% Frontera SpA
300
SOLAR 4
100% Frontera SpA
300
SOLAR 5
100% Frontera SpA
300
SOLAR 6
100% Frontera SpA
300
SOLAR 7
100% Frontera SpA
300
SOLAR 8
100% Frontera SpA
300
SOLAR 9
100% Frontera SpA
300
SOLAR 10
100% Frontera SpA
300
SOLEDAD 1
100% Frontera SpA
300
SOLEDAD 2
100% Frontera SpA
300
SOLEDAD 3
100% Frontera SpA
300
SOLEDAD 4
100% Frontera SpA
300
CF 1
100% Frontera SpA
300
CF 2
100% Frontera SpA
300
CF 3
100% Frontera SpA
300
CF 4
100% Frontera SpA
300
CF 5
100% Frontera SpA
300
CHAPULIN COLORADO 1/3
100% Frontera SpA
3
PEGGY SUE 1/10
100% Frontera SpA
100
DONA FELIPA
100% Frontera SpA
50
ELEANOR RIGBY 1/10
100% Frontera SpA
100
CF 6
100% Frontera SpA
200
CF 7
100% Frontera SpA
100
CF 8
100% Frontera SpA
200
CF 9
100% Frontera SpA
100
MARI 1
100% Frontera SpA
300
MARI 6
100% Frontera SpA
300
MARI 8
100% Frontera SpA
300
FALLA MAIPO 2 1/10
100% Frontera SpA
99
FALLA MAIPO 3 1/8
100% Frontera SpA
72
FALLA MAIPO 4 1/26
100% Frontera SpA
26
ARBOLEDA 7 1/2
Option AMSA
234
100% HCH Purchase Option AgreementUSD 1,500,000 to be paid by November 15, 2024
NAVARRO 1 41/60
Option AMSA
81
NAVARRO 2 21/37
Option AMSA
78
MONICA 21/40
Option AMSA
85
MONICA 41/52
Option AMSA
39
Note. Frontera SpA is a 100% owned subsidiary company of Hot Chili Limited
Qualifying Statements
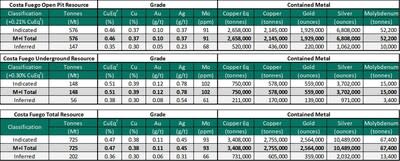
Costa Fuego Combined Mineral Resource (Effective Date 31st March 2022)
Costa Fuego Combined Mineral Resource (Effective Date 31st March 2022) (CNW Group/Hot Chili Limited)
1 Mineral Resources are reported on a 100% Basis – combining Mineral Resource estimates for the Cortadera, Productora and San Antonio deposits. All figures are rounded, reported to appropriate significant figures, and reported in accordance with the Joint Ore Reserves Committee Code (2012) and the Canadian Institute of Mining, Metallurgy and Petroleum (CIM) Standards on Mineral Resources and Reserves, Definitions and Guidelines prepared by the CIM Standing Committee on Reserve Definition, as required by National Instrument 43-101.
2 The Productora deposit is 100% owned by Chilean incorporated company Sociedad Minera El Aguila SpA (SMEA). SMEA is a joint venture (JV) company – 80% owned by Sociedad Minera El Corazón Limitada (a 100% subsidiary of Hot Chili Limited), and 20% owned by CMP Productora (a 100% subsidiary of Compañía Minera del Pacífico S.A (CMP)).
3 The Cortadera deposit is controlled by a Chilean incorporated company Sociedad Minera La Frontera SpA (Frontera). Frontera is a subsidiary company – 100% owned by Sociedad Minera El Corazón Limitada, which is a 100% subsidiary of Hot Chili Limited.
4 The San Antonio deposit is controlled through Frontera (100% owned by Sociedad Minera El Corazón Limitada, which is a 100% subsidiary of Hot Chili Limited) and has an Option Agreement with a private party to earn a 90% interest.
5 The Mineral Resource estimates in the tables above form coherent bodies of mineralisation that are considered amenable to a combination of open pit and underground extraction methods based on the following parameters: Base Case Metal Prices: Copper US$ 3.00/lb, Gold US$ 1,700/oz, Molybdenum US$ 14/lb, and Silver US$20/oz.
6 Metallurgical recovery averages for each deposit consider Indicated + Inferred material and are weighted to combine sulphide flotation and oxide leaching performance. Process recoveries: Cortadera and San Antonio – Weighted recoveries of 82% Cu, 55% Au, 82% Mo and 37% Ag. CuEq(%) = Cu(%) + 0.56 x Au(g/t) + 0.00046 x Mo(ppm) + 0.0043 x Ag(g/t). Productora – Weighted recoveries of 84% Cu, 47% Au, 47% Mo and 0% Ag (not reported). CuEq(%) = Cu(%) + 0.46 x Au(g/t) + 0.00026 x Mo(ppm). Costa Fuego – Recoveries of 83% Cu, 53% Au, 69% Mo and 23% Ag. CuEq(%) = Cu(%) + 0.52 x Au(g/t) + 0.00039 x Mo(ppm) + 0.0027 x Ag(g/t).
7 Resource Copper Equivalent (CuEq) grades are calculated based on the formula: CuEq% = ((Cu% × Cu price 1% per tonne × Cu_recovery) + (Mo ppm × Mo price per g/t × Mo_recovery)+(Au ppm × Au price per g/t × Au_recovery)+ (Ag ppm × Ag price per g/t × Ag_recovery)) / (Cu price 1% per tonne × Cu recovery). The base case cut-off grade for mineral resources considered amenable to open pit extraction methods at the Cortadera, Productora and San Antonio deposits is 0.21% CuEq while the cut-off grade for mineral resources considered amenable to underground extraction methods at the Cortadera deposit is 0.3% CuEq.
8 Mineral resources are not mineral reserves and do not have demonstrated economic viability. These Mineral Resource estimates include Inferred Mineral Resources that are considered too speculative geologically to have economic considerations applied to them that would enable them to be categorised as Mineral Reserves. It is reasonably expected that the majority of Inferred mineral resources could be upgraded to Measured or Indicated Mineral Resources with continued exploration.
9 The effective date of the estimate of Mineral Resources is March 31st, 2022. Refer to ASX Announcement “Hot Chili Delivers Next Level of Growth” (“Resource Announcement”) for JORC Code Table 1 information related to the Costa Fuego Resource Estimate (MRE) by Competent Person Elizabeth Haren, constituting the MREs of Cortadera, Productora and San Antonio (which combine to form Costa Fuego). Hot Chili confirms it is not aware of any new information or data that materially affects the information included in the Resource Announcement and all material assumptions and technical parameters stated for the Mineral Resource Estimates in the Resource Announcement continue to apply and have not materially changed.
10 Hot Chili Limited is not aware of political, environmental or other risks that could materially affect the potential development of the Mineral Resources
Competent Person’s Statement- Exploration Results
Exploration information in this Report is based upon work compiled by Mr Christian Easterday, the Managing Director and a full-time employee of Hot Chili Limited whom is a Member of the Australasian Institute of Geoscientists (AIG). Mr Easterday has sufficient experience that is relevant to the style of mineralisation and type of deposit under consideration and to the activity which he is undertaking to qualify as a ‘Competent Person’ as defined in the 2012 Edition of the ‘Australasian Code for Reporting of Exploration Results, Mineral Resources and Ore Reserves’ (JORC Code). Mr Easterday consents to the inclusion in the report of the matters based on their information in the form and context in which it appears.
Disclaimer
Neither the TSX Venture Exchange nor its Regulation Services Provider (as that term is defined in the policies of the TSX Venture Exchange) accepts responsibility for the adequacy or accuracy of this report.
This report is to be used by the recipient for informational purposes only and does not purport to be complete or contain all the information that may be material to the current or future business, operations, financial condition, or prospects of Hot Chili Limited (“Hot Chili” or the “Company”). Each recipient should perform its own independent investigation and analysis of Hot Chili, and the information contained in this report is not a substitute therefore. Hot Chili makes no representation or warranty, express or implied, as to the accuracy or completeness of the information contained in this report or in any other written or oral communication transmitted to any recipient by any party. Except for liability that cannot be disclaimed by law, by accepting this Document, the recipient agrees that neither Hot Chili nor any of its officers, directors, employees, or representatives has any liability for any representations or warranties, express or implied, contained in, or for any omissions from, this report or any such other written or oral communication from any person.
Certain information contained herein is based on, or derived from, information provided by independent third-party sources. Hot Chili believes that such information is accurate and that the sources from which it has been obtained are reliable; however, Hot Chili has not independently verified such information and does not assume any responsibility for the accuracy or completeness of such information.
This report should not be considered as a recommendation from any person to purchase any securities. Each person for whom this report is made available should consult its own professional advisors in making its own independent investigations and assessment and, after making such independent investigations and assessments, as it deems necessary, in determining whether to proceed with any investment in the Company.
Technical Report
For readers to fully understand the information in this report, they should read the PEA Technical Report prepared in accordance with National Instrument 43-101 – Standards of Disclosure for Mineral Projects (“NI 43-101”) (to be available on www.sedar.com or at www.hotchili.net.au within 45 days of June 30, 2023) in its entirety, including all qualifications, assumptions, limitations and exclusions that relate to the information set out in this report that qualifies the technical information contained in the PEA. The PEA is intended to be read as a whole, and sections should not be read or relied upon out of context. The technical information in this report is subject to the assumptions and qualifications contained in the PEA.
Qualified Persons – NI 43-101
The PEA was compiled by Wood Australia Pty Ltd with contributions from a team of independent Qualified Persons within the meaning of Canadian Securities Administrators’ National Instrument 43-101 Standards of Disclosure for Mineral Projects (“NI 43 -101”). The scientific and technical information contained in this report pertaining to Coast Fuego has been reviewed and verified by the following independent qualified persons within the meaning of NI 43-101:
Ms Elizabeth Haren (MAUSIMM (CP) & MAIG) of Haren Consulting – Mineral Resource Estimate
Mr Dean David (FAUSIMM (CP)) of Wood Pty Ltd – Metallurgy
Mr Piers Wendlandt (PE) of Wood Pty Ltd – Market Studies and Contracts, Economic Analysis
Farzard Kossari (PE) of Wood Pty Ltd – Cost Estimation
Mr Anton von Wielligh (FAUSIMM) of ABGM Consulting Pty Ltd – Mine Planning and Scheduling
The independent qualified persons have verified the information disclosed herein, including the sampling, preparation, security, and analytical procedures underlying such information.
Disclosure regarding mine planning and infrastructure has been reviewed and approved by Mr Grant King, FAUSIMM, Hot Chili’s Chief Operations Officer, and a Qualified Person within the meaning of NI43-101.
Competent Persons – JORC
The information in this report that relates to Mineral Resources for the Costa Fuego Project is based on information compiled by:
Ms Elizabeth Haren (MAUSIMM (CP) & MAIG) of Haren Consulting – Mineral Resource Estimate
Mr Dean David (FAUSIMM (CP)) of Wood Pty Ltd – Metallurgy
Mr Piers Wendlandt (PE) of Wood Pty Ltd – Market Studies and Contracts, and Economic Analysis
Mr Anton von Wielligh (FAUSIMM) of ABGM Consulting Pty Ltd – Mine Planning and Scheduling
Ms Haren, Mr David, Mr Wendlandt, Mr Kossari and Mr von Wielligh have sufficient experience, which is relevant to the style of mineralisation and types of deposits under consideration and to the activities undertaken, to qualify as a Competent Person as defined in the 2012 Edition of the ‘Australasian Code of Reporting of Exploration Results, Mineral Resources and Ore Reserves’ and as Qualified Persons under NI43-101.
For further information on the Costa Fuego Project, refer to the technical report titled “NI 43-101 Resource Report for the Costa Fuego Copper Project Located in Atacama, Chile”, dated May 13, 2022 with an effective date of March 31, 2022, which is available for review on SEDAR (www.sedar.com) under Hot Chili’s issuer profile.
Cautionary Note for U.S. Investors Concerning Mineral Resources
National Instrument 43-101 – Standards of Disclosure for Mineral Projects (“NI 43-101”) is a rule of the Canadian Securities Administrators which establishes standards for all public disclosure an issuer makes of scientific and technical information concerning mineral projects. Technical disclosure contained in this report has been prepared in accordance with NI 43-101 and the Canadian Institute of Mining, Metallurgy and Petroleum Classification System. These standards differ from the requirements of the U.S. Securities and Exchange Commission (“SEC”) and resource information contained in this press release may not be comparable to similar information disclosed by domestic United States companies subject to the SEC’s reporting and disclosure requirements.
All amounts in this report are in U.S. dollars unless otherwise noted.
Non IFRS Financial Performance Measures
“Total Cash Cost”, “All-in Sustaining Cost”, “All-in cost LOM”, “C1”, and “Free Cashflow” are not performance measures reported in accordance with International Financial Reporting Standards (“IFRS”). These performance measures are included because these statistics are key performance measures that management uses to monitor performance. Management uses these statistics to assess how the Costa Fuego Project compares against its peer projects and to assess the overall effectiveness and efficiency of the contemplated mining operations. These performance measures do not have a meaning within IFRS and, therefore, amounts presented may not be comparable to similar data presented by other mining companies. These performance measures should not be considered in isolation as a substitute for measures of performance in accordance with IFRS.
Scientific and Technical Information
The scientific and technical information contained in this document was reviewed and approved by Ms Kirsty Sheerin, a Member of the Australian Institute of Geoscientists, Hot Chili’s Resource Development Manager and a qualified person for the purposes of National Instrument 43-101 – Standards of Disclosure for Mineral Projects.
Ms Sheerin has undertaken extensive data verification and is satisfied with the exploration, sampling, security, and QA/QC procedures employed by Hot Chili for Costa Fuego and that their results are sufficient to produce data suitable for the purposes described in the technical report titled “NI 43-101 Resource Report for the Costa Fuego Copper Project Located in Atacama, Chile”, dated May 13, 2022 with an effective date of March 31, 2022, as well as for public reporting purposes subsequent to the technical report.
Sampling, Analysis and Data Verification
A fixed cone splitter was used to create two nominal 12.5% samples (Sample “A” and “B”), along with the large bulk reject sample. The “A” sample is always taken from the same sampling chute, and comprises the primary sample submitted to the laboratory. The “B” samples were retained for use as the field duplicate sample. The coarse residues were collected into large plastic bags and were retained on the ground near the drillhole collar, generally in rows of 50 bags.
All RC drillhole sampling was executed at two metre intervals for Costa Fuego. Within logged mineralisation zones, the 2-metre sample (“A” sample) was submitted. Outside the main mineralised zones (as determined by the logging geologist), 4-metre composites were created from scoops of 2-metre sample residues over this interval. The composited 4-metre samples were analysed first and, if required, the individual and original 2-metre “A” samples comprising this 4-metre interval were sent for analysis. This ensured that no mineralisation was missed while minimising analytical costs. The same procedure was applied to RC drilling undertaken across Productora, however, drillhole sampling was executed at 1-metre intervals.
At Costa Fuego, the majority of diamond core has had systematic half-core sampled at 2-metre intervals. Half-core was chosen as the preferred sampling method to ensure a representative sample was submitted for analysis, while also retaining half-core for review of lithology and mineralisation, and for further test work as required.
Prior to the cutting and sample process, two additional samples are also taken for Costa Fuego being Density and Geotechnical samples.
Density samples are selected every 30 metres if the geological conditions allow it and are provided to the laboratory for testwork.
Geotechnical samples are taken for tests including triaxial (one sample per 250 m) and uniaxial tests (one sample per 50 m).
Once assigned a sample number, individual samples to be sent to ALS laboratories were sealed using a staple gun and accompanied by three identical sample tickets (one stapled to plastic bag to identify any tampering/breakage of seal prior to opening at the laboratory in preparation and another placed in the bag). Any broken staple seals on samples were to be notified by ALS to Hot Chili. No sealed bags were reported as being opened or broken by ALS.
For both RC and diamond samples, sample bags were placed inside larger plastic bags and delivered by a dedicated truck to the ALS analytical laboratory in Coquimbo (Chile) for sample preparation and routine analysis.
Following analysis at ALS, the RC and diamond drilling coarse rejects were returned to site and stored in sequence in plastic bags under shade cloth at Hot Chili’s nearby Productora core farm. The laboratory pulps were returned and stored at the Productora core farm where they are stored in organised, dry and safe storage containers.
Hot Chili has strict chain of custody security procedures for all samples sent to and from the analytical laboratories.
The ALS analytical laboratory in Coquimbo (Chile) completed all sample preparation and specific gravity test work, while ALS Santiago (Chile) completed all gold analysis, and ALS Lima (Peru) completed all other multielement analysis for the Cortadera assays used in the resource estimate. Hot Chili has implemented rigorous sample preparation and analytical procedures for both RC and diamond core samples, following consultation with ALS in Chile, to ensure that mineralised assays were reported with a high degree of confidence and a wide range of appropriate commodities were assessed.
Samples have been analysed by certified laboratories in Chile and Lima, Peru by standard analytical techniques including:
Copper, silver and molybdenum were analysed by 4-acid digestion (Hydrochloric-Nitric- Perchloric-Hydrofluoric) followed by evaluation using Inductively Coupled Plasma – Optical Emission Spectrometry (“ICP-OES”) or Atomic Absorption Spectrometry (“AAS”);
Copper results > 10,000 ppm were analysed by “ore grade” method Cu-AA62 (upper limit 40% Cu);
Samples within the oxide and transitional weathering domains (as determined by geologists’ logging) were analysed for “soluble copper” (upper limit 10% Cu) to detect the leachability of copper oxide minerals within these domains; and
Gold was analysed by 30 or 50 g lead-collection Fire Assay, followed by ICP-OES or AAS.
The verification of input data included the use of company QA/QC blanks and reference material, field and laboratory duplicates, umpire laboratory checks and independent sample and assay verification.
The Qualified Person has assessed the drillhole database validation work and QAQC undertaken by Hot Chili and was satisfied the input data could be relied upon for the estimation of Indicated and Inferred Classified Mineral Resources.
All laboratories used are independent of Hot Chili and the work is performed under a commercial arrangement.
Forward Looking Statements
This report contains certain statements that are “forward-looking information” within the meaning of Canadian securities legislation and Australian securities legislation (each, a “forward-looking statement”). Forward-looking statements reflect the Company’s current expectations, forecasts, and projections with respect to future events, many of which are beyond the Company’s control, and are based on certain assumptions. No assurance can be given that these expectations, forecasts, or projections will prove to be correct, and such forward-looking statements included in this report should not be unduly relied upon. Forward-looking information is by its nature prospective and requires the Company to make certain assumptions and is subject to inherent risks and uncertainties. All statements other than statements of historical fact are forward-looking statements. The use of any of the words “anticipate”, “believe”, “could”, “estimate”, “expect”, “may”, “plan”, “potential”, “project”, “should”, “will”, “would” and similar expressions are intended to identify forward-looking statements.
The forward-looking statements within this report are based on information currently available and what management believes are reasonable assumptions. Forward-looking statements speak only as of the date of this report. In addition, this report may contain forward-looking statements attributed to third-party industry sources, the accuracy of which has not been verified by the Company.
In this report, forward-looking statements relate, among other things, to: prospects, projections and success of the Company and its projects; expected cash inflows; the ability of the Company to expand mineral resources beyond current mineral resource estimates; the results and impacts of current and planned drilling to convert inferred mineral resources to indicated, to extend mineral resources and to identify new deposits; the timing and results of the planned 30,000m drill program; the results of planned update to current mineral resource estimates; the Company’s ability to convert mineral resources to mineral reserves; the outcome of the review of a possible large pit scenario at Cortadera, including the economics thereof and the comparison with the existing PEA scenario; the timing and results of the planned updated PEA (if completed) and the PFS; opportunities for growth in mineral projects; the ability of the Company to secure necessary infrastructure; the terms and conditions related to use of existing port and electrical infrastructure, including the ability to access renewable energy sources; the timing and outcomes of this current and future planned economic studies; the timing and outcomes of regulatory processes required to obtain permits for the development and operation of the Costa Fuego Project as contemplated in this and future planned economic studies; whether or not the Company will make a development decision and the timing thereof; the ability of the Company to consolidate additional landholdings around its project; estimates of cost; and estimates of planned exploration.
Forward-looking statements involve known and unknown risks, uncertainties, and other factors, which may cause the actual results, performance, or achievements of the Company to be materially different from any future results, performance or achievements expressed or implied by the forward-looking statements. A number of factors could cause actual results to differ materially from a conclusion, forecast or projection contained in the forward-looking statements in this report, including, but not limited to, the following material factors: operational risks; risks related to the cost estimates of exploration; sovereign risks associated with the Company’s operations in Chile; changes in estimates of mineral resources of properties where the Company holds interests; recruiting qualified personnel and retaining key personnel; future financial needs and availability of adequate financing; fluctuations in mineral prices; market volatility; exchange rate fluctuations; ability to exploit successful discoveries; the production at or performance of properties where the Company holds interests; ability to retain title to mining concessions; environmental risks; financial failure or default of joint venture partners, contractors or service providers; competition risks; economic and market conditions; and other risks and uncertainties described elsewhere in this report and elsewhere in the Company’s public disclosure record.
Although the forward-looking statements contained in this report are based upon assumptions which the Company believes to be reasonable, the Company cannot assure investors that actual results will be consistent with these forward-looking statements. With respect to forward-looking statements contained in this report, the Company has made assumptions regarding: future commodity prices and demand; availability of skilled labour; timing and amount of capital expenditures; future currency exchange and interest rates; the impact of increasing competition; general conditions in economic and financial markets; availability of drilling and related equipment; effects of regulation by governmental agencies; future tax rates; future operating costs; availability of future sources of funding; ability to obtain financing; and assumptions underlying estimates related to adjusted funds from operations. The Company has included the above summary of assumptions and risks related to forward-looking information provided in this report to provide investors with a more complete perspective on the Company’s future operations, and such information may not be appropriate for other purposes. The Company’s actual results, performance or achievement could differ materially from those expressed in, or implied by, these forward-looking statements and, accordingly, no assurance can be given that any of the events anticipated by the forward-looking statements will transpire or occur, or if any of them do so, what benefits the Company will derive therefrom.
For additional information with respect to these and other factors and assumptions underlying the forward-looking statements made herein, please refer to the public disclosure record of the Company, including the Company’s most recent Annual Report, which is available on SEDAR (www.sedar.com) under the Company’s issuer profile. New factors emerge from time to time, and it is not possible for management to predict all those factors or to assess in advance the impact of each such factor on the Company’s business or the extent to which any factor, or combination of factors, may cause actual results to differ materially from those contained in any forward-looking statement.
The forward-looking statements contained in this report are expressly qualified by the foregoing cautionary statements and are made as of the date of this report. Except as may be required by applicable securities laws, the Company does not undertake any obligation to publicly update or revise any forward-looking statement to reflect events or circumstances after the date of this report or to reflect the occurrence of unanticipated events, whether as a result of new information, future events or results, or otherwise. Investors should read this entire report and consult their own professional advisors to ascertain and assess the income tax and legal risks and other aspects of an investment in the Company.
Appendix 5B
Mining exploration entity or oil and gas exploration entity quarterly cash flow report
Name of entity
Hot Chili Limited
ABN
Quarter ended (“current quarter”)
91 130 955 725
30 June 2023
Consolidated statement of cash flows
Current quarter $A’000
Year to date (12 months) $A’000
1.
Cash flows from operating activities
–
–
1.1
Receipts from customers
1.2
Payments for
(2,577)
(13,816)
(a) exploration & evaluation
(b) development
–
–
(c) production
–
–
(d) staff costs
(680)
(2,089)
(e) administration and corporate costs
(735)
(3,390)
1.3
Dividends received (see note 3)
–
–
1.4
Interest received
31
160
1.5
Interest and other costs of finance paid
–
–
1.6
Income taxes paid
–
–
1.7
Government grants and tax incentives
–
–
1.8
Other (provide details if material)
–
–
1.9
Net cash from / (used in) operating activities
(3,961)
(19,135)
2.
Cash flows from investing activities
–
–
2.1
Payments to acquire or for:
(a) entities
(b) tenements
(286)
(1,518)
(c) property, plant and equipment
–
–
(d) exploration & evaluation
–
–
(e) investments
–
–
(f) other non-current assets
–
–
2.2
Proceeds from the disposal of:
–
–
(a) entities
(b) tenements
–
–
(c) property, plant and equipment
–
–
(d) investments
–
–
(e) other non-current assets
–
–
2.3
Cash flows from loans to other entities
–
–
2.4
Dividends received (see note 3)
–
–
2.5
Other (provide details if material)
–
–
2.6
Net cash from / (used in) investing activities
(286)
(1,518)
3.
Cash flows from financing activities
–
–
3.1
Proceeds from issues of equity securities (excluding convertible debt securities)
3.2
Proceeds from issue of convertible debt securities
–
–
3.3
Proceeds from exercise of options
–
–
3.4
Transaction costs related to issues of equity securities or convertible debt securities
–
–
3.5
Proceeds from borrowings
–
–
3.6
Repayment of borrowings (CMP option)
–
–
3.7
Transaction costs related to loans and borrowings
–
–
3.8
Dividends paid
–
–
3.9
Other (provide details if material)
–
–
3.10
Net cash from / (used in) financing activities
–
–
4.
Net increase / (decrease) in cash and cash equivalents for the period
4.1
Cash and cash equivalents at beginning of period
7,389
23,722
4.2
Net cash from / (used in) operating activities (item 1.9 above)
(3,961)
(19,135)
4.3
Net cash from / (used in) investing activities (item 2.6 above)
(286)
(1,518)
4.4
Net cash from / (used in) financing activities (item 3.10 above)
–
–
4.5
Effect of movement in exchange rates on cash held
45
118
4.6
Cash and cash equivalents at end of period
3,187
3,187
5.
Reconciliation of cash and cash equivalents at the end of the quarter (as shown in the consolidated statement of cash flows) to the related items in the accounts
Current quarter $A’000
Previous quarter $A’000
5.1
Bank balances
2,036
4,740
5.2
Call deposits
1,151
2,649
5.3
Bank overdrafts
5.4
Other (provide details)
5.5
Cash and cash equivalents at end of quarter (should equal item 4.6 above)
3,187
7,389
6.
Payments to related parties of the entity and their associates
Current quarter $A’000
6.1
Aggregate amount of payments to related parties and their associates included in item 1
152
6.2
Aggregate amount of payments to related parties and their associates included in item 2
–
Note: if any amounts are shown in items 6.1 or 6.2, your quarterly activity report must include a description of, and an explanation for, such payments.
7.
Financing facilities Note: the term “facility’ includes all forms of financing arrangements available to the entity. Add notes as necessary for an understanding of the sources of finance available to the entity.
Total facility amount at quarter end $A’000
Amount drawn at quarter end $A’000
7.1
Loan facilities
–
–
7.2
Credit standby arrangements
–
–
7.3
Other (please specify)
–
–
7.4
Total financing facilities
–
–
7.5
Unused financing facilities available at quarter end
7.6
Include in the box below a description of each facility above, including the lender, interest rate, maturity date and whether it is secured or unsecured. If any additional financing facilities have beenentered into or are proposed to be entered into after quarter end, include a note providing details of those facilities as well.
8.
Estimated cash available for future operating activities
$A’000
8.1
Net cash from / (used in) operating activities (item 1.9)
(3,961)
8.2
(Payments for exploration & evaluation classified as investing activities) (item 2.1(d))
–
8.3
Total relevant outgoings (item 8.1 + item 8.2)
(3,961)
8.4
Cash and cash equivalents at quarter end (item 4.6)
3,187
8.5
Unused finance facilities available at quarter end (item 7.5)
–
8.6
Total available funding (item 8.4 + item 8.5)
3,187
8.7
Estimated quarters of funding available (item 8.6 divided by item 8.3)
0.80
Note: if the entity has reported positive relevant outgoings (ie a net cash inflow) in item 8.3, answer item 8.7 as “N/A”. Otherwise, a figure for the estimated quarters of funding available must be included in item 8.7.
8.8
If item 8.7 is less than 2 quarters, please provide answers to the following questions:
8.8.1 Does the entity expect that it will continue to have the current level of net operating cash flows for the time being and, if not, why not?
Answer: Yes. The company has executed a US$15 million Investment Agreement with Osisko Gold Royalties Limited (“Osisko”). See ASX announcement dated 28 June 2023.
8.8.2 Has the entity taken any steps, or does it propose to take any steps, to raise further cash to fund its operations and, if so, what are those steps and how likely does it believe that they will be successful?
Answer: Completion of the Agreement and the receipt of US$15 million (“Royalty Consideration”) by the Company as announced 26 July 2023.
8.8.3 Does the entity expect to be able to continue its operations and to meet its business objectives and, if so, on what basis?
Answer: Yes. The receipt of the Royalty Consideration from Osisko will be applied to the commencement of drilling activities across multiple growth targets and the completion and delivery of the resource upgrade in H2 2023 and the PFS for Costa Fuego in H2 2024.
Note: where item 8.7 is less than 2 quarters, all of questions 8.8.1, 8.8.2 and 8.8.3 above must be answered.
Compliance statement
This statement has been prepared in accordance with accounting standards and policies which comply with Listing Rule 19.11A.
This statement gives a true and fair view of the matters disclosed.
Date: ……………..28 July 2023…………………………………..
Authorised by: ………..By the Board…………………………………………….. (Name of body or officer authorising release – see note 4)
Notes
1.
This quarterly cash flow report and the accompanying activity report provide a basis for informing the market about the entity’s activities for the past quarter, how they have been financed and the effect this has had on its cash position. An entity that wishes to disclose additional information over and above the minimum required under the Listing Rules is encouraged to do so.
2.
If this quarterly cash flow report has been prepared in accordance with Australian Accounting Standards, the definitions in, and provisions of, AASB 6: Exploration for and Evaluation of Mineral Resources and AASB 107: Statement of Cash Flows apply to this report. If this quarterly cash flow report has been prepared in accordance with other accounting standards agreed by ASX pursuant to Listing Rule 19.11A, the corresponding equivalent standards apply to this report.
3.
Dividends received may be classified either as cash flows from operating activities or cash flows from investing activities, depending on the accounting policy of the entity.
4.
If this report has been authorised for release to the market by your board of directors, you can insert here: “By the board”. If it has been authorised for release to the market by a committee of your board of directors, you can insert here: “By the [name of board committee – eg Audit and Risk Committee]”. If it has been authorised for release to the market by a disclosure committee, you can insert here: “By the Disclosure Committee”.
5.
If this report has been authorised for release to the market by your board of directors and you wish to hold yourself out as complying with recommendation 4.2 of the ASX Corporate Governance Council’s Corporate Governance Principles and Recommendations, the board should have received a declaration from its CEO and CFO that, in their opinion, the financial records of the entity have been properly maintained, that this report complies with the appropriate accounting standards and gives a true and fair view of the cash flows of the entity, and that their opinion has been formed on the basis of a sound system of risk management and internal control which is operating effectively.
Hot Chili Limited logo (CNW Group/Hot Chili Limited)
VANCOUVER, British Columbia, July 27, 2023 (GLOBE NEWSWIRE) — Rover Metals Corp. (TSXV: ROVR) (OTCQB: ROVMF) (FSE:4XO) (“Rover” or the “Company”) is pleased to announce that it has received a $153,000 exploration grant from the Government of the Northwest Territories’ Mining Incentive Program to further exploration at its IML critical minerals project.
IML Project The IML project is located 195 km east-northeast of Yellowknife, NT, east of the Yellowknife Pegmatite Group, on the eastern arm of Great Slave Lake, within the rear earth element and pegmatite focus area. Great Slave Lake is located in the south of the Northwest Territories.
The IML Vulcanic Massive Sulphide project has had exploration dating back to the 1940s and has a historical resource spread across four zones on the project. The BB Zone and Kennedy Lake Zone have a combined historic resource of 1,400,000 tons grading 10% combined zinc and lead with 3.5 OPT (ounces per ton) of silver*. Approximately 900 metres west of the BB Zone, the Kennedy Lake West Zone has a historic resource of 610,000 tons grading 1.15% copper*. About 8 km southeast of the BB Zone, the Susu Lake Zone, has a historical resource consisting of 142,500 tons grading 0.95% copper*. The project is one of the last unexplored greenstone belts in the world, and has district scale potential. The historic resource is coming from just 3% of the 30,000 acre greenstone belt. Pegmatites have been identified in the historic drill core, and management of the Company has planned a Phase 1 Exploration Program to further explore for lithium in the pegmatites associated with the greenstone belt, as well as those that may exist from surrounding prominent granitic intrusions.
Infrastructure Unlike some projects in the Northwest Territories of Canada, the project benefits from primary barge infrastructure, and is located within a prolific area of lithium and rare earth elements exploration, where recent discoveries (for example, LiFT Power) are bound to bring new infrastructure to the area. Seasonal access to the IML project currently relies upon fixed or rotor wing support, or ice road. A right of way was cleared to the project from the deep lake port of Thompson Landing, NT, in the 1970s, providing barge access with ground transportation, considerably lowering any logistical costs. Future Government of Canada federally funded hydro-energy infrastructure could come close to the project if the Taltson Hydro Dam expansion proceeds through the eastern arm of Great Slave Lake into Yellowknife. At the southwest-end of Great Slave Lake, Osisko Metals is gearing up to reopen the Pine Point Zinc-Lead Mine. At nearby Hay River, NT, there is a rail line to the Teck Resources Zinc Refinery in Trail, BC.
Use of Grant Proceeds The Company has outlined a Phase 1 Exploration Program that relies heavily on airborne and ground geophysics to connect and model all of the historic zones of the project. The intent of the Phase 1 program is to ready the project for drilling in H2-2024. Rover Metals is seeking Joint Venture partners to option the project in 2024 for drilling.
*These resources are historic in nature. Further drilling is needed to bring them up to CIM Definition Standards. The historic data has not been verified by Rover. The historic information is provided in the 2103 Assessment Report for Indian Mountain Lake which is in public record with the Government of the Northwest Territories.
Technical information has been approved by Gary Vivian, M.Sc., P.Geo., QP for the purposes of NI 43-101.
Judson Culter, CEO at Rover Metals, states, “Zinc, Copper, and Lithium are on the Canadian Government’s Critical Minerals List, and have been prioritized for development. We’re thrilled the Government of the Northwest Territories has selected the IML project for grant funding. The recent discovery by LiFT Power of economic grade lithium in the area is shining a light on the jurisdiction, and we think the timing is right to plan an exploration program for IML.”
Current Financing Further to the Company’s release of July 20th, 2023, the third and final closing of the Company’s $0.08 Unit Financing has been allocated towards the Phase 1 Exploration Program for the IML project.
About Rover Metals Rover is a publicly traded junior mining company that trades on the TSXV under symbol ROVR, on the OTCQB under symbol ROVMF, and on the FSE under symbol 4XO. The Company has a diverse portfolio of mining resource development projects with varying exploration timelines. Its critical mineral projects include lithium, zinc, and copper. Its precious metals projects include gold and silver. The Company is exclusive to the mining jurisdictions of the U.S. and Canada.
ON BEHALF OF THE BOARD OF DIRECTORS “Judson Culter” Chief Executive Officer and Director
For further information, please contact: Email: info@rovermetals.com Phone: +1 (778) 754-2617
Statement Regarding Forward-Looking Information This news release contains statements that constitute “forward-looking statements.” Such forward-looking statements involve known and unknown risks, uncertainties and other factors that may cause Rover’s actual results, performance or achievements, or developments in the industry to differ materially from the anticipated results, performance or achievements expressed or implied by such forward-looking statements. Forward-looking statements are statements that are not historical facts and are generally, but not always, identified by the words “expects,” “plans,” “anticipates,” “believes,” “intends,” “estimates,” “projects,” “potential” and similar expressions, or that events or conditions “will,” “would,” “may,” “could” or “should” occur. There can be no assurance that such statements prove to be accurate. Actual results and future events could differ materially from those anticipated in such statements, and readers are cautioned not to place undue reliance on these forward-looking statements. Any factor could cause actual results to differ materially from Rover’s expectations. Rover undertakes no obligation to update these forward-looking statements in the event that management’s beliefs, estimates or opinions, or other factors, should change.
THE FORWARD-LOOKING INFORMATION CONTAINED IN THIS NEWS RELEASE REPRESENTS THE EXPECTATIONS OF THE COMPANY AS OF THE DATE OF THIS NEWS RELEASE AND, ACCORDINGLY, IS SUBJECT TO CHANGE AFTER SUCH DATE. READERS SHOULD NOT PLACE UNDUE IMPORTANCE ON FORWARD-LOOKING INFORMATION AND SHOULD NOT RELY UPON THIS INFORMATION AS OF ANY OTHER DATE. WHILE THE COMPANY MAY ELECT TO, IT DOES NOT UNDERTAKE TO UPDATE THIS INFORMATION AT ANY PARTICULAR TIME EXCEPT AS REQUIRED IN ACCORDANCE WITH APPLICABLE LAWS.
NEITHER THE TSX VENTURE EXCHANGE NOR ITS REGULATION PROVIDER (AS THAT TERM IS DEFINED IN THE POLICIES OF THE TSX VENTURE EXCHANGE) ACCEPTS RESPONSIBILITY FOR THE ADEQUACY OF THIS RELEASE.
Wall Sampling Returns 18.70 g/t Au over 17.8 m, Peak Value of 150.77 g/t Au
North Vancouver, British Columbia–(Newsfile Corp. – July 27, 2023) – Lion One Metals Limited (TSXV: LIO) (OTCQX: LOMLF) (ASX: LLO) (“Lion One” or the “Company”) is pleased to report high-grade gold results from underground sampling and announces the expansion of gold mineralization at its 100% owned Tuvatu Alkaline Gold Project in Fiji.
Sampling along the walls of the URW1a and URW1b mine drives at Tuvatu has returned high-grade gold results, indicating that the gold mineralization associated with both the URW1a and URW1b lodes extends beyond the walls of the current drives. As reported on July 13, 2023, the grades associated with the URW1a and URW1b lodes are higher than anticipated and the results reported here indicate that the high-grade gold mineralization associated with these lodes is also greater in width than that which was estimated from drilling.
Highlights of wall sampling, parallel to sub-parallel to strike-drives, on URW1a and URW1b:
18.70 g/t Au over 17.8 m (including 91.15 g/t Au over 1.0m) (URW1b – Right Wall)
32.34 g/t Au over 10 m (including 149.86 and 80.11 g/t Au over 1.0m each) (URW1b – Left Wall)
17.11 g/t Au over 18 m (including 150.77 g/t Au over 1.0m) (URW1a – Right Wall)
20.72 g/t Au over 11 m (including 107.56 g/t Au over 1.0m) (URW1a – Left Wall)
24.76 g/t Au over 7 m (including 67.06 g/t Au over 1.0m) (URW1a – Left Wall)
Lion One Chairman and CEO Walter Berukoff commented: “We’re very pleased with the results from our wall sampling program. The program was initiated following the identification of coarse visible gold in veinlets in the walls of both the URW1a and URW1b mine drives. The results indicate that there is significant gold mineralization present in the walls of both drives, and that the mineable width of both drives is therefore considerably wider than we expected based on drill results. An investigation is now underway to determine how far this additional gold mineralization extends into the walls of both drives and how much additional high-grade material we can expect to mine from these lodes. Mining is ongoing in both drives and we’re hopeful that this additional gold mineralization will provide a further boost to our growing stockpile in advance of our plant commissioning later this year.”
Wall Sampling
Table 1. Highlights of Wall Sampling, parallel/subparallel to strike drives from the URW1a and URW1b lodes
Location
From
To
Interval (m)
Au (g/t)
URW1a Left Wall
0
7
7
24.76
including
0
2
2
46.71
which includes
1
2
1
67.06
and also including
3
6
3
24.65
URW1a Left Wall
12
29
17
14.55
including
18
29
11
20.72
which includes
18
22
4
17.54
and
23
26
3
50.84
which includes
25
26
1
107.56
URW1a Right Wall
9
27
18
17.11
including
9
10
1
35.90
and
11
12
1
10.46
and
13
24
11
23.54
which includes
15
22
7
35.47
which includes
15
16
1
150.77
URW1b Left Wall
2
12
10
32.34
including
6
8
2
76.85
which includes
6
7
1
149.86
and also including
9
12
3
54.50
which includes
9
10
1
80.11
and
10
11
1
23.20
and
11
12
1
60.18
URW1b Left Wall
14
19
5
7.48
including
14
17
3
11.51
URW1b Right Wall
0
17.8
17.8
18.70
including
5.8
10.8
5
30.24
which includes
5.8
6.8
1
27.71
and
9.4
9.8
0.4
50.76
and
9.8
10.8
1
91.15
and also including
11.8
17.8
6
28.57
which includes
14.8
17.8
3
44.53
Figure 1. Location of the URW1a and URW1b lodes in relation to the Tuvatu system. Mining is progressing north along both the URW1a lode (modelled in purple) and the URW1b lode (modelled in green). Inset image shows the location of the URW1a and URW1b lodes in relation to the Tuvatu system, with all other lodes shown in pale grey. Underground developments are shown in red. The dashed black square is the area highlighted in Figure 2. The URW1 mineralized trend has a N-S strike length of approximately 300 m and a vertical extent also of approximately 300 m. The URW1a and URW1b lodes occupy approximately 75m of this mineralized strike length. Extensional drilling is ongoing.
Figure 2. Location of URW1a and URW1b wall samples. Yellow lines indicate the location of the wall sample lines in relation to the URW1a and URW1b mine drives, shown in red. Sample lines start with 0 m at the southern (bottom) end of the mine drives and progress north along the drives. Yellow arrows indicate the possible expansion of the mine drives, pending investigation into the lateral extent of additional gold mineralization.
Mining of the URW1 lodes has been ongoing since May 18th, 2023 and is being conducted through the use of airleg mining. Airleg mining is a very precise method of mining which is ideal for narrow vein mineralization such as at Tuvatu as it enables the extraction of the vein material with minimal dilution.
As mining progressed along the URW1a and URW1b lodes, gold mineralization was identified within narrow stockwork-style veining in the walls of both drives following extraction. A systematic program of wall sampling was therefore initiated to determine the extent of gold mineralization along the walls. Samples were collected at approximately 1m intervals along the entire length of both the lefthand and righthand walls of both the URW1a and URW1b mine drives. The samples were collected by chipping material off the face of the wall along a continuous horizontal line irrespective of veining, mineralization, alteration, or lithology. The sampling results are therefore considered representative of the wall material.
The wall sampling results indicate significant gold mineralization is present in the walls of both the URW1a and URW1b mine drives, yet the lateral extent of this mineralization is unknown. An investigation is underway to determine how far mineralization extends beyond the current walls of the drives and how much additional material can be mined from these drives. Information gained from this investigation will then be applied to adapt the mine design for these lodes moving forward. As a general strategy, the early recognition of gold-bearing stockwork-style veining beyond the primary vein is significant as it provides the opportunity for the mining team to take advantage of increased mining volumes early in the life of the mine. The mining method at Tuvatu is being assessed locally and where it can be demonstrated to be beneficial a switch from airleg to mechanized mining will be considered. The effect of mechanized mining as compared to airleg mining is that it has a higher production rate but wider minimum mining widths. It is therefore efficient for wide zones of mineralization but increases dilution in narrow zones.
Modes of Mineralization at URW1 lodes
The discovery of widespread gold mineralization in the walls of the URW1a and URW1b mine drives has indicated that high-grade gold mineralization extends for several meters on either side of the main URW1 lodes. This has led to an increased understanding of the gold grade distribution in this portion of the Tuvatu deposit. It is well established that high-grade gold mineralization at Tuvatu occurs within the main subvertical lodes, such as the URW1a and URW1b lodes, which are likely the primary fluid-flow pathways in this part of the system. Results from the wall sampling program confirm the presence of a secondary, but no less important, mode of occurrence of gold mineralization of considerable significance. This second mode of mineralization occurs as a network of stockwork-style veining that forms a halo of metric extent peripheral to the main sub-vertical lodes (Figure 3).
Figure 3. Example of grade distribution in URW1a. Photo of the face of the URW1a mine drive at approximately 24 m into the drive. The main lode is shown to the right of the photo within the dashed yellow lines. Stockwork style veining is shown to the left of the main lode, with some of the veining highlighted by dashed orange lines. Gold grades from face sampling are shown in white, while gold grades from the wall sampling at this location are shown in orange. The main lode at this part of the drive is quite close to the righthand wall of the drive so we can see that high-grade gold in the form of stockwork style veining extends at least 2 m to the lefthand wall of the drive, where wall sampling returned a grade of 24.00 g/t Au. High grade material at this location therefore extends beyond the lefthand wall, as well as beyond the righthand wall where the wall sample returned 10.22 g/t Au. The lateral extent of high-grade mineralization peripheral to the main subvertical lodes is currently unknown.
Gold mineralization in the main lodes typically occurs within chalcedonic quartz veins both as native gold resulting from fluid flashing events and as a very fine-grained gold overprint in association with coarse grained pyrite and sphalerite. Gold mineralization within the halo of stockwork-style veining around the main lode occurs as native gold within a network of thin (<1 cm wide) quartz veinlets (Figure 4). The discovery of this second form of gold mineralization represents a potentially significant upside for gold grades and tonnage at the URW1a and URW1b lodes, and possibly for Tuvatu as a whole.
Figure 4. Examples of different visible gold-bearing veinlets identified during sampling. Examples of thin, visible gold-bearing veinlets from stockwork-style veining peripheral to the URW1a and URW1b main lodes. Scratcher pen used for scale.
Visual estimates of mineral abundance should never be considered a proxy or substitute for laboratory analyses where metal concentrations or grades are the factors of principal economic interest. At Tuvatu, coarse visible gold generally correlates well to high-grade mineralization. However, the actual grades can only be determined by systematic sampling and assaying.
About Tuvatu
The Tuvatu Alkaline Gold Project is located on the island of Viti Levu in Fiji. The January 2018 mineral resource for Tuvatu as disclosed in the technical report “Technical Report and Preliminary Economic Assessment for the Tuvatu Gold Project, Republic of Fiji”, dated September 25, 2020, and prepared by Mining Associates Pty Ltd of Brisbane Qld, comprises 1,007,000 tonnes indicated at 8.50 g/t Au (274,600 oz. Au) and 1,325,000 tonnes inferred at 9.0 g/t Au (384,000 oz. Au) at a cut-off grade of 3.0 g/t Au. The technical report is available on the Lion One website at www.liononemetals.com and on the SEDAR website at www.sedar.com.
Qualified Person
In accordance with National Instrument 43-101 – Standards of Disclosure for Mineral Projects (“NI 43- 101”), Sergio Cattalani, P.Geo, Senior Vice President Exploration, is the Qualified Person for the Company and has reviewed and is responsible for the technical and scientific content of this news release.
QAQC Procedures
Lion One adheres to rigorous QAQC procedures above and beyond basic regulatory guidelines in conducting its sampling, drilling, testing, and analyses. The Company utilizes its own fleet of diamond drill rigs, using PQ, HQ and NQ sized drill core rods. Drill core is logged and split by Lion One personnel on site. Samples are delivered to and analyzed at the Company’s geochemical and metallurgical laboratory in Fiji. Duplicates of all samples with grades above 0.5 g/t Au are both re-assayed at Lion One’s lab and delivered to ALS Global Laboratories in Australia (ALS) for check assay determinations. All samples for all high-grade intercepts are sent to ALS for check assays. All samples are pulverized to 85% passing through 75 microns. Gold analysis is carried out using fire assay with an AA finish. Samples that have returned grades greater than 10.00 g/t Au are then re-analyzed by gravimetric method. For samples that return greater than 0.50 g/t Au, repeat fire assay runs are carried out and repeated until a result is obtained that is within 10% of the original fire assay run. Lion One’s laboratory can also assay for a range of 71 other elements through Inductively Coupled Plasma Optical Emission Spectrometry (ICP-OES), but currently focuses on a suite of 9 important pathfinder elements. All duplicate anomalous samples are sent to ALS labs in Townsville QLD and are analyzed by the same methods (Au-AA26, and Au-GRA22 where applicable). ALS also analyses 33 pathfinder elements by HF-HNO3-HClO4 acid digestion, HCl leach and ICP-AES (method ME-ICP61).
About Lion One Metals Limited
Lion One’s flagship asset is 100% owned, fully permitted high grade Tuvatu Alkaline Gold Project, located on the island of Viti Levu in Fiji. Lion One envisions a low-cost high-grade underground gold mining operation at Tuvatu coupled with exciting exploration upside inside its tenements covering the entire Navilawa Caldera, an underexplored yet highly prospective 7km diameter alkaline gold system. Lion One’s CEO Walter Berukoff leads an experienced team of explorers and mine builders and has owned or operated over 20 mines in 7 countries. As the founder and former CEO of Miramar Mines, Northern Orion, and La Mancha Resources, Walter is credited with building over $3 billion of value for shareholders.
On behalf of the Board of Directors of Lion One Metals Limited “Walter Berukoff“, Chairman and CEO
Neither the TSX Venture Exchange nor its Regulation Service Provider accepts responsibility for the adequacy or accuracy of this release
This press release may contain statements that may be deemed to be “forward-looking statements” within the meaning of applicable Canadian securities legislation. All statements, other than statements of historical fact, included herein are forward-looking information. Generally, forward-looking information may be identified by the use of forward-looking terminology such as “plans”, “expects” or “does not expect”, “proposed”, “is expected”, “budget”, “scheduled”, “estimates”, “forecasts”, “intends”, “anticipates” or “does not anticipate”, or “believes”, or variations of such words and phrases, or by the use of words or phrases which state that certain actions, events or results may, could, would, or might occur or be achieved. This forward-looking information reflects Lion One Metals Limited’s current beliefs and is based on information currently available to Lion One Metals Limited and on assumptions Lion One Metals Limited believes are reasonable. These assumptions include, but are not limited to, the actual results of exploration projects being equivalent to or better than estimated results in technical reports, assessment reports, and other geological reports or prior exploration results. Forward-looking information is subject to known and unknown risks, uncertainties and other factors that may cause the actual results, level of activity, performance or achievements of Lion One Metals Limited or its subsidiaries to be materially different from those expressed or implied by such forward-looking information. Such risks and other factors may include, but are not limited to: the stage development of Lion One Metals Limited, general business, economic, competitive, political and social uncertainties; the actual results of current research and development or operational activities; competition; uncertainty as to patent applications and intellectual property rights; product liability and lack of insurance; delay or failure to receive board or regulatory approvals; changes in legislation, including environmental legislation, affecting mining, timing and availability of external financing on acceptable terms; not realizing on the potential benefits of technology; conclusions of economic evaluations; and lack of qualified, skilled labour or loss of key individuals. Although Lion One Metals Limited has attempted to identify important factors that could cause actual results to differ materially from those contained in forward-looking information, there may be other factors that cause results not to be as anticipated, estimated or intended. Accordingly, readers should not place undue reliance on forward-looking information. Lion One Metals Limited does not undertake to update any forward-looking information, except in accordance with applicable securities laws.
Appendix 1: Complete Wall Sample Results and Location Information
Table 2. Wall Sample results from the URW1a lode
URW1a – Left Wall
URW1a – Right Wall
From
To
Interval (m)
Au g/t
From
To
Interval (m)
Au g/t
0
1
1
26.36
0
1
1
0.94
1
2
1
67.06
1
2
1
5.25
2
3
1
1.4
2
3
1
1.04
3
4
1
39.56
3
4
1
2.84
4
5
1
17.43
4
5
1
1.45
5
6
1
16.96
5
6
1
9.39
6
7
1
4.57
6
7
1
0.13
7
8
1
0.01
7
8
1
0.01
8
9
1
0.28
8
9
1
0.73
9
10
1
0.04
9
10
1
35.9
10
11
1
0.15
10
11
1
0.13
11
12
1
0.01
11
12
1
10.46
12
13
1
9.01
12
13
1
0.21
13
14
1
3.36
13
14
1
4.39
14
15
1
0.01
14
15
1
1.63
15
16
1
4.24
15
16
1
150.77
16
17
1
2.52
16
17
1
14.19
17
18
1
0.28
17
18
1
12.77
18
19
1
37.88
18
19
1
23.02
19
20
1
1.34
19
20
1
11.57
20
21
1
6.93
20
21
1
10.22
21
22
1
24
21
22
1
25.76
22
23
1
1.43
22
23
1
2.48
23
24
1
7.93
23
24
1
2.16
24
25
1
37.03
24
25
1
0.37
25
26
1
107.56
25
26
1
1.35
26
27
1
1.97
26
27
1
0.54
27
28
1
0.14
27
28
1
0.11
28
29
1
1.73
28
29
1
0.04
29
30
1
0.21
29
30
1
3.31
30
31
1
0.01
30
31
1
0.06
Table 3. Wall Sample results from the URW1b lode
URW1b – Left Wall
URW1b – Right Wall
From
To
Interval (m)
Au g/t
From
To
Interval (m)
Au g/t
0
1
1
0.00
0
1
1
0.73
1
2
1
0.48
1
2
1
3.02
2
3
1
1.17
2
2.8
0.8
1.33
3
4
1
2.21
2.8
3.8
1
3.41
4
5
1
2.62
3.8
4.8
1
1.67
5
6
1
0.20
4.8
5.8
1
0.12
6
7
1
149.86
5.8
6.8
1
27.71
7
8
1
3.83
6.8
7.4
0.6
5.14
8
9
1
0.00
7.4
8.4
1
3.96
9
10
1
80.11
8.4
9.4
1
5.01
10
11
1
23.20
9.4
9.8
0.4
50.76
11
11.2
0.2
27.14
9.8
10.8
1
91.15
11.2
12
0.8
68.44
10.8
11.8
1
0.17
12
13
1
0.00
11.8
12.8
1
6.4
13
14
1
0.00
12.8
13.8
1
19.68
14
15
1
12.00
13.8
14.8
1
11.76
15
16
1
12.36
14.8
15.8
1
47.29
16
17
1
10.19
15.8
16.8
1
49.02
17
18
1
0.82
16.8
17.8
1
37.29
18
19
1
2.03
19
20
1
0.00
20
21
1
0.00
21
22
1
2.16
Table 4. Coordinates for wall sample lines reported in this release, using the end of the sample line as the reference point (i.e. the northern most point). Coordinates are in Fiji map grid.
ST. LOUIS, July 27, 2023 /PRNewswire/ — Peabody (NYSE: BTU) announced today that its Board of Directors has declared a quarterly dividend on its common stock of $0.075 per share, payable on August 30, 2023 to stockholders of record on August 10, 2023.
Peabody is a leading coal producer, providing essential products for the production of affordable, reliable energy and steel. Our commitment to sustainability underpins everything we do and shapes our strategy for the future. For further information, visit PeabodyEnergy.com.
Contact: Karla Kimrey 314.342.7890
Forward-Looking Statements
This press release contains forward-looking statements within the meaning of the securities laws. Forward-looking statements can be identified by the fact that they do not relate strictly to historical or current facts. They often include words or variation of words such as “expects,” “anticipates,” “intends,” “plans,” “believes,” “seeks,” “estimates,” “projects,” “forecasts,” “targets,” “would,” “will,” “should,” “goal,” “could” or “may” or other similar expressions. Forward-looking statements provide management’s current expectations or predictions of future conditions, events or results. All statements that address operating performance, events, or developments that Peabody expects will occur in the future are forward-looking statements. They may include estimates of sales and other operating performance targets, cost savings, capital expenditures, dividends, share repurchases, other expense items, actions relating to strategic initiatives, demand for the company’s products, liquidity, capital structure, market share, industry volume, other financial items, descriptions of management’s plans or objectives for future operations and descriptions of assumptions underlying any of the above. The declaration and payment of future quarterly dividends remains at the discretion of the Board of Directors and will depend on the Company’s financial results, cash flow and cash requirements, future prospects, and other factors deemed relevant by the Board. All forward-looking statements speak only as of the date they are made and reflect Peabody’s good faith beliefs, assumptions and expectations, but they are not guarantees of future performance or events. Furthermore, Peabody disclaims any obligation to publicly update or revise any forward-looking statement, except as required by law. By their nature, forward-looking statements are subject to risks and uncertainties that could cause actual results to differ materially from those suggested by the forward-looking statements. Factors that might cause such differences include, but are not limited to, a variety of economic, competitive and regulatory factors, many of which are beyond Peabody’s control, that are described in Peabody’s Annual Report on Form 10-K for the fiscal year ended Dec. 31, 2022 and Quarterly Report on Form 10-Q for the quarter ended March 31, 2023, and other factors that Peabody may describe from time to time in other filings with the SEC. You may get such filings for free at Peabody’s website at www.peabodyenergy.com. You should understand that it is not possible to predict or identify all such factors and, consequently, you should not consider any such list to be a complete set of all potential risks or uncertainties.
Ottawa, Ontario–(Newsfile Corp. – July 26, 2023) – Gold79 Mines Ltd. (TSXV: AUU) (OTCQB: AUSVF) (“Gold79” or the “Company”) is pleased to announce the closing of a second final tranche of its non-brokered private placement financing, raising gross proceeds of $249,314 through the issuance of 8,310,457 units at $0.03 per unit. In total, including the first tranche of the placement, 15,310,457 units were issued for gross proceeds of $459,314.
Each unit consists of one common share of the Company and one whole common share purchase warrant. A total of 8,310,457 warrants were issued in the second tranche, with each warrant entitling the holder to purchase one common share of the Company at a price of $0.05 per share until July 26, 2025. The warrants are callable after the statutory hold period, at the option of the Company, in the event that the 20-day volume-weighted average price of the Company’s common share meets or exceeds $0.08 for ten consecutive trading days based on trades on the TSX Venture Exchange (“TSX-V”) and Alternative Trading Systems. Subscribers will be notified of the call provision being triggered and will have a 30-day period to exercise the warrants.
In connection with the second tranche of the placement a cash finder fee of $210 was paid and 7,000 finder warrants were issued. The finder warrants are exercisable at $0.05 per share and expire on July 26, 2025.
This private placement is subject to the final approval of the TSX-V. All securities issued in the first tranche of the placement are subject to a statutory hold period until October 9, 2023 and for the second tranche until November 27, 2023, respectively.
It is anticipated that approximately 50 percent of the aggregate proceeds raised under the offering will be used for exploration expenditures, land management costs and property payments; approximately 25 percent will be used to pay management fees to Company officers; and, approximately 25 percent will be used for working capital and general corporate purposes.
The securities issued in the private placement will not be registered under the United States Securities Act of 1933, as amended (the “U.S. Securities Act”) and may not be offered or sold within the United States or to or for the account or benefit of U.S. persons, except in certain transactions exempt from the registration requirements of the U.S. Securities Act. This press release does not constitute an offer to sell, or the solicitation of an offer to buy, securities of the Company in the United States.
Gold Chain annual property payment
The Company intends to issue 2,062,548 common shares of the Company in connection with a US$48,000 ($63,283) share payment due under the option agreement covering a portion of the Company’s landholdings for the Gold Chain project in Arizona. The common shares issued will have a statutory hold period of four months and one day from the date of issuance. This shares for debt transaction remains subject to TSX-V approval.
About Gold79 Mines Ltd.
Gold79 Mines Ltd. is a TSX Venture listed company focused on building ounces in the Southwest USA. Gold79 holds 100% earn-in option to purchase agreements on three gold projects: the Jefferson Canyon Gold Project and the Tip Top Gold Project both located in Nevada, USA, and, the Gold Chain Project located in Arizona, USA. In addition, Gold79 holds a 32.3% interest in the Greyhound Project, Nunavut, Canada under JV by Agnico Eagle Mines Limited.
For further information regarding this press release contact: Derek Macpherson, President & CEO Phone: 416-294-6713 Email: dm@gold79mines.com Website: www.gold79mines.com.
This press release may contain forward-looking statements that are made as of the date hereof and are based on current expectations, forecasts and assumptions which involve risks and uncertainties associated with our business including the uncertainty as to whether further exploration will result in the target(s) being delineated as a mineral resource, capital expenditures, operating costs, mineral resources, recovery rates, grades and prices, estimated goals, expansion and growth of the business and operations, plans and references to the Company’s future successes with its business and the economic environment in which the business operates. All such statements are made pursuant to the ‘safe harbour’ provisions of, and are intended to be forward-looking statements under, applicable Canadian securities legislation. Any statements contained herein that are statements of historical facts may be deemed to be forward-looking statements. By their nature, forward-looking statements require us to make assumptions and are subject to inherent risks and uncertainties. We caution readers of this news release not to place undue reliance on our forward-looking statements as a number of factors could cause actual results or conditions to differ materially from current expectations. Please refer to the risks set forth in the Company’s most recent annual MD&A and the Company’s continuous disclosure documents that can be found on SEDAR at www.sedar.com. Gold79 does not intend, and disclaims any obligation, except as required by law, to update or revise any forward-looking statements whether as a result of new information, future events or otherwise.
Neither the TSX Venture Exchange nor its Regulation Services Provider (as that term is defined in the policies of the TSX Venture Exchange) accepts responsibility for the adequacy or accuracy of this release.
NOT FOR RELEASE OR DISTRIBUTION IN THE UNITED STATES OR FOR DISSEMINATION TO U.S NEWS WIRE SERVICES
PERTH, Australia, July 26, 2023 /CNW/ – Hot Chili Limited (ASX: HCH) (TSXV: HCH) (OTCQX: HHLKF) (“Hot Chili” or the “Company”) is pleased to announce that it has closed its previously announced transaction with Osisko Gold Royalties Ltd (“Osisko”), pursuant to which Hot Chili received proceeds of US$15 million in exchange for the sale of a 1.0% Net Smelter Return (NSR) royalty on copper and a 3% NSR royalty on gold (the “Investment”) across the Company’s Costa Fuego Copper-Gold Project (“the Project”) located 600 km north of Santiago, at low elevation (<1,000 m) in the coastal range of the Atacama Region, Chile.
Hot Chili Limited logo (CNW Group/Hot Chili Limited)
The Investment by Osisko has strengthened the Company’s current cash position to approximately A$26 million, demonstrated strong look-through value of the Project’s economics (see the Company’s announcement dated 28th June 2023, entitled “Hot Chili Announces PEA for Costa Fuego”) and provided another significant endorsement of Hot Chili’s Costa Fuego project from one of North America’s leading royalty-streaming groups (see the Company’s announcement dated 28th June 2023, entitled “Hot Chili Announces US$15 Million Investment Agreement with Osisko Gold Royalties”).
The Company is now well funded to deliver the next steps in its growth and development plan, including:
Commencement of 30,000 m drill program – preparations well-advanced; drilling operations set to commence in the coming weeks.
Completion of Costa Fuego resource upgrade by late 2023
Delivery of Costa Fuego pre-feasibility study (“PFS”) in H2 2024 – The Company has already considerably advanced its PFS (approximately 80% complete) with minimal expenditure required for completion
Hot Chili’s Managing Director Mr Christian Easterday commented, “We are very pleased to have closed the Investment with Osisko Gold Royalties enabling the Company to advance the project without the dilution of a share issuance.”
“Costa Fuego is globally relevant, being one of only a handful of projects with potential to deliver near-term, meaningful, new copper supply into a looming global copper supply shortage.”
The Company looks forward to providing updates on the Company’s next steps shortly.
This announcement is authorised by the Board of Directors for release to ASX and TSXV.
Hot Chili’s Managing Director and Chief Executive Officer Mr Christian Easterday is responsible for this announcement and has provided sign-off for release to the ASX and TSXV.
This document contains certain “forward-looking statements” and “forward-looking information” concerning the business, operations and financial performance and condition of Company. Forward-looking statements and forward-looking information include, but are not limited to, statements with respect to the timing and ability, if at all, for the completion of the PFS; the timing and ability, if at all, to complete a resource upgrade at Costa Fuego; timing of the commencement of the Company’s 30,000m drill programme; permitting and legal processes in relation to mining permitting and approvals; estimated production and mine life of the various mineral projects of the Company; the ability to obtain permits for operations; synergies; the realisation of mineral resource estimates; the benefits of the development potential of the properties of the Company; the future price of minerals, including gold, copper, and silver; the estimation of mineral reserves and resources; success of exploration activities; and currency exchange rate fluctuations. Except for statements of historical fact relating to the Company, certain information contained herein constitutes forward-looking statements. Forward-looking statements are frequently characterised by words such as “plan,” “expect,” “project,” “intend,” “believe,” “anticipate”, “estimate” and other similar words, or statements that certain events or conditions “may”, “should” or “will” occur. Forward-looking statements are based on the opinions and estimates of the Company at the date the statements are made and are based on a number of assumptions and subject to a variety of risks and uncertainties and other factors that could cause actual events or results to differ materially from those projected in the forward-looking statements. Many of these assumptions are based on factors and events that are not within the control of the Company and there is no assurance they will prove to be correct.
Factors that could cause actual results to vary materially from results anticipated by such forward-looking statements include the results of the Company’s preliminary economic assessment and planned PFS, as well as future economic studies, the results of the planned 30,000m drill programme and their impact on mineral resources and the economic studies, variations in ore grade or recovery rates, changes in market conditions, risks relating to the availability and timeliness of permitting and governmental approvals; risks relating to international operations, fluctuating metal prices and currency exchange rates, changes in project parameters, the possibility of project cost overruns or unanticipated costs and expenses, labour disputes and other risks of the mining industry, failure of plant, equipment or processes to operate as anticipated.
The Company cautions that the foregoing list of important factors is not exhaustive. Investors and others who base themselves on forward-looking statements should carefully consider the above factors as well as the uncertainties they represent and the risk they entail and are cautioned not to place undue reliance on forward-looking statements. The Company believes that the expectations reflected in those forward-looking statements are reasonable, but no assurance can be given that these expectations will prove to be correct and such forward-looking statements included in this press release should not be unduly relied upon. These statements speak only as of the date of this press release.
Although the Company has attempted to identify important factors that could cause actual actions, events or results to differ materially from those described in forward-looking statements, there may be other factors that cause actions, events or results not to be anticipated, estimated or intended. There can be no assurance that forward-looking statements will prove to be accurate, as actual results and future events could differ materially from those anticipated in such statements. The Company undertakes no obligation to update forward-looking statements if circumstances or the Company’s estimates or opinions should change except as required by applicable securities laws. Any comparative market information is as of a date prior to the date of this document.
Disclaimer
Neither the TSX Venture Exchange nor its Regulation Services Provider (as that term is defined in the policies of the TSX Venture Exchange) accepts responsibility for the adequacy or accuracy of this news release.
This document (the “Document”) is to be used by the recipient for informational purposes only and does not purport to be complete or contain all the information that may be material to the current or future business, operations, financial condition, or prospects of Hot Chili Limited (“Hot Chili” or the “Company”). Each recipient should perform its own independent investigation and analysis of Hot Chili, and the information contained in this Document is not a substitute therefore. Hot Chili makes no representation or warranty, express or implied, as to the accuracy or completeness of the information contained in this Document or in any other written or oral communication transmitted to any recipient by any party. Except for liability which cannot be disclaimed by law, by accepting this Document, the recipient agrees that neither Hot Chili nor any of its officers, directors, employees, or representatives has any liability for any representations or warranties, express or implied, contained in, or for any omissions from, this Document or any such other written or oral communication from any person.
Certain information contained herein is based on, or derived from, information provided by independent third-party sources. Hot Chili believes that such information is accurate and that the sources from which it has been obtained are reliable; however, Hot Chili has not independently verified such information and does not assume any responsibility for the accuracy or completeness of such information.
This Document should not be considered as a recommendation from any person to purchase any securities. Each person for whom this Document is made available should consult its own professional advisors in making its own independent investigations and assessment and, after making such independent investigations and assessments, as it deems necessary, in determining whether to proceed with any investment in the Company.