This was originally posted on our Voronoi app. Download the app for free on iOS or Android and discover incredible data-driven charts from a variety of trusted sources.
U.S. President Donald Trump has imposed a 25% tariff on all steel and aluminum imports, marking one of the most discussed measures of his first month back in the White House.
But which countries are most affected by these tariffs?
This map illustrates the top suppliers of aluminum and steel to the United States in 2024. The data comes from the U.S. Census Bureau.
Canada: The Largest Partner
Canada is by far the top supplier of both steel and aluminum to the United States. The neighboring country exported $9.4 billion worth of aluminum to the U.S. in 2024, significantly ahead of the second-largest exporter, the European Union, which exported $1.5 billion.
Canada also exported $7.1 billion worth of steel last year, compared to $7 billion from the European Union.
Country
Steel Imports (USD)
Aluminum Imports (USD)
Canada
$7.1B
$9.4B
Mexico
$3.5B
$397M
Brazil
$3.0B
–
China
$799M
$809M
Taiwan
$1.3B
–
South Korea
$2.9B
$781M
Germany
$1.9B
$318M
Japan
$1.7B
–
India
$489M
$445M
European Union
$7B
$1.5B
UAE
–
$917M
Bahrain
–
$535M
Argentina
–
$468M
Thailand
–
$271M
UK
$440M
–
Mexico, South Korea, and Brazil are also among the top suppliers of steel to the United States. Meanwhile, the country imports aluminum from other key partners, including China, the United Arab Emirates, South Korea, Bahrain, and Argentina.
A recent report by the Center for Strategic and International Studies (CSIS) noted that the U.S. produces less than 2% of the world’s primary aluminum.
Vancouver, British Columbia–(Newsfile Corp. – February 20, 2025) – Goldshore Resources Inc. (TSXV: GSHR) (OTCQB: GSHRF) (FSE: 8X00) (“Goldshore” or the “Company“), is pleased to announce its latest assay results from its ongoing 15,000 meter drill program at the Moss Gold Project in Northwest Ontario, Canada (the “Moss Gold Project“). The primary goals of the winter drill program are to add to the current resource model by extending mineralization from depth into the top 100-200 meters from surface within the conceptual open pit and to demonstrate the potential for resource growth outside of the current mineral resource estimate.
Michael Henrichsen, CEO of Goldshore, commented, “We are pleased with the latest batch of drill results which clearly demonstrate the potential for resource expansion at higher grades in the southwest area of the Moss deposit. These results are exactly what we were anticipating to drive growth and demonstrate the true potential of the deposit moving forward. We look forward to sharing additional results from the winter drill program and regional exploration program in the coming weeks and months.”
Highlights
Results from hole MMD-24-139 extended gold mineralization with increased grades 150 meters below the conceptual open pit resource at the southwest end of the Moss deposit with intercepts of:
Hole MMD-24-139 also confirmed mineralized shears on the southeast flank of the Southwest Zone extending known mineralization toward surface and encountering new mineralized shear zones with intercepts of:
Holes MMD-24-135, MMD-24-138, and MMD-24-139 also extended numerous mineralized shears toward surface in the Southwest Zone with intercepts of:
Technical Overview
Figure 1 shows the location of the drill holes being reported with respect to the planned winter drill program, while Figure 2 illustrates a cross section through drill hole MMD-24-139 that demonstrates significant mineralization above and below the current mineral resource. Tables 1 & 2 summarize significant intercepts and drill hole locations, respectively.
Figure 1: Illustrates the 2025 ongoing winter drill program targeting resource expansion within the conceptual open pit outlined in grey. Drill holes being reported are highlighted in red.
Figure 2: Drill section through MMD-24-139 illustrating a wider series of shears near surface that will allow the Company to model grade to surface. The section also highlights the growth potential beneath the open pit that may enable the open-pit resource to be as deep as the Main-QES pit
Drilling at the Southwest Zone aims to add to the mineral resource by infilling gaps within the current model created by sparse drilling. Drilling at shallow depths of 100-200 meters will allow for mineralized shear zones to be extended to the surface. Drilling at depths of 200 to 400 meters will allow the expansion of the open pit resource to a similar depth as the Main-QES pit (~500 meters).
Hole MMD-24-135 and MMD-24-138 were drilled along the western and eastern edges respectively of Snodgrass Lake to test the up-dip potential of lower grade shear zones concentrated close to the contact between the diorite intrusion complex and intermediate volcanic rocks that do not currently reach the surface in the current mineral resource estimate. Hole MMD-24-139 was drilled from south of Snodgrass Lake to target the up-dip potential of marginal shears and the deeper extension of core shears below the conceptual open pit.
Hole MMD-24-135 collared into the edge of the high-grade mineralization and sheared altered granodiorite intrusion yielding grade intercepts such as 5.95m of 1.12 g/t Au from 6.5m depth. The hole quickly transitions into the wide multi-stage silica-sericite and epidote-chlorite altered diorite intrusion package, as is typical of the peripheral areas of the Southwest Zone, yielding broad lower grade intercepts such as 20.0m of 0.89 g/t Au from 81.0m, including 3.85m of 2.86 g/t Au from 87.0m, and 26.0m of 0.61 g/t Au from 107.0m, including 5.7m of 1.17 g/t Au from 107.0m.
Hole MMD-24-138 encountered a varying sequence of andesitic and dacitic volcanic rocks with a swarm of narrow sericite-silica-hematite to epidote-chlorite altered diorite dykes. Local shearing of the volcanics and diorites concentrates mineralization yielding intercepts such as 20.8m of 0.76 g/t Au from 108.8m, including 2.05m of 3.33 g/t Au from 123.3m. The hole was terminated, as the remaining volume had been previously drilled from the southwestern side of the lake.
Drill hole MMD-24-139 intersected 10 to 20 meter-spaced mineralized sericite-silica-hematite altered sheared granodiorite dykes close to surface before entering the main diorite intrusion complex at 245.2m, which was drilled for the remainder of the hole. The diorite complex consisted of interchanging epidote-chlorite and sericite-silica-hematite alteration with varying shear intensity including a mylonitized zone along the contact of a chloritized gabbro and a sericite-silica-hematite altered granodiorite with 2-3% pyrite±chalcopyrite±molybdenite (Figure 3). Results highlight the potential of expanding the high-grade mineralization beyond that defined within the conceptual open pit with the 20.55m of 2.58 g/t Au from 458.15m, including 14.7m of 3.52 g/t Au. These intercepts occur 150 meters beneath the open pit constrained mineral resource. These results are top cut at 30 g/t Au, which only impacted a 1.0m veined shear assaying 36.1 g/t Au.
Figure 3: Hole MMD-24-139: Wide high-grade mylonitized sericite-chlorite-hematite altered diorite along the margin of a gabbroic intrusion returning 20.55m of 2.58g/t from 458.15-478.75m.
Intersections calculated above a 0.3 g/t Au cut off with a top cut of 30 g/t Au and a maximum internal waste interval of 5 metres. Shaded intervals are intersections calculated above a 1.0 g/t Au cut off. Intervals in bold are those with a grade thickness factor exceeding 20 gram x metres / tonne gold. True widths are approximate and assume a subvertical body.
Table 2: Drill Collars
HOLE
EAST
NORTH
RL
AZIMUTH
DIP
EOH
MMD-24-135
668,530
5,378,288
428
130
-45
228
MMD-24-138
668,606
5,377,956
428
315
-45
219
MMD-24-139
668,565
5,377,923
430
315
-50
537
Analytical and QA/QC Procedures
All samples were sent to ALS Geochemistry in Thunder Bay for preparation and analysis was performed in the ALS Vancouver analytical facility. ALS is accredited by the Standards Council of Canada (SCC) for the Accreditation of Mineral Analysis Testing Laboratories and CAN-P-4E ISO/IEC 17025. Samples were analysed for gold via fire assay with an AA finish (“Au-AA23”) and 48 pathfinder elements via ICP-MS after four-acid digestion (“ME-MS61”). Samples that assayed over 10 ppm Au were re-run via fire assay with a gravimetric finish (“Au-GRA21”).
In addition to ALS quality assurance / quality control (“QA/QC”) protocols, Goldshore has implemented a quality control program for all samples collected through the drilling program. The quality control program was designed by a qualified and independent third party, with a focus on the quality of analytical results for gold. Analytical results are received, imported to our secure on-line database and evaluated to meet our established guidelines to ensure that all sample batches pass industry best practice for analytical quality control. Certified reference materials are considered acceptable if values returned are within three standard deviations of the certified value reported by the manufacture of the material. In addition to the certified reference material, certified blank material is included in the sample stream to monitor contamination during sample preparation. Blank material results are assessed based on the returned gold result being less than ten times the quoted lower detection limit of the analytical method. The results of the on-going analytical quality control program are evaluated and reported to Goldshore by Orix Geoscience Inc.
Qualified Person
Peter Flindell, PGeo, MAusIMM, MAIG, Vice-President, Exploration, of the Company, and a qualified person under National Instrument 43-101 – Standards of Disclosure for Mineral Projects, has approved the scientific and technical information contained in this news release.
Mr. Flindell has verified the data disclosed. To verify the information related to the winter drill program at the Moss Gold Project, Mr. Flindell has visited the property several times; discussed and reviewed logging, sampling, bulk density, core cutting and sample shipping processes with responsible site staff; discussed and reviewed assay and QA/QC results with responsible personnel; and reviewed supporting documentation, including drill hole location and orientation and significant assay interval calculations. He has also overseen the Company’s health and safety policies in the field to ensure full compliance, and consulted with the Project’s host indigenous communities on the planning and implementation of the drill program, particularly with respect to its impact on the environment and the Company’s remediation protocols.
About Goldshore
Goldshore is a growth-oriented gold company focused on delivering long-term shareholder and stakeholder value through the acquisition and advancement of primary gold assets in tier-one jurisdictions. It is led by the ex-global head of structural geology for the world’s largest gold company and backed by one of Canada’s pre-eminent private equity firms. The Company’s current focus is the advanced stage 100% owned Moss Gold Project which is positioned in Ontario, Canada, with direct access from the Trans-Canada Highway, hydroelectric power near site, supportive local communities and skilled workforce. The Company has invested over $60 million of new capital and completed approximately 80,000 meters of drilling on the Moss Gold Project, which, in aggregate, has had over 235,000 meters of drilling. The 2024 updated NI 43-101 mineral resource estimate (“MRE”) has expanded to 1.54 million ounces of Indicated gold resources at 1.23 g/t Au and 5.20 million ounces of Inferred gold resources at 1.11 g/t Au. The MRE only encompasses 3.6 kilometers of the 35+ kilometer mineralized trend, remains open at depth and along strike and is one of the few remaining major Canadian gold deposits positioned for development in this cycle. Please see NI 43-101 technical report titled: “Technical Report and Updated Mineral Resource Estimate for the Moss Gold Project, Ontario, Canada,” dated March 20, 2024 with an effective date of January 31, 2024 available under the Company’s SEDAR+ profile at www.sedarplus.ca. For more information, please visit SEDAR+ (www.sedarplus.ca) and the Company’s website (www.goldshoreresources.com).
For More Information – Please Contact:
Michael Henrichsen President, Chief Executive Officer and Director Goldshore Resources Inc.
Neither the TSXV nor its Regulation Services Provider (as that term is defined in the policies of the TSXV) accepts responsibility for the adequacy or accuracy of this release.
This news release contains statements that constitute “forward-looking statements.” Such forward-looking statements involve known and unknown risks, uncertainties and other factors that may cause the Company’s actual results, performance or achievements, or developments to differ materially from the anticipated results, performance or achievements expressed or implied by such forward-looking statements. Forward-Looking statements are statements that are not historical facts and are generally, but not always, identified by the words “expects,” “plans,” “anticipates,” “believes,” “intends,” “estimates,” “projects,” “potential” and similar expressions, or that events or conditions “will,” “would,” “may,” “could” or “should” occur. Forward-Looking statements in this news release include, among others, statements relating to expectations regarding the exploration and development of the Moss Gold Project; the potential mineralization at the Moss Gold Project based on the winter drill program, including the potential for additional mineral resources; the enhancement of the Moss Gold Project and potential mining methods; the timing of technical reports and economic studies; statements regarding the Company’s future drill programs, including the expected benefits and results thereof; and other statements that are not historical facts.
By their nature, forward-looking statements involve known and unknown risks, uncertainties and other factors which may cause our actual results, performance or achievements, or other future events, to be materially different from any future results, performance or achievements expressed or implied by such forward-looking statements. Such factors and risks include, among others: uncertainty and variation in the estimation of mineral resources; risks related to exploration, development, and operation activities; exploration and development of the Moss Gold Project will not be undertaken as anticipated; the Company may require additional financing from time to time in order to continue its operations which may not be available when needed or on acceptable terms and conditions acceptable; the fluctuating price of gold; unknown liabilities in connection with acquisitions; compliance with extensive government regulation; delays in obtaining or failure to obtain governmental permits, or non-compliance with permits; environmental and other regulatory requirements; domestic and foreign laws and regulations could adversely affect the Company’s business and results of operations; risks related to natural disasters, terrorist acts, health crises, and other disruptions and dislocations; global financial conditions; uninsured risks; climate change risks; competition from other companies and individuals; conflicts of interest; risks related to compliance with anti-corruption laws; the Company’s limited operating history; intervention by non-governmental organizations; outside contractor risks; the stock markets have experienced volatility that often has been unrelated to the performance of companies and these fluctuations may adversely affect the price of the Company’s securities, regardless of its operating performance; and other risks associated with executing the Company’s objectives and strategies as well as those risk factors discussed in the Company’s continuous disclosure documents filed under the Company’s SEDAR+ profile at www.sedarplus.ca.
The forward-looking information in this news release is based on management’s reasonable expectations and assumptions as of the date of this news release. Certain material assumptions regarding such forward-looking statements were made, including without limitation, assumptions regarding: the future price of gold; anticipated costs and the Company’s ability to fund its programs; the Company’s ability to carry on exploration, development and mining activities; prices for energy inputs, labour, materials, supplies and services; the timing and results of drilling programs; mineral resource estimates and the assumptions on which they are based; the discovery of mineral resources and mineral reserves on the Company’s mineral properties; the timely receipt of required approvals and permits; the costs of operating and exploration expenditures; the Company’s ability to operate in a safe, efficient, and effective manner; the Company’s ability to obtain financing as and when required and on reasonable terms; that the Company’s activities will be in accordance with the Company’s public statements and stated goals; and that there will be no material adverse change or disruptions affecting the Company or its properties.
The forward-looking information contained in this news release represents the expectations of the Company as of the date of this news release and, accordingly, is subject to change after such date. There can be no assurances that such statements will prove to be accurate and actual results and future events could differ materially from those anticipated in such statements. Readers should not place undue importance on forward-looking information and should not rely upon this information as of any other date. The Company undertakes no obligation to update these forward-looking statements in the event that management’s beliefs, estimates or opinions, or other factors, should change.
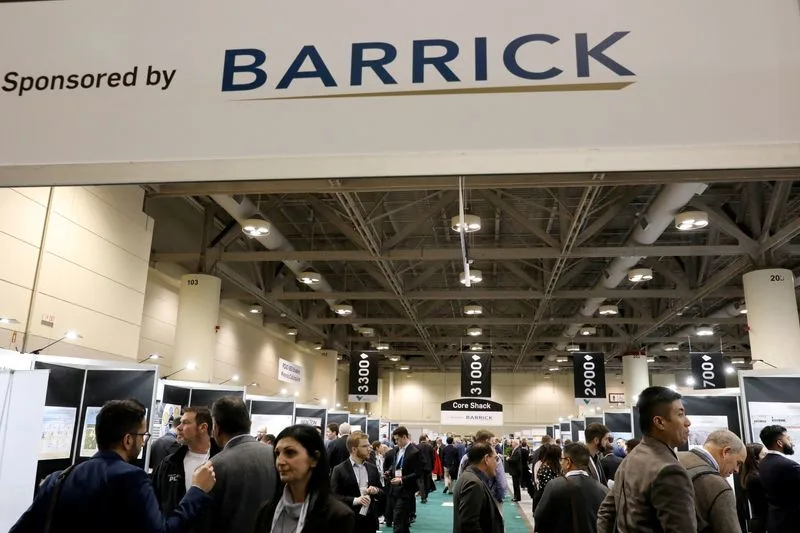
Prospectors and Developers Association of Canada (PDAC) annual conference in Toronto · Reuters
(Reuters) – Canadian miner Barrick Gold has signed a new agreement with the Malian government to end an almost two-year-old dispute over its mining assets in the West African country, two people familiar with the developments told Reuters on Wednesday.
Barrick signed the agreement and now it is up to the Mali government to formally approve the deal, the sources told Reuters. An official announcement could come as early as Thursday.
As part of the new agreement, Barrick will pay 275 billion CFA or $438 million to the Mali government, in return for the release of detained employees, seized gold, and restarting the operations at the Loulo-Gounkoto mine.
Barrick did not respond to an email query by Reuters. A spokesperson for Mali’s mines ministry declined to comment.
The Toronto-based miner and Mali have been locked in a dispute since 2023 over the implementation of the West African country’s new mining code that gives Mali government a greater share in the country’s gold mine.
(Reporting by Divya Rajagopal, Giulia Paravicini and Portia Crowe, editing by Silvia Aloisi)
North Vancouver, British Columbia–(Newsfile Corp. – February 19, 2025) – Lion One Metals Limited(TSXV: LIO) (OTCQX: LOMLF) (“Lion One” or the “Company“) is pleased to report significant new high-grade gold results from 3,312.5 meters of near mine exploration and infill drilling at its 100% owned Tuvatu Alkaline Gold Project in Fiji. The drilling is focused on the West Zone target west of the Tuvatu Gold Mine.
The West Zone is located approximately 300 m to the west of the main Tuvatu deposit, in close proximity to existing mine infrastructure. Drilling was conducted from two surface drill pads and consisted of resource infill and expansion drilling with the purpose of bringing the West Zone into the long term mine plan for Tuvatu. High-grade mineralized structures were intersected in 14 drill holes. Drill results include multiple bonanza grade gold assays such as 896.00 g/t, 306.78 g/t, 264.55 g/t, and 178.55 g/t gold over narrow widths of 0.3 m. All high-grade gold results were intersected between 30 m and 150 m depth from surface. The West Zone is hypothesized to have a separate feeder system from Tuvatu and represents a prime target for near-mine resource expansion at Tuvatu. Bonanza grade gold results are not uncommon at the West Zone, with previous drill results including 105.20 g/t over 2.1 m and 102.38 g/t over 1.2 m (see news release dated October 1, 2024). The West Zone drill program is ongoing.
Lion One Chairman and CEO Walter Berukoff commented: “We’re very pleased with the new results from our West Zone drill program. The West Zone is an excellent near mine expansion target. It is readily accessible from existing infrastructure and it consistently returns high grade results from near surface drilling. We look forward to adding the West Zone to our long-term mine plan at Tuvatu.”
Highlights of New Drill Results:
198.84 g/t Au over 1.4 m (including 896.00 g/t Au over 0.3 m) (TUDDH-764, from 34.17 m depth)
61.24 g/t Au over 2.0 m (including 264.55 g/t Au over 0.3 m) (TUDDH-773, from 200 m depth)
306.78 g/t Au over 0.3 m (TUDDH-773, from 213 m depth)
35.79 g/t Au over 1.7 m (including 178.55 g/t Au over 0.3 m) (TUDDH-773, from 182 m depth)
6.68 g/t Au over 4.4 m (TUDDH-758, from 102.81 m depth)
31.00 g/t Au over 1.0 m (including 67.00 g/t Au over 0.3 m) (TUDDH-758, from 75.5 m depth)
13.76 g/t Au over 1.9 m (including 29.28 g/t Au over 0.3 m) (TUDDH-763, from 86.2 m depth)
15.17 g/t Au over 1.5 m (including 27.99 g/t Au over 0.4 m) (TUDDH-762, from 75.55 m depth)
23.60 g/t Au over 0.9 m (TUDDH-774, from 48 m depth)
61.58 g/t Au over 0.3 m (TUDDH-759, from 62.6 m depth)
*Drill intersects are downhole lengths, 3.0 g/t cutoff. True width not known. See Table 1 for additional data.
Figure 1. Location of the West Zone drilling reported in this news release. Left image: Plan view of the West Zone drilling in relation to the mineralized lodes shown in grey and Tuvatu underground development shown in red. Right image: Section view of the West Zone drilling looking east.
The West Zone is located approximately 300 m to the west of the main Tuvatu deposit. It is modelled as a series of mainly east-west oriented lodes dipping steeply to the south. High grade gold has been sampled at surface in the West Zone and the area is coincident with a steeply dipping CSAMT gradient. Given the steeply dipping nature of the mineralized lodes both at Tuvatu and at the West Zone, and given the horizontal distance between the two systems, it is unlikely that they are fed by the same feeder zone. It is therefore hypothesized that there is a separate feeder zone located at depth below the West Zone, which would be distinct from the very high-grade Zone 500 feeder zone at Tuvatu.
The drilling reported here is focused on the near-surface portion of the West Zone system and consists predominantly of infill drilling in areas of low drill density. The purpose of the program is to increase understanding of the near-surface structure and mineralization of the West Zone. The objective is to bring the West Zone into the long-term mine plan at Tuvatu, and the current drill program will help inform that process. Given the proximity of the West Zone to existing surface infrastructure, a second portal may be opened to provide direct underground access to the West Zone. Alternatively, an underground access drive could be developed from Tuvatu. The high-grade results reported here not only serve to further define the resource, but also to help determine which development option is preferred.
Figure 2. West Zone drilling with high-grade intersects highlighted, 3.0 g/t gold cutoff. Section view looking east. High-grade gold mineralization is intersected near surface in the West Zone.
The information in this report that relates to mineral exploration at the Tuvatu Gold Project is based on information compiled by the Lion One team and has been reviewed and approved by Melvyn Levrel, who is the company’s Senior Geologist. Mr Levrel is a Member of the Australian Institute of Geoscientists and has sufficient experience that is relevant to the style of mineralisation and type of deposit under consideration, and to the activity being undertaken, to qualify as a Qualified Person as defined by National Instrument 43-101 – Standards of Disclosure for Mineral Projects (“NI 43- 101”). Mr Levrel consents to the inclusion in this report of the matters based on the information in the form and context in which it appears.
Lion One Laboratories / QAQC
Lion One adheres to rigorous QAQC procedures above and beyond basic regulatory guidelines in conducting its drilling, sampling, testing, and analyses. The Company operates its own geochemical assay laboratory and its own fleet of diamond drill rigs using PQ, HQ and NQ sized drill rods.
Diamond drill core samples are logged by Lion One personnel on site. Exploration diamond drill core is split by Lion One personnel on site, with half core samples sent for analysis and the other half core remaining on site. Grade control diamond drill core is whole core assayed. Core samples are delivered to the Lion One Laboratory for preparation and analysis. All samples are pulverized at the Lion One lab to 85% passing through 75 microns and gold analysis is carried out using fire assay with an AA finish. Samples that return grades greater than 10.00 g/t Au are re-analyzed by gravimetric method, which is considered more accurate for very high-grade samples.
Duplicates of 5% of samples with grades above 0.5 g/t Au are delivered to ALS Global Laboratories in Australia for check assay determinations using the same methods (Au-AA26 and Au-GRA22 where applicable). ALS also analyses 33 pathfinder elements by HF-HNO3-HClO4 acid digestion, HCl leach and ICP-AES (method ME-ICP61). The Lion One lab can test a range of up to 71 elements through Inductively Coupled Plasma Optical Emission Spectrometry (ICP-OES), but currently focuses on a suite of 26 important pathfinder elements with an aqua regia digest and ICP-OES finish.
About Lion One Metals Limited
Lion One Metals is an emerging Canadian gold producer headquartered in North Vancouver BC, with new operations established in late 2023 at its 100% owned Tuvatu Alkaline Gold Project in Fiji. The Tuvatu project comprises the high-grade Tuvatu Alkaline Gold Deposit, the Underground Gold Mine, the Pilot Plant, and the Assay Lab. The Company also has an extensive exploration license covering the entire Navilawa Caldera, which is host to multiple mineralized zones and highly prospective exploration targets.
On behalf of the Board of Directors, Walter Berukoff, Chairman & CEO
Neither the TSX-V nor its Regulation Service Provider accepts responsibility or the adequacy or accuracy of this release
This press release may contain statements that may be deemed to be “forward-looking statements” within the meaning of applicable Canadian securities legislation. All statements, other than statements of historical fact, included herein are forward-looking information. Generally, forward-looking information may be identified by the use of forward-looking terminology such as “plans”, “expects” or “does not expect”, “proposed”, “is expected”, “budget”, “scheduled”, “estimates”, “forecasts”, “intends”, “anticipates” or “does not anticipate”, or “believes”, or variations of such words and phrases, or by the use of words or phrases which state that certain actions, events or results may, could, would, or might occur or be achieved. This forward-looking information reflects Lion One Metals Limited’s current beliefs and is based on information currently available to Lion One Metals Limited and on assumptions Lion One Metals Limited believes are reasonable. These assumptions include, but are not limited to, the actual results of exploration projects being equivalent to or better than estimated results in technical reports, assessment reports, and other geological reports or prior exploration results. Forward-looking information is subject to known and unknown risks, uncertainties and other factors that may cause the actual results, level of activity, performance, or achievements of Lion One Metals Limited or its subsidiaries to be materially different from those expressed or implied by such forward-looking information. Such risks and other factors may include, but are not limited to: the stage development of Lion One Metals Limited, general business, economic, competitive, political and social uncertainties; the actual results of current research and development or operational activities; competition; uncertainty as to patent applications and intellectual property rights; product liability and lack of insurance; delay or failure to receive board or regulatory approvals; changes in legislation, including environmental legislation, affecting mining, timing and availability of external financing on acceptable terms; not realizing on the potential benefits of technology; conclusions of economic evaluations; and lack of qualified, skilled labor or loss of key individuals. Although Lion One Metals Limited has attempted to identify important factors that could cause actual results to differ materially from those contained in forward-looking information, there may be other factors that cause results not to be as anticipated, estimated, or intended. Accordingly, readers should not place undue reliance on forward-looking information. Lion One Metals Limited does not undertake to update any forward-looking information, except in accordance with applicable securities laws.
Appendix 1: Full Drill Results and Collar Information
Table 1. Collar coordinates for drillholes reported in this release. Coordinates are in Fiji map grid.
Hole ID
Easting
Northing
Elevation
Azimuth
Dip
Depth
TUDDH-757
1875838
3920802
141
139.5
-28.7
182.0
TUDDH-758
1875837
3920802
141
143.4
-51.5
201.5
TUDDH-759
1875837
3920802
141
150.3
-43.5
153.6
TUDDH-762
1875837
3920801
142
166.8
-8.1
106.5
TUDDH-763
1875837
3920802
141
165.1
-29.9
280.0
TUDDH-764
1875836
3920802
142
185.4
-21.1
200.0
TUDDH-765
1875836
3920802
141
180.4
-42.7
290.0
TUDDH-766
1875836
3920802
140
182.5
-50.1
280.0
TUDDH-769
1875836
3920803
141
184.9
-60.5
218.5
TUDDH-771
1875835
3920801
141
198.2
-30.1
14.4
TUDDH-772
1875835
3920802
141
198.3
-31.3
230.6
TUDDH-773
1875972
3920693
211
310.4
-57.2
350.0
TUDDH-774
1875836
3920802
141
199.7
-48.2
170.4
TUDDH-775
1875835
3920803
141
205.1
-58.8
134.9
TUDDH-776
1875834
3920802
141
218.1
-30.0
230.0
TUDDH-777
1875973
3920695
211
346.5
-56.7
270.1
Table 2. Composite intervals from drillholes reported in this news release (composite grade >3.0 g/t Au, with <1 m internal dilution at <3.0 g/t Au).
North Vancouver, British Columbia–(Newsfile Corp. – February 14, 2025) – Lion One Metals Limited (TSXV: LIO) (OTCQX: LOMLF) (“Lion One” or the “Company“), is pleased to announce that the Company has closed the underwritten offering (the “Offering“) previously announced on February 5, 2025 by issuing 25,367,647 units of the Company (the “Units“) at a price of $0.34 per Unit (the “Offering Price“) for aggregate gross proceeds of $8,625,000.00, which includes the exercise, in full, by the Underwriters (as defined below) of the over-allotment option granted by the Company to purchase up to an additional 3,308,823 Units at the Offering Price pursuant to the terms of an underwriting agreement (the “Underwriting Agreement“) dated as of February 10, 2025, among the Company, Stifel Nicolaus Canada Inc. (the “Lead Underwriter“) and Canaccord Genuity Corp. (together with the Lead Underwriter, the “Underwriters“).
Concurrently with the Offering, the Company completed a non-brokered private placement (the “Sidecar Private Placement“) of 6,431,114 Units on the same terms as the Offering for gross proceeds of $2,186,578.76 pursuant to applicable exemptions under National Instrument 45-106 – Prospectus Exemptions. All securities issuable pursuant to the Sidecar Private Placement will be subject to a four month hold period in accordance with applicable Canadian securities laws, expiring on June 15, 2025.
In aggregate, under the Offering the Company issued 31,798,761 Units for gross proceeds of $10,811,578.74.
Each Unit consists of one common share (a “Common Share“) in the capital of the Company and one common share purchase warrant (a “Warrant“) of the Company. Each Warrant shall be exercisable to acquire one Common Share (a “Warrant Share“) at a price per Warrant Share of C$0.41 for a period of 36 months from the closing date of the Offering. The Company has applied to list the Warrants issued pursuant to the Offering on the TSX Venture Exchange, subject to the satisfaction of listing conditions which are currently in process.
In connection with the Offering, the Company paid to the Underwriters a cash commission of $603,750.00, which was equal to 7.0% of the gross proceeds from the Offering, and issued an aggregate of 1,775,735 broker warrants, equal to 7.0% of the number of Units sold pursuant to the Offering. In connection with the Sidecar Private Placement, the Company paid finder’s fees in an aggregate amount of $76,377.60 in cash and issued 224,640 broker warrants. Each broker warrant is exercisable for one Common Share at a price of C$0.34 for a period of 36 months from the closing date of the Offering.
The net proceeds received by the Company from the sale of the Units will be used for mining and mill equipment and ongoing exploration activities at the Tuvatu Gold project located in Fiji, as well as for general corporate expenses & purposes. The Units issued pursuant to the Offering were qualified for distribution by way of a prospectus supplement of the Company dated February 10, 2025 (the “Prospectus Supplement“) to the Company’s existing short form base shelf prospectus dated January 31, 2025 (the “Base Shelf Prospectus“) filed in all of the Provinces and Territories of Canada, and offered and sold in all the Provinces and Territories of Canada other than Quebec and Nunavut and to eligible purchasers by way of available prospectus exemptions in certain jurisdictions outside of Canada. The Base Shelf Prospectus, the Prospectus Supplement, the documents incorporated by reference therein and the Underwriting Agreement are available on the Company’s profile on SEDAR+ at www.sedarplus.ca.
Certain subscribers under the Sidecar Private Placement are directors and management of the Company. The issuance of Units to directors and management of the Company constitutes a “related party transaction” as defined under Multilateral Instrument 61-101 (“MI 61-101”). The transactions are exempt from the formal valuation and minority shareholder approval requirements of MI 61-101 as neither the fair market value of any securities issued or the consideration paid by such persons will exceed 25% of the Company’s market capitalization.
The securities referred to herein have not been and will not be registered under the United States Securities Act of 1933, as amended (the “U.S. Securities Act“), or any U.S. state securities laws, and may not be offered or sold in the “United States” (as such term is defined in Regulation S under the U.S. Securities Act) unless registered under the U.S. Securities Act and applicable U.S. state securities laws or an exemption from such registration is available. This news release shall not constitute an offer to sell or the solicitation of an offer to buy nor shall there be any sale of the securities in any jurisdiction in which such offer, solicitation or sale would be unlawful.
About Lion One Metals Limited
Lion One is an emerging Canadian gold producer headquartered in North Vancouver, B.C., with new operations established in late 2023 at its 100% owned Tuvatu Alkaline Gold Project in Fiji. The Tuvatu project comprises the high-grade Tuvatu Alkaline Gold Deposit, the Underground Gold Mine, the Pilot Plant, and the Assay Lab. The Company also has an extensive exploration license covering the entire Navilawa Caldera, which is host to multiple mineralized zones and highly prospective exploration targets.
On behalf of the Board of Directors of Lion One Metals Limited “Walter Berukoff“ Chairman and CEO
Neither the TSX Venture Exchange nor its Regulation Services Provider (as that term is defined in the policies of the TSX Venture Exchange) accepts responsibility for the adequacy or accuracy of this news release. No stock exchange, securities commission or other regulatory authority has approved or disapproved the information contained herein.
This press release may contain statements that may be deemed to be “forward-looking statements” within the meaning of applicable Canadian securities legislation. All statements, other than statements of historical fact, included herein are forward-looking information. Generally, forward-looking information may be identified by the use of forward-looking terminology such as “plans”, “expects” or “does not expect”, “proposed”, “is expected”, “budget”, “scheduled”, “estimates”, “forecasts”, “intends”, “anticipates” or “does not anticipate”, or “believes”, or variations of such words and phrases, or by the use of words or phrases which state that certain actions, events or results may, could, would, or might occur or be achieved. This forward-looking information reflects Lion One Metals Limited’s current beliefs and is based on information currently available to Lion One Metals Limited and on assumptions Lion One Metals Limited believes are reasonable. These assumptions include, but are not limited to, the results of the Offering and associated marketing efforts and the use of proceeds of the Offering. Forward-looking information is subject to known and unknown risks, uncertainties and other factors that may cause the actual results, level of activity, performance, or achievements of Lion One Metals Limited or its subsidiaries to be materially different from those expressed or implied by such forward-looking information. Such risks and other factors may include, but are not limited to: prevailing capital markets conditions, the stage development of Lion One Metals Limited, general business, economic, competitive, political and social uncertainties; the actual results of current research and development or operational activities; competition; uncertainty as to patent applications and intellectual property rights; product liability and lack of insurance; delay or failure to receive board or regulatory approvals; changes in legislation, including environmental legislation, affecting mining, timing and availability of external financing on acceptable terms; not realizing on the potential benefits of technology; conclusions of economic evaluations; and lack of qualified, skilled labour or loss of key individuals. Although Lion One Metals Limited has attempted to identify important factors that could cause actual results to differ materially from those contained in forward-looking information, there may be other factors that cause results not to be as anticipated, estimated, or intended. Accordingly, readers should not place undue reliance on forward-looking information. Lion One Metals Limited does not undertake to update any forward-looking information, except in accordance with applicable securities laws.
WASHINGTON/SINGAPORE/TAIPEI (Reuters) -The White House is seeking to renegotiate U.S. CHIPS and Science Act awards and has signaled delays to some upcoming semiconductor disbursements, two sources familiar with the matter told Reuters.
The people, along with a third source, said the new administration is reviewing the projects awarded under the 2022 law, meant to boost American domestic semiconductor output with $39 billion in subsidies.
Washington plans to renegotiate some of the deals after assessing and changing current requirements, according to the sources. The extent of the possible changes, and how they would affect agreements already finalized, was not immediately clear. It was not known whether any action has yet been taken.
“The CHIPS Program Office has told us that certain conditions that do not align with President (Donald) Trump’s executive orders and policies are now under review for all CHIPS Direct Funding Agreements,” GlobalWafers spokesperson Leah Peng said in a statement to Reuters.
Taiwan’s GlobalWafers, which said it has not been notified directly by Washington of any changes to the conditions or terms of their awards, is set to receive $406 million in U.S. government grants for projects in Texas and Missouri. The company is currently set to receive subsidies only after it achieves specific milestones later in 2025.
Illustration picture of semiconductor chips on a circuit board
Each award recipient has distinct terms and milestones in their agreements.
Four sources with knowledge of the discussions told Reuters that the White House is concerned about many of the terms underpinning the $39 billion Chips and Science Act industry subsidies.
Those encompass additional clauses, including requirements added into contracts by the administration of President Joe Biden, including that recipients must use unionized labor to build factories and help provide affordable childcare for factory workers.
The White House and the U.S. Department of Commerce did not immediately respond to requests for comment.
The Semiconductor Industry Association, a trade group representing the chip industry, has started asking members how the program could be improved.
But David Isaacs, vice president of government affairs for the group, said: “It’s important both the manufacturing incentives and research programs proceed without disruption, and we stand ready to work with Commerce Secretary Nominee (Howard) Lutnick and other members of the Trump administration to streamline the program’s requirements and achieve our shared goal of strengthening U.S. leadership in chip technology.”
Since taking office, Trump has issued a series of executive orders aimed at dismantling diversity, equity and inclusion programs across the federal government and the private sector.
One of the sources said the White House is also frustrated by companies that accepted CHIPS Act subsidies and then announced significant overseas expansion plans, including in China. The law allowed some investments in China.
Intel (INTC), for example, announced a $300 million investment in a Chinese assembly and test facility in October, after saying in March that it had won a major award under the CHIPS Act.
Many of the biggest recipients of the CHIPS Act funding – including Intel, TSMC (TSM), Samsung Electronics and SK Hynix – all have major manufacturing facilities in China.
Intel disclosed it had received two payments totaling $2.2 billion in funding from the CHIPS Act, but declined to comment.
A TSMC spokesperson said the company had received $1.5 billion in CHIPS Act monies before the new administration came in as per the milestone terms of its agreement.
The spokesperson declined comment on any possible changes to its agreement under Trump but said the company is continuing to engage with the Chips Program Office.
Samsung, SK Hynix and Hemlock Semiconductor declined to comment, while Bosch referred Reuters to the Chips Office. Micron and GlobalFoundries did not respond to requests for comment.
(Reporting by Mike Stone and Karen Freifeld in Washington, Fanny Potkin in Singapore, Wen-Yee Lee in Taipei and Stephen Nellis and Max Cherney in San FranciscoWriting by Stephen Nellis and Fanny Potkin; Editing by Chris Sanders and Matthew Lewis)
Production at Krastsvetmet precious metals plant in Krasnoyarsk · Reuters
By Polina Devitt
LONDON (Reuters) – Gold prices have marched into uncharted territory as bulls latch on to economic uncertainty created by U.S. import tariff plans, but behind the prize of hitting a record $3,000 per ounce, some flags of a bear case are also being planted.
Bullion has had a storming start to 2025, smashing eight records to rise more than 10% by February 11. That followed its biggest annual gain in 14 years in 2024, on a heady mix of strong central bank purchases, geopolitical uncertainties and monetary policy easing.
Gold’s appeal as a haven from risk strengthened further as newly elected U.S. President Donald Trump turned to tariffs to aid struggling domestic industry, despite the risk of sparking a trade war.
When Trump raised tariffs on steel and aluminium this week, spot gold hit a record $2,942.70 per ounce.
“What we have seen is the change in the motive for safe-haven buying – from being driven by the Middle East uncertainty to the threat and realisation of tariffs,” said Philip Newman, managing director at consultancy Metals Focus.
The scale of last year’s growth, which started before the Federal Reserve started easing interest rates, was unexpected, with investors apparently willing to disregard the opportunity cost of holding zero-yielding gold. The market also often de-coupled from other usual headwinds such as a stronger dollar.
“Strikingly, gold was rallying as inflation eased, and it looked as though all of our understanding of how gold prices behaved was being challenged,” said independent analyst Ross Norman.
Gold bulls have been emboldened by concerns that U.S. tariff plans could affect gold supplies to the United States, where Comex gold futures trade.
As a result, the premium at which most-active U.S. gold futures trade over the London spot price – historically just a few dollars – saw wild volatility and widened to $40 per ounce just before Trump’s inauguration on January 20 and more than $60 during the inauguration week.
Market players sought to benefit from a lucrative arbitrage opportunity or to cover their existing Comex positions, with the premium attracting massive deliveries to Comex gold inventories. These have jumped by 18.6 million troy ounces, worth $54 billion, since late November.
As bullion market players in London – home to the world’s largest over-the-counter gold trading hub – rushed to borrow gold from central banks storing bullion in Bank of England vaults, the waiting time to load gold out of the BoE swelled.
Switzerland and Asia-focused hubs saw a jump in supplies to the U.S., and gold lease rates surged both in London and India.
ACTIVITY PREDICTED TO FADE
But by Tuesday, the Comex premium had narrowed to $28 per ounce, and even while residuary inflows to Comex gold stocks continue, traders and analysts expect the activity to fade.
“Following a surge of gold imports into New York, it seems likely that the dislocation between New York futures prices and the London OTC market is nearing an end,” said John Reade, senior market strategist at the World Gold Council.
“As the next few weeks pass, queues getting gold from the Bank of England’s vaults should diminish, easing an apparent shortage of liquidity in the London market.”
Nicky Shiels, head of metals strategy at MKS PAMP SA, said that while prices could break out towards $3,200, resolution of physical gold dislocations attributed to tariffs and potential structural changes including reduced risk appetite, reduced participation and reduced liquidity are increasingly bearish.
She said her firm’s average price forecast for 2025 would remain at $2,750, with no intention to revise forecasts up. “If anything, the recent structural developments these past months have strengthened the bear case for gold,” she said.
Further pointing to potential easing in the rally once the situation with tariffs becomes clear, jewellery demand has been depressed by high gold prices, with discounts offered in key markets India and China. [GOL/AS]
Cartier maker Richemont said in November it was having to be “extremely cautious” about passing on soaring gold prices in its pricing of watches and jewellery.
Emerging market central banks, according to BofA Securities, are at risk of reducing gold buying if domestic currencies weaken on the U.S. tariffs.
Physically backed gold exchange-traded funds, which store bullion for investors, have also been relatively quiet, seeing inflows in Europe-listed funds but outflows in North America in January.
From a technical perspective, gold has been in the overbought zone of its relative strength index since the start of February. And gold can meet strong resistance around big milestones like $3,000 – gold faltered just above the $2,000 level several times before a decisive break last year.
(Reporting by Polina Devitt; Additional reporting by Ashitha Shivaprasad; Editing by Veronica Brown and Jan Harvey)
New inflation data out Wednesday showed headline consumer prices rose more than forecast in January as core prices reversed last month’s easing with the Federal Reserve’s path forward in focus.
The index rose 0.5% over the previous month, the largest monthly headline increase since August 2023 and a slight acceleration from the 0.4% rise seen in December. Economists had expected a 0.3% increase.
Seasonal factors like higher fuel costs and continued stickiness in food inflation kept the headline figures elevated. Notably, the index for eggs increased 15.2%, the largest increase since June 2015. It accounted for about two thirds of the total monthly food at home increase, according to the BLS.
On a “core” basis, which strips out the more volatile costs of food and gas, prices in January climbed 0.4% over the prior month, higher than December’s 0.2% monthly gain and the largest monthly rise since April 2023.
Core prices rose 3.3% over last year, marking an uptick from the 3.2% seen in December, which was the first time since July that year-over-year core CPI showed a deceleration in price growth.
Core inflation has remained stubbornly elevated due to sticky costs for shelter and services like insurance and medical care. Shelter did show some signs of easing last month, rising 4.4% on an annual basis, the smallest 12-month increase in three years.
It was a different story for used car prices, which saw another strong uptick for the fourth consecutive month. The index rose 2.2% in January after a 1.2% increase in December and a 2% monthly gain in November.
UNITED STATES – FEBRUARY 11: Federal Reserve Chairman Jerome Powell testifies during the Senate Banking, Housing and Urban Affairs Committee hearing titled “The Semiannual Monetary Policy Report to the Congress,” in Hart building on Tuesday, February 11, 2025. (Tom Williams/CQ-Roll Call, Inc via Getty Images) · Tom Williams via Getty Images
Although inflation has been slowing, it has remained above the Federal Reserve’s 2% target on an annual basis with economists and Fed officials pointing to a “bumpy” road ahead.
“There’s no sugarcoating this. This is not this is not a good print,” Claudia Sahm, chief economist at New Century Advisors and former Federal Reserve economist, told Yahoo Finance’s Morning Brief program.
“The one thing to say is this is a familiar disappointment,” she continued, noting the start of a new year has previously contributed to upside surprises. “Having a hot print in January in recent years has been a common occurrence. It’s also been a common occurrence that’s dissipated as the year has gone on. So this isn’t a deal breaker for the year as a whole, but it is certainly not a good way to start things off.”
Seema Shah, chief global strategist at Principal Asset Management, agreed, adding “seasonality and one-off factors may have played some role in the upside surprise.”
On Monday, President Trump announced global 25% tariffs on steel and aluminum imports, which will take effect on March 12. 25% tariffs on Mexico and Canada are set to come next month, while 10% duties on China have already been implemented.
Shortly after the release, traders scaled back expectations of a Fed rate cut, pricing in just one cut from the central bank this year. Stock futures also sold off on the news.
“The Fed is never going to overreact to one month of data,” Sahm said. “They’ve been telling us since December that they are in no hurry to adjust rates again and that will be reinforced today.”
“We’re back in the case of last year where we’re going to have to see months and months — getting out of the first quarter — of better inflation data before the Fed gets comfortable with it. So it really does push the timeline probably into the second half of the year [if] this ends up being the outlier.”
Alexandra Canal is a Senior Reporter at Yahoo Finance. Follow her on X @allie_canal, LinkedIn, and email her at alexandra.canal@yahoofinance.com.
Kelowna, British Columbia–(Newsfile Corp. – February 12, 2025) – F3 Uranium Corp (TSXV: FUU) (OTCQB: FUUFF) (“F3” or “the Company“) is pleased to announce that persistent prospective geological characteristics were intersected in the last eight drill holes of the 2024 program focused on continued exploration and expansion of the B1 conductor and A1 extension, as well as further testing of the Harrison Fault area. Geochemistry and assay results from 25 drill holes from 2024 JR Zone and exploration drilling are still outstanding and will be incorporated into the 2025 drill planning and released as they come available.
B1 Conductor:
PLN24-188 tested the B1 conductor 120m north of PLN24-168 (currently the southernmost hole to intersect B1); the drillhole was lost in unconsolidated sand. Retested with hole PLN24-195 which intersected strong bleaching, clay and hematite alteration. PLN24-190 on line 3360S targeted between strong boron anomalies intersected in both PLN24-122 and PLN24-135. The hole intersected strong sandstone dissolution, graphitic faulting in basement and up to 420cps at 568.5m within a hematite altered fault zone. PLN24-193 attempted to test the Athabasca Sandstone above the B1 conductor in an area devoid of previous drilling. The hole intersected strong sandstone alteration and sulfides in the sandstone.
A1 Extension south of Harrison Fault:
PLN24-189 tested the A1 extension on line 3450S approximately 200m along strike south of radioactivity intersected in PLN24-187. The hole intersected 360cps at a depth of 419m and a strongly hematite, clay and sericite rich fault zone from 503.4-537.1m, interpreted to be the continuation of the A1 structure, extending the fault zone to nearly 620m south of Harrison Fault. PLN24-191 was abandoned prior to target depth due to excessive drillhole deviation.
Harrison Fault Area:
PLN24-192 tested the basement wedge along the Harrison Fault between holes PLN24-146 and PLN24-162. The hole successfully intersected the wedge and strong associated alteration, with the lower Athabasca Sandstone displaying strong alteration and dravite breccias (See Image 1). PLN24-194 was planned 100m northeast of hole PLN24-142, testing the Harrison Fault further to the northwest. The hole successfully intersected the fault zone from 266-335.5m containing strong graphite and sulphide alteration. The intersection of the Harrison Fault and the A1 and B1 conductors continues to display very encouraging alteration and large-scale complex structures supported by strong geochemistry, such as in drillhole PLN24-152. The area remains a high priority exploration target.
Map 1. Patterson Lake North, 2024 Scintillometer Results
Natural gamma radiation in the drill core that is reported in this news release was measured in counts per second (cps) using a handheld Radiation Solutions RS-125 scintillometer. The Company considers greater than 300 cps on the handheld spectrometer as anomalous, >10,000 cps as high grade and greater than 65,535 cps as off-scale. The reader is cautioned that scintillometer readings are not directly or uniformly related to uranium grades of the rock sample measured and should be used only as a preliminary indication of the presence of radioactive materials.
Samples from the drill core are split into half sections on site. Where possible, samples are standardized at 0.5m down-hole intervals. One-half of the split sample is sent to SRC Geoanalytical Laboratories (an SCC ISO/IEC 17025: 2005 Accredited Facility) in Saskatoon, SK while the other half remains on site for reference. Analysis includes a 63 element suite including boron by ICP-OES, uranium by ICP-MS and gold analysis by ICP-OES and/or AAS.
The Company considers uranium mineralization with assay results of greater than 1.0 weight % U3O8 as “high grade” and results greater than 20.0 weight % U3O8 as “ultra-high grade”.
All depth measurements reported are down-hole and true thicknesses are yet to be determined.
About the Patterson Lake North Property:
The Company’s 42,961-hectare 100% owned Patterson Lake North Project (PLN) is located just within the south-western edge of the Athabasca Basin in proximity to Paladin’s Triple R and NexGen Energy’s Arrow high-grade uranium deposits, an area poised to become the next major area of development for new uranium operations in northern Saskatchewan. The PLN Project consists of the 4,074-hectare Patterson Lake North Property, the 19,864-hectare Minto Property, and the 19,022-hectare Broach Property. All three properties comprising the PLN Project are accessed by Provincial Highway 955; the new JR Zone uranium discovery on the PLN property is located 23km northwest of Paladin’s Triple R deposit.
Qualified Person:
The technical information in this news release has been prepared in accordance with the Canadian regulatory requirements set out in National Instrument 43-101 and approved on behalf of the company by Raymond Ashley, P.Geo., President & COO of F3 Uranium Corp, a Qualified Person. Mr. Ashley has verified the data disclosed.
About F3 Uranium Corp.:
F3 Uranium is a uranium exploration company, focusing on the recently discovered high-grade JR Zone on its Patterson Lake North (PLN) Project in the Western Athabasca Basin. F3 Uranium currently has 3 properties in the Athabasca Basin: Patterson Lake North, Minto, and Broach. The western side of the Athabasca Basin, Saskatchewan, is home to some of the world’s largest high grade uranium deposits including Triple R and Arrow and poised to become the next major area of high grade uranium operations in the world.
Forward-Looking Statements
This news release contains certain forward-looking statements within the meaning of applicable securities laws. All statements that are not historical facts, including without limitation, statements regarding future estimates, plans, programs, forecasts, projections, objectives, assumptions, expectations or beliefs of future performance, including statements regarding the suitability of the Properties for mining exploration, future payments, issuance of shares and work commitment funds, entry into of a definitive option agreement respecting the Properties, are “forward-looking statements.” These forward-looking statements reflect the expectations or beliefs of management of the Company based on information currently available to it. Forward-looking statements are subject to a number of risks and uncertainties, including those detailed from time to time in filings made by the Company with securities regulatory authorities, which may cause actual outcomes to differ materially from those discussed in the forward-looking statements. These factors should be considered carefully and readers are cautioned not to place undue reliance on such forward-looking statements. The forward-looking statements and information contained in this news release are made as of the date hereof and the Company undertakes no obligation to update publicly or revise any forward-looking statements or information, whether as a result of new information, future events or otherwise, unless so required by applicable securities laws.
The TSX Venture Exchange and the Canadian Securities Exchange have not reviewed, approved or disapproved the contents of this press release, and do not accept responsibility for the adequacy or accuracy of this release.
F3 Uranium Corp. 750-1620 Dickson Avenue Kelowna, BC V1Y9Y2
Contact Information Investor Relations Telephone: 778 484 8030 Email: ir@f3uranium.com
ON BEHALF OF THE BOARD “Dev Randhawa” Dev Randhawa, CEO
Vancouver, British Columbia–(Newsfile Corp. – February 11, 2025) – Emperor Metals Inc. (CSE: AUOZ) (OTCQB: EMAUF) (FSE: 9NH) (“Emperor“) is pleased to share the results from its 2024 drilling program, along with initial findings from its 2024 historical sampling program. The 2024 drilling program consisted of 8,166 meters across 19 drill holes, as well as approximately 8,000 meters of historical core assaying. To date, 100% of the new drilling assays have been reported; however, only 55% of the total assays for the 2024 season (including both new drilling and historical core resampling) have been finalized. All assays are expected to be completed by mid-February.
CEO John Florek commented:
“With intercepts like 43.9 m at 0.74 g/t Au (gold) in previously unsampled historical core and 2.5 m of 8.62 g/t Au, we are growing more confident in adding incremental ounces outside the known lenses. We are identifying new zones with both high-grade and lower-grade potential for open-pit mining, while also expanding these zones; critical for realizing our open-pit mining vision. We continue to extend the potential open-pit footprint, both at the margins and at depth.”
Highlights: (see tables 1 and 2 for complete results)
DQ24-18: Intersects 2.5 m of 8.62 g/t Au and 10.1 m of 0.5 g/t Au, expanding near-surface mineralization within the conceptual open-pit model.
DQ24-19: Intersects 4.7 m of 1.4 g/t Au and 9 m of 1.3 g/t Au, extending mineralization 70 m North-East within the conceptual open-pit shell.
DQ06-16 (Historical core): Adds 43.9 m of 0.74 g/t Au, including 17 m of 1.23 g/t Au and 9 m of 2.0 g/t Au, expanding mineralization westward in the Nip zone with minimal prior drilling.
DQ95-29 (Historical core): Adds 8.63 m of 1.26 g/t Au, expanding the deposit footprint 100 m westward into the hanging wall.
DQ06-01 (Historical core): Adds 7.25 m of 1.22 g/t Au, creating a new mineralized zone downhole within the current conceptual open-pit model, previously overlooked.
DO-10-12 (Historical core): Adds 15.05 m of 0.9 g/t Au, expanding the original zone near-surface within the open-pit model.
Ongoing exploration efforts continue to demonstrate significant potential for resource expansion both within and along strike of the conceptual open pit. This includes the discovery of previously unrecognized low-grade bulk tonnage zones, as well as high-grade gold lenses containing visible gold.
These findings are expected to make a significant contribution to the upcoming Q1 mineral resource estimate.
A total of 55% of the assays for the 2024 season have been reported to date. By focusing on near-surface drilling for open-pit mining, Emperor aims to economically expand its resource base by including lower grades in the conceptual open-pit environment compared to higher grades in an underground mining scenario. Deposits in the region with currently active open pits have been economic at grades equal 0.30 g/t Au (see Agnico Eagles press release dated Feb 15, 2024 – Detour Lake Deposit cut-off grade, pg. 52.)
Emperor is targeting a multi-million-ounce resource, utilizing a combination of conceptual open-pit and underground mining scenarios. The Property currently hosts a historical inferred mineral resource estimate of 727,000 ounces of gold at a grade of 5.42 g/t Au. Emperor is committed to delivering an updated Mineral Resource Estimate in Q1 or Early Q2 of 2025.
Figure 1: Location of DQ24-17 to DQ24-19 drill holes and reported results from previously unsampled historical core.
The 2024 drilling continues to validate low-grade bulk-tonnage and high-grade mineralization inside and external to the conceptual open-pit concept. In addition, the latest results from the historical sampling program have expanded zones of mineralization that were not identified in the historical core prior to Emperor Metals acquiring the property, adding incremental ounces to the deposit.
DQ24-18
Drillhole DQ24-18 intersected a significant zone of near-surface, high-grade gold mineralization within a mafic flow, featuring quartz-calcite veining, sericite stringers, and up to 1% pyrite mineralization associated with the veins.
DQ24-19
Drillhole DQ24-19 intersected multiple mineralized zones, including 4.7 m of 1.4 g/t Au in a mafic flow with chloritization, silicification, hematization, and 1-2% fine-grained pyrite. A lower intersection of 9 m of 1.3 g/t Au is located at the margins of a QFP and ultramafic unit, showing strong silicification, sericite stringers, and up to 3% fine-grained disseminated pyrite.
DQ06-16 (Historical core)
Historical core sampling of DQ06-16 identified a significant mineralized zone of 43.9 m at 0.74 g/t Au, which was previously overlooked by other companies. The zone is located in a Quartz Felspar Porphyry, featuring 2% pyrite mineralization, quartz-carbonate veins, and sericite alteration. This previously unsampled drillhole intercept highlights the value of assaying unsampled historical core, which is expected to positively impact the economics of the deposit.
DQ95-29 (Historical core)
Historical core sampling revealed a new interval, previously unsampled, with 8.63 m of 1.26 g/t Au. The zone consists of a weakly hematized mafic flow with small brecciated intervals, quartz-carbonate veining, and up to 1% pyrite.
DQ06-01 (Historical core)
Another significant new interval, previously unsampled, returned 7.25 m of 1.22 g/t Au, including 1.2 m of 6.85 g/t Au. The zone is located in a massive fine-grained mafic flow with carbonate stringers and up to 3% disseminated pyrite.
DO-10-12 (Historical core)
The project continues to add bulk tonnage to the conceptual open-pit model with the addition of 15.05 m of 0.9 g/t Au. This section is located within a shear zone containing a massive diorite, surrounded by andesitic and felsic rocks. The shear zone hosts approximately 2-3% pyrite, with local quartz-carbonate veinlets.
Strategic Plan
The 2024 drilling campaign at Emperor’s Duquesne West Gold Project in Quebec continues to identify extensive low-grade bulk tonnage zones surrounding the previously known high grade areas. These latest results further solidify the project’s immense potential and underscore the company’s commitment to unlocking substantial value for its shareholders.
The 2024 season leverages advanced exploration techniques to test several scenarios to add ounces and/or expand the footprint:
Explore Lower Grade Discoveries: Target additional discoveries within the host rock containing high-grade gold lenses, focusing on the conceptual open-pit model.
Increase the Thickness of the High-Grade Lenses: Incorporate previously unaccounted lower-grade gold from the margins of high-grade lenses to enhance their overall thickness.
Expand Mineralized Zones: Extend the lateral footprint of mineralized zones along strike and dip.
Discover New Zones: Explore potential new zones not yet included in the conceptual open-pit model, with a particular focus on eastward expansion.
These latest results continue to build on the strong momentum generated by last year’s drilling program and confirm the presences of extensive low grade bulk tonnage zones surrounding the known high-grade regions.
Table 1 – Intercept Highlights- Host Structures are interpreted to be steeply dipping and true widths are generally estimated to 90%.
Hole No.
From (m)
To (m)
Interval (m)
Au (g/t Au)
DQ24-171
8.7
9.7
1
0.34
Note1
9.7
10.7
1
0.005
10.7
11.7
1
0.11
11.7
12.7
1
1.27
12.7
13.7
1
0.74
13.7
14.7
1
0.17
14.7
15.7
1
0.01
15.7
16.7
1
0.28
16.7
17.7
1
0.06
17.7
18.7
1
0.28
Wt. Avg.
10
0.3
DQ24-171
27.7
28.7
1
0.34
28.7
29.7
1
0.34
29.7
30.7
1
0.42
30.7
31.7
1
0.18
31.7
32.7
1
0.33
Wt. Avg.
5
0.3
DQ24-171
53.2
54.2
1
0.94
DQ24-171
112.6
113.6
1
0.58
113.6
114.6
1
0.42
Wt. Avg.
2
0.5
DQ24-171
150.6
151.6
1
0.22
151.6
152.6
1
0.29
152.6
153.6
1
0.11
153.6
154.6
1
0.68
154.6
155.6
1
0.59
155.6
156.6
1
0.27
156.6
157.6
1
0.16
157.6
158.6
1
0.28
158.6
159.6
1
0.22
159.6
160.6
1
0.28
Wt. Avg.
10
0.3
Hole No.
From (m)
To (m)
Interval (m)
Au (g/t Au)
DQ24-181
18.3
19.8
1.5
2.1
Note1
19.8
20.9
1.1
0.005
Note1
20.9
23.4
2.5
0.005
Note1
23.4
25.9
2.5
0.005
25.9
28.4
2.5
0.86
Wt. Avg.
10.1
0.5
DQ24-181
65.8
68.3
2.5
8.62
DQ24-181
108.4
109.4
1
2.85
Hole No.
From (m)
To (m)
Interval (m)
Au (g/t Au)
DQ24-191
75.3
77.2
1.9
0.16
77.2
78.2
1
0.005
78.2
79.2
1
0.63
79.2
80.2
1
0.8
Wt. Avg.
4.9
0.4
DQ24-191
94.5
95.8
1.3
0.66
95.8
98.3
2.5
0.09
98.3
100.8
2.5
0.06
100.8
103.3
2.5
0.08
103.3
105.8
2.5
0.8
Wt. Avg.
11.3
0.3
DQ24-191
182.3
183.3
1
0.13
183.3
184.3
1
0.28
184.3
185.3
1
0.05
185.3
187
1.7
3.61
Wt. Avg.
4.7
1.4
DQ24-191
265.7
266.7
1
0.23
266.7
267.7
1
8.86
267.7
268.7
1
0.14
268.7
269.7
1
0.5
269.7
270.7
1
0.08
270.7
271.7
1
0.24
271.7
272.7
1
0.02
272.7
273.7
1
1.29
273.7
274.7
1
0.2
Wt. Avg.
9
1.3
DQ24-191
284.7
285.7
1
0.65
285.7
286.7
1
0.28
Wt. Avg.
2
0.5
DQ24-191
302.7
303.7
1
0.41
303.7
304.7
1
0.01
304.7
305.7
1
0.43
305.7
306.7
1
0.38
306.7
307.7
1
0.01
307.7
308.7
1
0.94
308.7
309.7
1
0.06
309.7
310.7
1
0.46
310.7
311.7
1
0.08
311.7
312.7
1
0.04
312.7
313.7
1
0.04
313.7
314.7
1
0.05
314.7
315.7
1
0.96
Wt. Avg.
13
0.3
1Host Structures are interpreted to be steeply dipping and true widths are generally estimated to 90%. 2Value reported below detection limit of <0.01. Value was numerically halved to assign a real number.
Table 2 – Historical core sampling Highlights- Host Structures are interpreted to be steeply dipping and true widths are generally estimated to 90%. Yellow highlighted tags represent 2024 historical core sampling previously not sampled.
Hole No.
Sample ID
From (m)
To (m)
Interval (m)
Au (g/t Au)
DQ06-161
D00296405
256.1
257.05
0.95
2.88
D00296406
257.05
258
0.95
0.005
D00296407
258
259
1
0.04
D00296408
259
260
1
0.31
D00296409
260
261
1
0.13
D00296411
261
262
1
0.005
D00296412
262
263
1
0.005
84175
263
264
1
2.57
D00296413
264
265
1
4.84
D00296414
265
266
1
0.70
D00296415
266
267
1
1.41
D00296416
267
268
1
2.03
D00296417
268
269
1
3.43
D00296418
269
270
1
0.77
84176
270
271
1
0.37
84177
271
272
1
1.92
84178
272
273
1
0.15
D00296419
273
274
1
0.05
D00296421
274
275
1
0.26
D00296422
275
276
1
0.09
D00296423
276
277
1
0.44
D00296425
277
278
1
0.05
D00296426
278
279
1
0.01
84179
279
280
1
1.87
84180
280
281
1
0.20
D00296427
281
282
1
0.07
D00296428
282
283
1
0.01
D00296429
283
284
1
0.005
D00296431
284
285
1
0.04
D00296432
285
286
1
0.005
D00296433
286
287
1
1.95
D00296434
287
288
1
1.13
D00296435
288
289
1
0.82
D00296436
289
290
1
0.46
D00296437
290
291
1
0.01
D00296438
291
292
1
0.005
D00296439
292
293
1
0.005
D00296441
293
294
1
0.40
D00296442
294
295
1
0.005
D00296443
295
296
1
0.12
D00296444
296
297
1
0.005
D00296445
297
298
1
0.02
D00296446
298
299
1
1.82
D00296447
299
300
1
1.09
Wt. Avg.
43.9
0.74
Including (263-290m)
27
0.95
Including (263-280m)
17
1.23
Including (263-272m)
9
2.00
Hole No.
Sample ID
From (m)
To (m)
Interval (m)
Au (g/t Au)
DQ95-291
D00295713
420
421.2
1.2
7.62
D00295714
421.2
422.4
1.2
0.02
D00295715
422.4
423.6
1.2
0.04
D00295716
423.6
424.8
1.2
0.005
D00295717
424.8
426
1.2
0.005
6502
426
426.75
0.75
0.02
5905
426.75
428.63
1.88
0.89
Wt. Avg.
8.63
1.26
Including (420-421.2m)
1.2
7.62
Hole No.
Sample ID
From (m)
To (m)
Interval (m)
Au (g/t Au)
DQ06-011
D00287734
397.55
398.55
1
0.10
D00287735
398.55
399.55
1
0.19
62680
399.55
400.15
0.6
0.15
D00287736
400.15
401.4
1.25
0.05
D00287737
401.4
402.6
1.2
0.03
D00287738
402.6
403.8
1.2
6.85
62681
403.8
404.8
1
0.17
Wt. Avg.
7.25
1.22
Including (402.6-403.8m)
1.2
6.85
Hole No.
Sample ID
From (m)
To (m)
Interval (m)
Au (g/t Au)
DO-10-121
47003
70.95
71.65
0.7
14.13
47004
71.65
72.85
1.2
0.067
47005
72.85
74.05
1.2
0.018
47006
74.05
75.2
1.15
0.089
47008
75.2
76.2
1
0.02
D00285086
76.2
77.6
1.4
0.05
D00285087
77.6
79
1.4
0.17
D00285088
79
80
1
0.38
D00285089
80
81
1
0.69
D00285091
81
82
1
0.74
D00285092
82
83
1
0.76
D00285093
83
84
1
0.28
D00285094
84
85
1
0.2
D00285095
85
86
1
0.12
Wt. Avg.
15.05
0.90
1Host Structures are interpreted to be steeply dipping and true widths are generally estimated to 90%.
Quality Assurance and Control
The Quality Assurance and Quality Control (QAQC) was conducted by Technominex, a geological contractor hired by Emperor Metals, which adheres to CIM Best Practices Guidelines for exploration related activities conducted at its facility in Rouyn Noranda, Quebec. The QA/QC procedures are overseen by a Qualified Person on site.
Emperor Metals QA/QC protocols are maintained through the insertion of certified reference material (standards), blanks and lab duplicates within the sample stream totaling approximately one QA/QC sample per 7 samples. Drill core is cut in-half with a diamond saw, with one-half placed in sealed bags with appropriate tags and shipped to the SGS Sudbury laboratory and the other half retained on site in the original core box. A dispatch list consists of 88 or 176 samples along with their corresponding QA/QC samples for a single batch. This allows complete batches (88 samples) for fire assay. A file for sample tracking records tags used and weights of sample bags shipped to the SGS Lakefield. Shipment is done by Manitoulin Transport and coordination by Technominex staff in Rouyn-Noranda.
The third-party laboratory, SGS prep laboratory in Sudbury Ontario, processes the shipment of samples using standard sample preparation (code PRP91) and produces pulps from the specified samples. The pulps are then sent off to SGS Burnaby for analysis. Chain of custody is maintained from the drill to the submittal into the laboratory preparation facility all the way to analysis at the SGS Burnaby B.C. laboratory.
Analytical testing is performed by SGS laboratories in Burnaby, British Columbia. The entire sample is crushed to 75% passing 2mm, with a split of 500g pulverized to 85% passing 75 microns. Samples are then analyzed using Au – ore grade 50g Fire Assay, ICP-AES with reporting limits of 0.01 -100 part per million (“ppm“). High grade gold analysis based on the presence of visible gold or a fire assay result exceeding 100 ppm, are analyzed by Au – metallic screening, 1kg screened to 106μm, 50g fire assay, gravimetric, AAS or ICP-AES of entire plus fraction and duplicate analysis of minus fraction. Reporting limit 0.01ppm.
About the Duquesne West Gold Project
The Duquesne West Gold Property is located 32 km northwest of the city of Rouyn-Noranda and 10 km east of the town of Duparquet, Quebec, Canada. The property lies within the historic Duparquet gold mining camp in the southern portion of the Abitibi Greenstone Belt in the Superior Province.
Under an Option Agreement, Emperor agreed to acquire a 100% interest in a mineral claim package comprising 38 claims covering approximately 1,389 ha, located in the Duparquet Township of Quebec (the “Duquesne West Property“) from Duparquet Assets Ltd., a 50% owned subsidiary of Globex Mining Enterprises Inc. For further information on the Duquesne West Property and Option Agreement, see Emperor’s press release dated Oct. 12, 2022, available on SEDAR.The Property hosts a historical inferred mineral resource estimate of 727,000 ounces of gold at a grade of 5.42 g/t Au1,2. The mineral resource estimate predates modern Canadian Institute of Mining and Metallurgy (“CIM“) guidelines and a Qualified Person on behalf of Emperor has not reviewed or verified the mineral resource estimate, therefore it is considered historical in nature and is reported solely to provide an indication of the magnitude of mineralization that could be present on the property. The gold system remains open for resource identification and expansion.
A reinterpretation of the existing geological model was created using AI and Machine Learning. This model shows the opportunity for additional discovery of ounces by revealing gold trends unknown to previous workers and the potential to expand the resource along significant gold- endowed structural zones.
Multiple scenarios exist to expand additional resources which include:
Underground High-Grade Gold.
Open Pit Bulk Tonnage Gold.
Underground Bulk Tonnage Gold.
QP Disclosure
The technical content for the Duquesne West Project in this news release has been reviewed and approved by John Florek, M.Sc., P.Geol., a Qualified Person pursuant to CIM guidelines.
About Emperor Metals Inc.
Emperor Metals Inc. is a high-grade gold exploration and development junior mining company focused on Quebec’s Southern Abitibi Greenstone Belt, leveraging AI-driven exploration techniques. The company is dedicated to unlocking the substantial resource potential of the Duquesne West Gold Project and the Lac Pelletier Project (currently under purchase agreement) both situated in this Tier 1 mining district.
The company is led by a dynamic group of resource sector professionals who have a strong record of success in evaluating and advancing mining projects from exploration through to production, attracting capital and overcoming adversity to deliver exceptional shareholder value. For more information, please refer to SEDAR+ (www.sedarplus.ca), under the Company’s profile.
ON BEHALF OF THE BOARD OF DIRECTORS
s/ “John Florek” John Florek, M.Sc., P.Geol President, CEO and Director Emperor Metals Inc.
Contact: John Florek President/CEO T: (807) 228-3531
Certain statements made and information contained herein may constitute “forward-looking information” and “forward-looking statements” within the meaning of applicable Canadian and United States securities legislation. These statements and information are based on facts currently available to the company and there is no assurance that the actual results will meet management’s expectations. Forward-looking statements and information may be identified by such terms as “anticipates,” “believes,” “targets,” “estimates,” “plans,” “expects,” “may,” “will,” “could” or “would.”
Forward-looking statements and information contained herein are based on certain factors and assumptions regarding, among other things, the estimation of mineral resources and reserves, the realization of resource and reserve estimates, metal prices, taxation, the estimation, timing and amount of future exploration and development, capital and operating costs, the availability of financing, the receipt of regulatory approvals, environmental risks, title disputes and other matters. While the company considers its assumptions to be reasonable as of the date hereof, forward-looking statements and information are not guarantees of future performance and readers should not place undue importance on such statements as actual events and results may differ materially from those described herein. The Company does not undertake to update any forward-looking statements or information except as may be required by applicable securities laws.
1 Watts, Griffis, and McOuat Consulting Geologists and Engineers, Oct. 20, 2011, Technical Report and Mineral Resource Estimate Update for the Duquesne-Ottoman Property, Quebec, Canada, for XMet Inc.
2 Power-Fardy and Breede, 2011. The Mineral Resource Estimate (MRE) constructed in 2011 is considered historical in nature as it was constructed prior to the most recent CIM standards (2014) and guidelines (2019) for mineral resources. In addition, the economic factors used to demonstrate reasonable prospects of eventual economic extraction for the MRE have changed since 2011. A qualified person has not done sufficient work to consider the MRE as a current MRE. Emperor is not treating the historical MRE as a current mineral resource. The reader is cautioned not to treat it, or any part of it, as a current mineral resource.

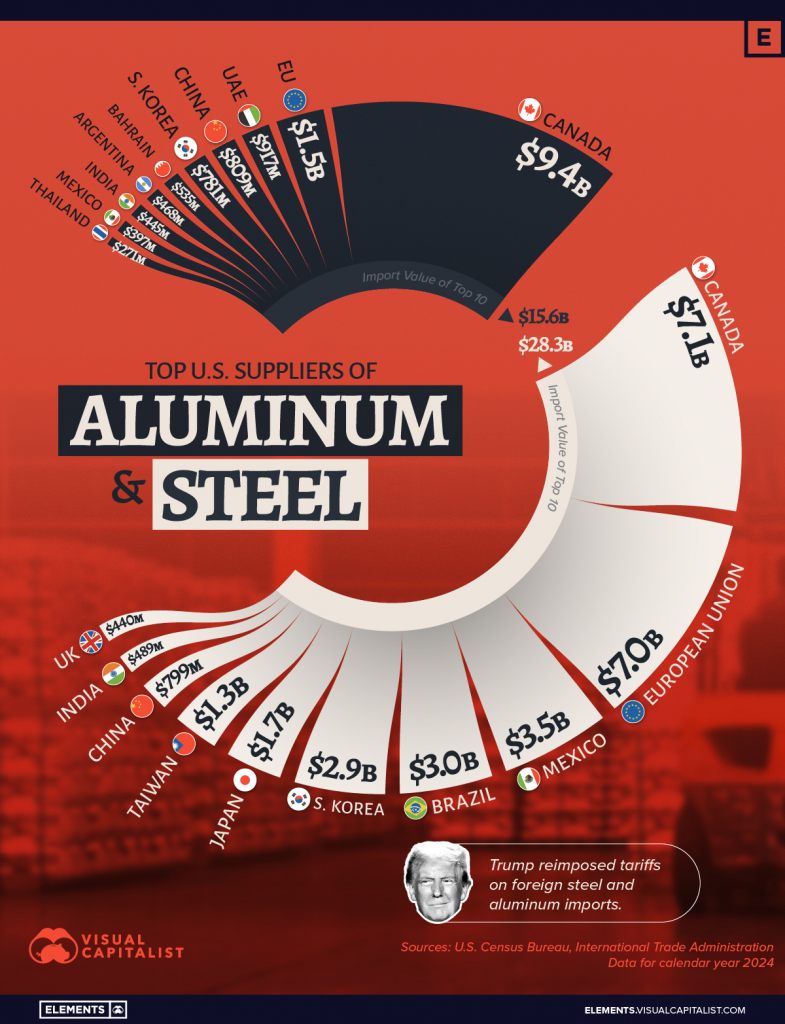
 Canada
 Mexico
 Brazil
 China
China Taiwan
 South Korea
 Germany
 Japan
Japan India
India European Union
 UAE
UAE Bahrain
 Argentina
 Thailand
 UK
UK