Key Takeaways
- Liquidity Crunch, Not a Broken Thesis: Gold was sold as a source of liquidity during forced deleveraging, not because its underlying fundamentals had weakened.
- Iran Shock Disrupted Reserve Flows: The conflict in Iran and the closure of the Strait of Hormuz (through which ~20% of global oil flows) halted energy revenues and stalled sovereign gold buying, removing a key pillar of demand.
- A Familiar Stress Pattern: Like 2008 and 2020, gold is reacting to liquidity pressure, not failing as a hedge.
- Setup for Gold’s Next Bull Phase: Structural pressures are building toward renewed monetary support—historically a powerful catalyst for gold.
Gold’s Dramatic Sell-Off
Since reaching an all-time high of $5,589.38 per ounce on January 28, 2026, gold has been a volatile ride. The major sell-off over the last three weeks in March has left gold in the $4,400 range. This dramatic pullback has surprised many investors. The decline has occurred against a backdrop that, under traditional frameworks, should have been supportive: elevated geopolitical risk, a major energy shock, rising volatility across asset classes and growing concerns about global growth. Yet gold has fallen sharply.
Gold is being sold in a liquidity-driven deleveraging.
We believe the move reflects a broad liquidity-driven selling event, driven by macro reserve-flow dynamics and forced deleveraging across investment portfolios. In short, gold is being sold because liquidity is being raised, not because its role as a strategic asset has diminished.
Figure 1. Gold Chart Highlighting Support Zone and 200-Day Moving Average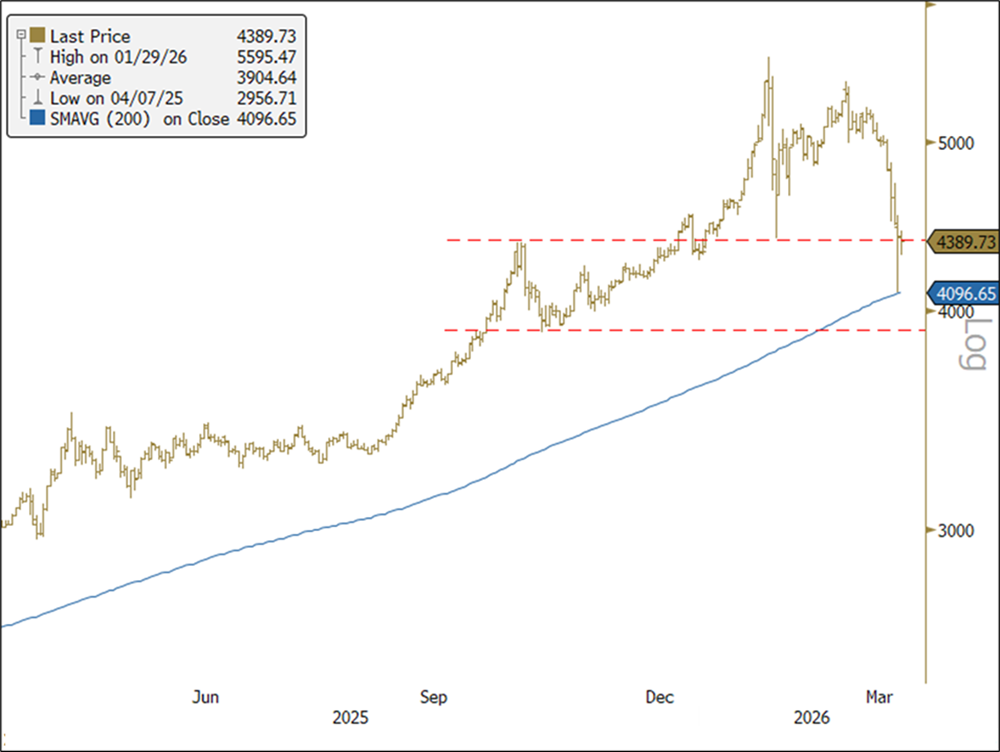
Source: Bloomberg. Data as of 3/24/2026. The spot gold price is measured by XAU Curncy. The 200‑day moving average is a technical indicator that represents the average closing price of an asset over the past 200 trading days. It is commonly used to assess an asset’s long‑term trend.
Gold Is Now Anchored to Reserve Flows
Since 2022, gold’s primary price anchor has shifted. Historically, Western investment flows dominated price action, with gold trading mostly as a function of market-related factors such as real rates, the dollar and risk sentiment. That regime has changed considerably.
The freezing of Russia’s foreign exchange reserves in 2022 fundamentally altered global reserve behavior. Excess reserves that once flowed primarily into U.S. Treasuries increasingly moved into gold. As a result, gold has become more tightly linked to reserve accumulation by central banks, sovereigns and sovereign wealth funds than to traditional portfolio flows.
This matters because reserve accumulation is inherently cyclical. It depends on trade surpluses, export revenues, and, critically in the current environment, commodity income. When those flows slow or reverse, gold demand at the margin weakens.
Hormuz Energy Shock Hit Gold Through Reserves
The closure of the Strait of Hormuz—stemming from the conflict involving Iran, the U.S. and Israel—has had a direct, underappreciated impact on gold through reserve flows.
The Hormuz oil shock hit energy markets and quietly drained the reserve flows that had been supporting gold.
Gulf Cooperation Council (GCC) countries are among the world’s largest accumulators of reserves, funded overwhelmingly by oil exports. With energy flows disrupted, reserve accumulation has stalled. In some cases, reserves are being drawn down to meet fiscal obligations. Importantly, prices are set at the margin: gold does not require outright selling to fall; the loss of incremental buying pressure is sufficient. In other words, a buyer cohort that had been buying gold at scale has abruptly stepped away. When marginal demand falls from very strong to nonexistent, prices adjust sharply even in the absence of any forced selling.
The spillover effects extend beyond the Gulf. The energy shock is primarily affecting Asia, where about 80% of Persian Gulf energy flows. Higher oil prices represent a negative terms of trade shock for energy importers, reducing surplus reserves and, in turn, incremental gold demand. Together, these reserve flow dynamics have removed a key pillar of near-term support for gold prices.
China is the world’s largest importer of oil, but is also the world’s largest gold buyer. While there is a risk that China could slow its gold purchases due to reduced surplus reserves, the evidence suggests the opposite. In Figure 2, the left chart shows China’s gold ETF holdings, which have just spiked into the gold price downturn (we use China’s gold ETF holdings as a proxy for the broader China gold trend). The right chart plots the Shanghai gold premium, which is +4.4% above the London spot quote. The 4.4% premium is about 3 standard deviations above the 10-year average, indicating an aggressive bid for gold.
Figure 2. China Has Been Buying into the Gold Sell-Off
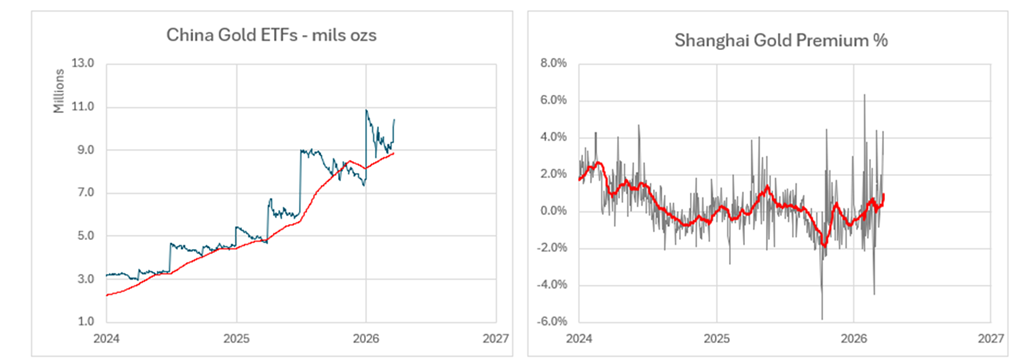
Source: Bloomberg. Data as of March 20, 2026.
Gold’s Move Amplified by Investment Side Selling
While reserve flows explain the macro backdrop, they do not fully account for the speed and magnitude of the decline. That acceleration came from the investment side.
Gold wasn’t sold on conviction; it became a source of cash.
The dominant driver here has been degrossing and deleveraging. Rising volatility across rates, foreign exchanges (FX), equities, and commodities triggered mechanical risk reduction across hedge funds, systematic strategies, commodity trading advisors (CTAs), and leveraged portfolios. In these environments, selling is rarely gradual. Positions are cut quickly, correlations rise and liquidity is raised as the primary objective.
Gold was a very popular holding and was widely held by funds. As portfolios were forced to shrink gross and net exposure, gold was sold alongside equities, credit, and other non-energy assets, not because investors suddenly became bearish on gold, but because it was a source of liquidity.
Additional factors reinforced the move:
- The rapid unwind of short USD and de-dollarization trades also contributed to selling across precious metals.
- Some systematic strategies responded to rising rates and a stronger dollar by mechanically reducing gold exposure.
- Capital rotated aggressively into the energy complex, drawing flows away from metals.
- Options-related positioning and volatility dynamics exacerbated short-term price moves.
Taken together, these forces created a classic liquidity-driven deleveraging, the same dynamic observed in prior stress episodes.
We’ve Been Here Before
History offers clear parallels. In both 2008 and 2020, gold initially sold off sharply during periods of acute financial stress. In each case, gold was sold not because it failed as a hedge but because it was one of the last remaining sources of liquidity. Once forced selling ran its course and policy responses followed, gold rallied strongly to all-time highs within months of market lows.
Today’s environment shares key features with those episodes: rising cross-asset volatility, tightening financial conditions and growing pressure on the global monetary system. The current drawdown fits that historical pattern.
Gold’s Longer-Term Setup Is Strengthening
Paradoxically, the same forces pressuring gold in the short term are improving its long-term outlook.
The global system is moving deeper into a regime defined by energy scarcity, fiscal strain and elevated inflation risk. Debt levels are high, deficits are widening and central banks face increasingly constrained policy choices. If the energy shock persists and growth deteriorates, the probability of renewed large-scale liquidity support (QE or quantitative easing) rises materially.
At that point, the debate shifts from theoretical to actual debasement. Historically, that transition has been powerful for gold.
The forces weighing on gold today are likely to drive its next bull run.
Moreover, the structural trends that underpin gold’s secular bull market remain intact: the erosion of the dollar-centric reserve system, the fragility of the petrodollar framework, and the remonetization of gold as a neutral reserve asset. None of these dynamics has reversed; if anything, they have accelerated.
Silver’s Volatility Is Being Driven by Derivatives
Silver, meanwhile, has behaved differently, with greater volatility. The price of silver set a record high above $121 per ounce in February 2026, and now sits at ~$65 as of this writing. While macro flows largely drove gold’s moves, silver’s price action has been heavily influenced by options positioning and market structure. In simple terms, derivatives activity, not underlying fundamentals, has been the dominant driver of short-term price movements. This has led to wider trading ranges and reduced visibility for directional investors.
Figure 3. Silver’s Volatile Trading (2025-2026)
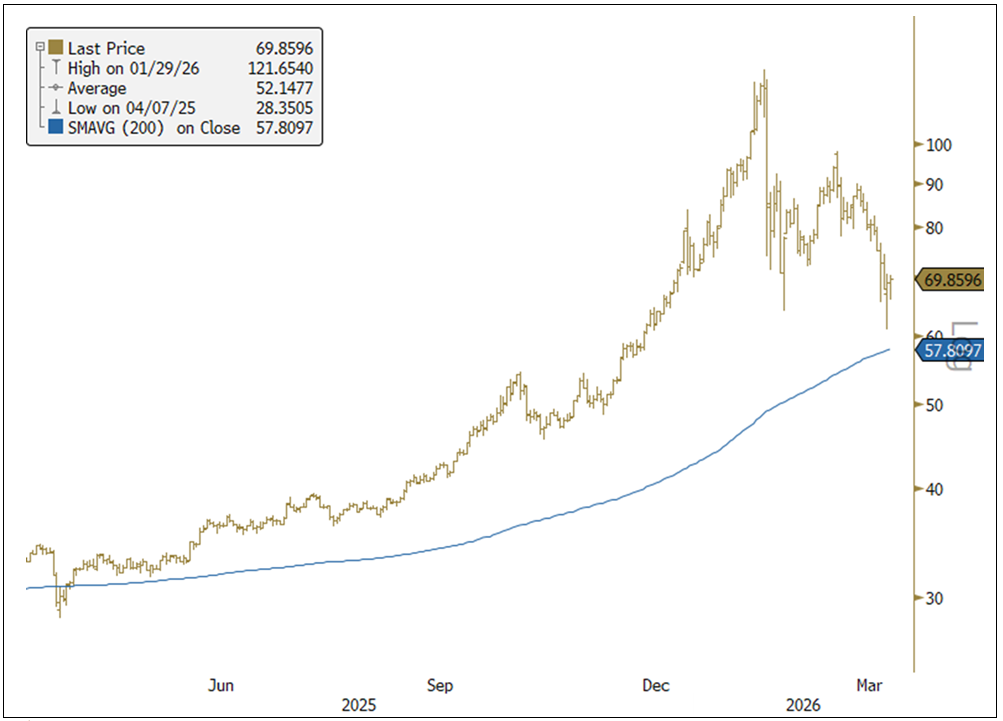
Source: Bloomberg. Data as of 3/24/2026. The spot silver price is measured by XAU Curncy.
The Bottom Line?
Gold’s decline was triggered by liquidity-driven deleveraging, not by a change in fundamentals.
Rising cross-asset volatility forced investors to raise cash and reduce exposure, prompting the sale of gold as a liquid source of capital.
A sudden halt in reserve flow demand removed a critical price-support mechanism.
Central banks, sovereigns, and sovereign wealth funds, particularly in the Gulf Cooperation Council (GCC), shifted from aggressive accumulation to zero incremental buying as energy revenues stalled, mechanically pressuring prices at the margin.
The sell-off is setting up, not negating, the next bull phase.
Energy scarcity, fiscal strain, and constrained central banks increase the likelihood of future liquidity support and monetary debasement, conditions that have historically preceded major gold up moves.
Investment Risks and Important Disclosure
Relative to other sectors, precious metals and natural resources investments have higher headline risk and are more sensitive to changes in economic data, political or regulatory events, and underlying commodity price fluctuations. Risks related to extraction, storage and liquidity should also be considered.
Gold and precious metals are referred to with terms of art like “store of value,” “safe haven” and “safe asset.” These terms should not be construed to guarantee any form of investment safety. While “safe” assets like gold, Treasuries, money market funds and cash generally do not carry a high risk of loss relative to other asset classes, any asset may lose value, which may involve the complete loss of invested principal.
Past performance is no guarantee of future results. You cannot invest directly in an index. Investments, commentary and opinions are unique and may not be reflective of any other Sprott entity or affiliate. Forward-looking language should not be construed as predictive. While third-party sources are believed to be reliable, Sprott makes no guarantee as to their accuracy or timeliness. This information does not constitute an offer or solicitation and may not be relied upon or considered to be the rendering of tax, legal, accounting or professional advice.