Vancouver, British Columbia–(Newsfile Corp. – February 29, 2024) – EMX Royalty Corporation (NYSE American: EMX) (TSXV: EMX) (FSE: 6E9) (the “Company” or “EMX”) is pleased to announce preliminary, unaudited, fourth quarter and annual revenue for the year ended December 31, 2023 (all figures in U.S. dollars).
Annual Results
The Company earned preliminary revenue and other income and adjusted revenue and other income1 of $26,621,000 and $37,028,000, respectively, for the year ended December 31, 2023 (2022 – $18,277,000 and $25,397,000, respectively), which represented a 46% and 46% increase, respectively, in comparison to the prior year. The significant increase is due to the commencement of royalty payments from the Timok Royalty Property, which resulted in $8,632,000 in royalty revenue in 2023, as well as an 80% increase in royalty revenue from Gediktepe and 46% increase in attributed royalty revenue from Caserones. In 2023, the Company recognized revenue from the Timok Royalty Property that was partially related to 2021 and 2022 sales. The portion attributed to Timok production in 2021 and 2022 amounted to $4,790,000.
Fourth Quarter Results
The Company earned preliminary revenue and other income and adjusted revenue and other income1 of $7,546,000 and $10,921,000, respectively, for the three months ended December 31, 2023 (2022 – $2,288,000 and $3,535,000, respectively), which represented a 230% and 209% increase, respectively, in comparison to Q4 2022.
“2023 was an unprecedented year for EMX. We achieved record revenues with the commencement of royalty payments from our flagship Timok Royalty Property combined with solid growth from our stable of quality cash flowing royalties,” commented Dave Cole, CEO. “We expect to continue to grow the Company in 2024 and continue to deliver shareholder value through our royalty generation business model.”
2024 Guidance
The Company is expected to file financial statements for the year ended December 31, 2023 before the end of Q1 2024. As part of this filing the Company anticipates providing revenue guidance for 2024.
Caserones Update
In January 2024, EMX acquired an additional 2.737% ownership in the underlying Caserones royalty holder, Sociedad Legal Minera California Una de la Sierra Peña Negra (“SLM California”), for cash consideration of $4,742,000 pursuant to an agreement with Franco Nevada Corporation. The acquisition provides EMX with a further 0.0531% (effective) net smelter royalty (“NSR”) interest in the Caserones property, increasing the Company’s NSR royalty interest to 0.8306%.
About EMX – EMX is a precious, and base metals royalty company. EMX’s investors are provided with discovery, development, and commodity price optionality, while limiting exposure to risks inherent to operating companies. The Company’s common shares are listed on the NYSE American Exchange and TSX Venture Exchange under the symbol “EMX”. Please see www.EMXroyalty.com for more information.
Neither the TSX Venture Exchange nor its Regulation Services Provider (as that term is defined in policies of the TSX Venture Exchange) accepts responsibility for the adequacy or accuracy of this release.
Note 1
Reconciliation of Non-IFRS Measures
This news release contains certain financial performance measures that are not recognized or defined under IFRS (termed “non-IFRS measures”). As a result, this data may not be comparable to data presented by other issuers. For an explanation of these measures to related comparable financial information presented in the Financial Statements of the Company prepared in accordance with IFRS, refer to the discussion below. The Company believes that these non-IFRS measures are useful indicators of operating performance and are specifically used by management to assess the financial and operational performance of the Company. Accordingly, these non-IFRS measures are intended to provide additional information and should not be considered in isolation or as a substitute for measures of performance prepared in accordance with IFRS.
Adjusted Revenue and Other Income
“Adjusted revenue and other income” is a non-IFRS financial measure, which is defined by EMX by taking total revenue and adding the Company’s share of royalty revenue related to the Company’s interest in SLM California. SLM California is the royalty holder of Caserones. The Company presents this non-IFRS measure as it believes that certain investors use this information to evaluate the Company’s performance and ability to generate cash flow in comparison to other royalty companies in the precious metals mining industry.
The following table reconciles “adjusted revenue and other income” to revenue and other income, the most directly comparable IFRS measure:
For the three months ended December 31,
For the year ended December 31,
(In thousands of US dollars)
2023
2022
2023
2022
Total revenue and other income
$
7,546
$
2,288
$
26,621
$
18,277
SLM California royalty revenue
8,438
3,308
26,024
18,887
The Company’s ownership %
40.0
37.7
40.0
37.7
The Company’s share of royalty revenue in Caserones
$
3,375
$
1,247
$
10,407
$
7,120
Adjusted revenue and other income
$
10,921
$
3,535
$
37,028
$
25,397
Forward-Looking Statements
This news release may contain “forward looking statements” that reflect the Company’s current expectations and projections about its future results. These forward-looking statements may include statements regarding the future price of copper, gold and other metals, the estimation of mineral reserves and resources, realization of mineral reserve estimates, the timing and amount of estimated future production, the Company’s growth strategy and expectations regarding the inclusion of revenue guidance for 2024 as part of the Company’s filing of its financial statements for the year ended December 31, 2023, or other statements that are not statements of fact. Any statements that express or involve discussions with respect to predictions, expectations, beliefs, plans, projections, objectives, assumptions or future events or performance (often, but not always, identified by words or phrases such as “expects,” “anticipates,” “believes,” “plans,” “projects,” “estimates,” “assumes,” “intends,” “strategy,” “goals,” “objectives,” “potential,” “possible” or variations thereof or stating that certain actions, events, conditions or results “may”, “could”, “would”, “should”, “might” or “will” be taken, occur or be achieved, or the negative of any of these terms and similar expressions) are not statements of historical fact and may be forward-looking statements.
Forward-looking statements are based on a number of material assumptions, including those listed below, which could prove to be significantly incorrect, including disruption to production at any of the mineral properties in which the Company has a royalty, or other interest; estimated capital costs, operating costs, production and economic returns; estimated metal pricing, metallurgy, mineability, marketability and operating and capital costs, together with other assumptions underlying the Company’s resource and reserve estimates; the expected ability of any of the properties in which the Company holds a royalty, or other interest to develop adequate infrastructure at a reasonable cost; assumptions that all necessary permits and governmental approvals will be obtained; and the activities on any on the properties in which the Company holds a royalty, or other interest will not be adversely disrupted or impeded by development, operating or regulatory risks or any other government actions.
Certain important factors that could cause actual results, performances or achievements to differ materially from those in the forward-looking statements include, amongst others, failure to receive necessary approvals, changes in business plans and strategies, market conditions, share price, best use of available cash, copper, gold and other commodity price volatility, discrepancies between actual and estimated production, mineral reserves and resources and metallurgical recoveries, mining operational and development risks relating to the parties which produce the gold or other commodity the Company will purchase, regulatory restrictions, activities by governmental authorities (including changes in taxation), currency fluctuations, the global economic climate, dilution, share price volatility and competition. Readers are cautioned that the figures presented herein have not been audited and are subject to change. As the Company has not yet finished its quarter-end close procedures, the anticipated financial information presented in this press release is preliminary, subject to final quarter and year-end closing adjustments, and may change materially.
Forward-looking statements are subject to known and unknown risks, uncertainties and other important factors that may cause the actual results, level of activity, performance or achievements of the Company to be materially different from those expressed or implied by such forward-looking statements, including but not limited to: the impact of general business and economic conditions, the absence of control over mining operations from which the Company will purchase gold, other commodities or receive royalties from, and risks related to those mining operations, including risks related to international operations, government and environmental regulation, actual results of current exploration activities, conclusions of economic evaluations and changes in project parameters as plans continue to be refined, risks in the marketability of minerals, fluctuations in the price of gold and other commodities, fluctuation in foreign exchange rates and interest rates, stock market volatility, as well as those factors discussed in the Company’s MD&A for the quarter ended September 30, 2023, and the most recently filed Annual Information Form (“AIF”) for the year ended December 31, 2022, actual events may differ materially from current expectations. More information about the Company, including the MD&A, the AIF and financial statements of the Company, is available on SEDAR at www.sedarplus.ca and on the SEC’s EDGAR website at www.sec.gov. Although the Company has attempted to identify important factors that could cause actual results to differ materially from those contained in forward-looking statements, there may be other factors that cause results not to be as anticipated, estimated or intended. There can be no assurance that such statements will prove to be accurate, as actual results and future events could differ materially from those anticipated in such statements. Accordingly, readers should not place undue reliance on forward-looking statements. The Company does not undertake to update any forward-looking statements that are contained or incorporated by reference, except in accordance with applicable securities laws.
Vancouver, British Columbia–(Newsfile Corp. – February 29, 2024) – Riverside Resources Inc.(TSXV: RRI) (OTCQB: RVSDF) (FSE: 5YY) (“Riverside” or the “Company”), is pleased to announce it has located and sampled the PAT Vein showings inside its Pichette Project west of Geraldton, Ontario. As previously reported, P.A.T Mines drilled extensively a series of veins near the southern boundary in the 1950s. The company was also able to locate what it believes to be the PAT Veins where they outcrop on surface. Several samples were taken from the vein along a 50m exposed section that returned 1m chip samples of 13g/t and 21 g/t gold within banded iron formation units. These high-grade veins are similar to those mined at the Leitch and Sand River mines where the average grade was around 1 ounce/ton gold with silver.
The Pichette Project has excellent road access and infrastructure being located immediately south of the Trans-Canada Highway. The project is underlain by an east-west trending panel of Archean-aged metavolcanic and metasedimentary rocks intruded by gabbros and latter porphyries. Metamorphism and tectonics have in most cases upgraded the tenor of gold mineralization in the belt between Beardmore and Geraldton.
In addition to the surface sampling Riverside completed a geological interpretation of the project to evaluate the timing and relationships of structural events and gold mineralization. As at the Greenstone Mine gold mineralization largely occurred in the first deformational events and was later remobilized or deformed by subsequent deformational events. The Greenstone Gold Mine has been studied by many experts and a complicated evolution of events has been documented as is common in Archean gold belts. The Greenstone Gold Mine will produce over 200,000 ounces of gold per year beginning this year.
“Riverside is very excited to have found high grade gold on surface at the PAT Veins. While the veins are mostly covered by the forest organics, the banded iron formations associated with the veins and mineralized shears are easy to locate using the magnetic survey completed in 2022. The BIF unit extends across the project outlining a multi-kilometer” states Riverside’s President and CEO, John-Mark Staude.
Figure 1: Location of the Pichette Project within the Beardmore-Geraldton Greenstone Belt.
This fall the Company completed a structural analysis of the geology and timing of mineralization at Pichette in order provide some context of the structures within the property and how they relate to the evolution of larger greenstone belt and nearby past producers and known gold occurrences. This analysis interprets the first phase of deformation resulted in folding of the Banded Iron Formations and north-south shortening of intrusions with most of the vein mineralization occurring during a second sinistral shearing event. These rocks were again subjected to a third dextral shearing event which resulted in some remobilization in metals.
Table 1: Selected prospecting samples from Riverside most recent field programs.
Sample #
Au ppb
Sample type
Comments
1192286
1,500
grab
Cherty, Banded Iron Formation, weakly magnetic
1192287
200
grab
Rusty orange, quartz vein, with <1% pyrite in fractures
P2023-1
13,400
chip
Rusty, quartz carbonate vein striking east-west, 1m continuous sampling across
P2023-2
13
chip
Iron oxide-stained quartz vein material in road cut
472703
21,900
chip
1.75m shear zone with rusty quartz-carbonate veins striking at 070, dipping at 80 N
On surface the mineralized zone consists of sugary and banded quartz with massive pyrrhotite and lesser arsenopyrite and pyrite with chlorite The average width of the altered and mineralized zone is 30m consisting primarily of pyritized and silicified mafic metavolcanics and BIF. Historical drill logs suggest a sharp contact between geological units that include mafic metavolcanics, metasediments, gabbros and quartz porphyries.
Gold is commonly enriched in intensely altered rocks adjacent to or within quartz-carbonate veins and veinlets as is found in orogenic deposits. Several of the historical drill logs document high grade intercepts similar to those documented at the Leitch Gold Mine to the west at Beardmore.
The alteration comprises a sequence of well fractured greenstone containing occasional small stringers of hard, reddish, siliceous material, with slight pyritization. The rock changes northward into a light green or tanned rock described in logs as “carbonate”. On surface more siliceous phases are noted with hard, black cherty material often found with the quartz veins. Moving further away from the zone a sericitic phase dominates.
Figure 3: Riverside Surface samples in relation to mineralized zones as defined by historical drilling.
Rock samples from the exploration program discussed above at Pichette were driven from site to Activation Laboratories in Thunder Bay for analysis. Analysis was completed using total digestion and Multi-Element Analysis (40 element) via Inductively Coupled Plasma Atomic Emission Spectrometry and fire assay for gold. The QA/QC program implemented as part of the sampling procedures included inserting one standard and one blank inserted by Riverside every 20 batch of samples. Activation Laboratories is an ISO/IEC accredited laboratory.
Bonus Share Issuance:
On January 17, 2024, the Company issued 335,000 common shares to certain individuals in recognition of their contribution to the Company over the past year. The shares were issued pursuant to the Company’s shareholder-approved bonus share plan and are subject to the policies of the TSX Venture Exchange and will include a hold period expiring May 18th 2024.
Qualified Person:
This news release was reviewed and approved by Freeman Smith, P.Geo., a non-independent qualified person to Riverside Resources, who is responsible for ensuring that the geologic information provided within this news release is accurate and who acts as a “qualified person” under National Instrument 43-101 Standards of Disclosure for Mineral Projects.
About Riverside Resources Inc.:
Riverside is a well-funded exploration company driven by value generation and discovery. The Company has over $6M in cash, no debt and less than 75M shares outstanding with a strong portfolio of gold-silver and copper assets and royalties in North America. Riverside has extensive experience and knowledge operating in Mexico and Canada and leverages its large database to generate a portfolio of prospective mineral properties. In addition to Riverside’s own exploration spending, the Company also strives to diversify risk by securing joint-venture and spin-out partnerships to advance multiple assets simultaneously and create more chances for discovery. Riverside has properties available for option, with information available on the Company’s website at www.rivres.com.
ON BEHALF OF RIVERSIDE RESOURCES INC.
“John-Mark Staude”
Dr. John-Mark Staude, President & CEO
For additional information contact:
John-Mark Staude President, CEO Riverside Resources Inc. info@rivres.com Phone: (778) 327-6671 Fax: (778) 327-6675 Web: www.rivres.com
Certain statements in this press release may be considered forward-looking information. These statements can be identified by the use of forward-looking terminology (e.g., “expect”,” estimates”, “intends”, “anticipates”, “believes”, “plans”). Such information involves known and unknown risks — including the availability of funds, the results of financing and exploration activities, the interpretation of exploration results and other geological data, or unanticipated costs and expenses and other risks identified by Riverside in its public securities filings that may cause actual events to differ materially from current expectations. Readers are cautioned not to place undue reliance on these forward-looking statements, which speak only as of the date of this press release.
Neither the TSX Venture Exchange nor its Regulation Services Provider (as that term is defined in the policies of the TSX Venture Exchange) accepts responsibility for the adequacy or accuracy of this release.
Coeur d’Alene, Idaho – February 28, 2024 –Scout Discoveries Corp. (“Scout” or “the Company”) is pleased to announce a strategic partnership (the “Partnership”) with The Electrum Group (“Electrum”) and closing of a concurrent non-brokered private placement (the “Placement”) of US $4,000,000 for 8,000,000 common shares at US $0.50 per share (the “Subscription Price”). In addition, Electrum shall have the option (the “Option”) to invest an additional US $4,000,000 for 4,000,000 common shares at US $1.00 per share prior to December 29, 2024, or a public listing, whichever occurs first.
Following closing of the Placement, Electrum owns 28.4% of the issued and outstanding shares of Scout (or 37.3% assuming exercise of the Option) and retains the right to designate up to two individuals as nominees to the Company’s board of directors (the “Board”). Electrum has agreed to vote its shares with the recommendations of Scout for a period of three years and holds a right to participate (the “Pro Rata Right”) in any future financing of the Company to maintain its pro rata shareholding until the Company achieves a public listing.
The Partnership announced herein between Scout and Electrum will consist of technical support with project review and advancement, corporate and transactional support, and the broadening of relationships within global capital markets. Electrum has specific expertise in U.S. capital markets, and in Scout’s focus jurisdiction of Idaho as the majority owner of Sunshine Silver Mining & Refining Company, the largest mineral rights holder in the Silver Valley of northern Idaho.
Dr. Curtis Johnson, Scout Discoveries’ President and CEO commented: “Electrum is the ideal long-term partner for Scout to achieve our primary objective of making a Tier One discovery in Idaho. With the support of Electrum’s technical expertise, their proven financial backing and long-term focus, we can follow a systematic, disciplined approach to discovery, giving Scout the best opportunity to create strong and sustained growth in value-per-share.”
The Placement was completed under Rule 506(b) of Regulation D promulgated by the SEC under the Securities Act of 1933, as amended (the “Securities Act”), solely to persons who qualify as accredited investors and in accordance with applicable securities laws.
The securities offered in the Placement have not been and will not be registered under the Securities Act or the securities laws of any state of the United States and may not be offered or sold absent such registration or an applicable exemption from such registration requirements. This news release does not constitute an offer to sell or a solicitation of an offer to buy securities nor shall there be any sale of the securities referenced herein in any state or other jurisdiction in which such offer, solicitation or sale is not permitted. The securities referenced herein have not been approved or disapproved by any regulatory authority.
This release is issued for informational purposes pursuant to Rule 135c of the Securities Act and shall not constitute an offer to sell or a solicitation of an offer to buy any securities, nor shall there be any sale of securities in any state or jurisdiction in which such offer, solicitation or sale would be unlawful prior to registration or qualification under the securities laws of any such state or jurisdiction.
The shares issued pursuant to the Offering will be subject to a statutory hold period in accordance with applicable United States securities legislation.
About Scout
Scout Discoveries Corp. is a U.S. mineral exploration company headquartered in Coeur d’Alene, Idaho with 100% ownership of five precious and base metals projects in Idaho, and an option to acquire 100% of ten additional projects, comprising the largest unpatented claim holdings in the state. Scout is focused on the goal of rapidly advancing its large portfolio of projects through discovery with its internal core drill rig and team.
Certain statements in this news release are forward-looking and involve a number of risks and uncertainties. Such forward-looking statements are within the meaning of that term in Section 27A of the Securities Act of 1933, as amended, and Section 21E of the Securities Exchange Act of 1934, as amended. Forward-looking statements are not comprised of historical facts. Forward-looking statements include estimates and statements that describe the Company’s future plans, objectives or goals, including words to the effect that the Company or management expects a stated condition or result to occur. Forward-looking statements may be identified by such terms as “believes”, “anticipates”, “expects”, “estimates”, “may”, “could”, “would”, “will”, or “plan”. Since forward-looking statements are based on assumptions and address future events and conditions, by their very nature they involve inherent risks and uncertainties. Although these statements are based on information currently available to the Company, the Company provides no assurance that actual results will meet management’s expectations. Risks, uncertainties and other factors involved with forward-looking information could cause actual events, results, performance, prospects and opportunities to differ materially from those expressed or implied by such forward-looking information. Factors that could cause actual results to differ materially from such forward-looking information include, but are not limited to those risks set out in the Company’s public documents filed on EDGAR. Although the Company believes that the assumptions and factors used in preparing the forward-looking information in this news release are reasonable, undue reliance should not be placed on such information, which only applies as of the date of this news release, and no assurance can be given that such events will occur in the disclosed time frames or at all. The Company disclaims any intention or obligation to update or revise any forward-looking information, whether as a result of new information, future events or otherwise, other than as required by law. No stock exchange, securities commission or other regulatory authority has approved or disapproved the information contained herein.
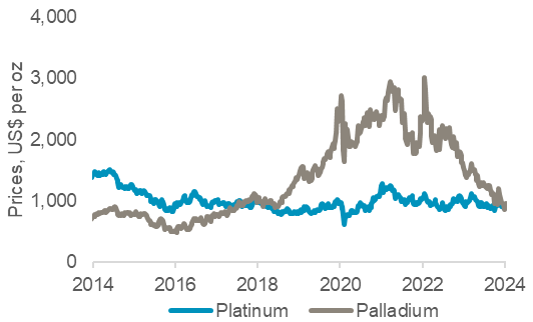
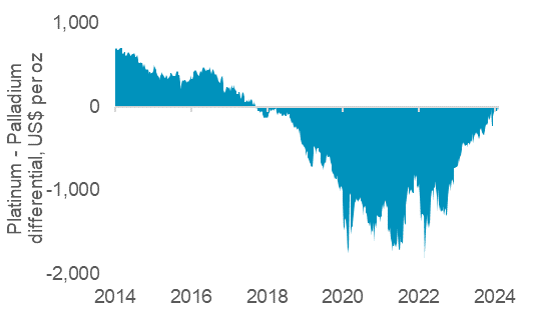
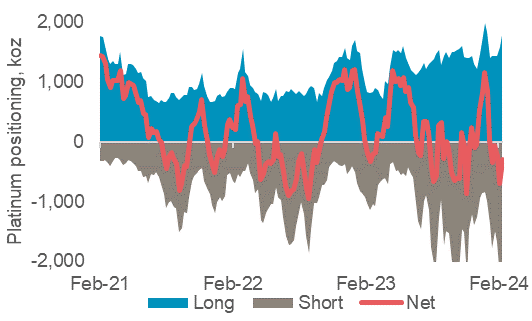
The fall in the palladium price has closed the differential with platinum, with the sister metals now priced near parity for the first time since 2018. As this fall has been long-expected, due to forecasts of palladium moving into surplus from 2025, investors are net short palladium, leaving it vulnerable to short covering rallies. In contrast, platinum’s fundamentals are much more attractive, with the current market deficit expected to continue until at least 2028, which should be reflected in the price after automaker inventory management has run its course.
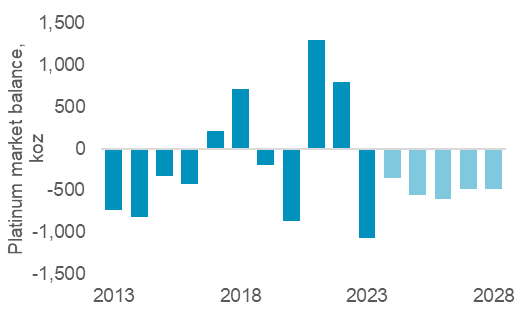
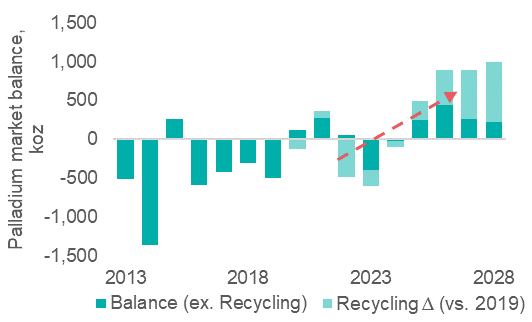
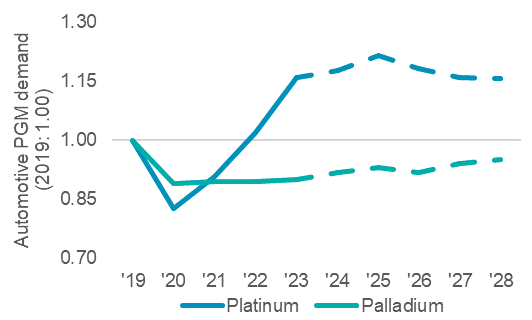
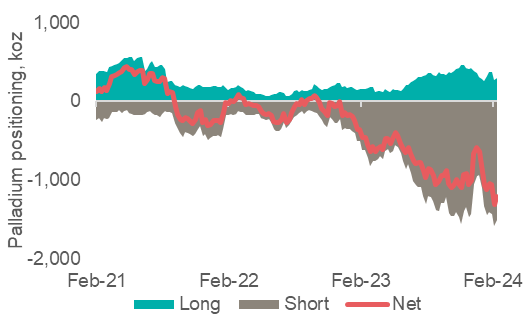
Palladium’s price rose above platinum’s in 2018, after multi-year palladium market deficits, and remained at a premium to platinum of over $1,000/oz for nearly three years. This incentivised significant automotive 1:1 substitution of platinum for palladium (2023, >600 koz). Palladium prices peaked in March 2022 at US$3,012/oz (Fig. 1), a record US$1,883/oz premium to platinum (Fig. 3), following Russia’s invasion of Ukraine, providing a further boost to substitution. Since then, the outlook for platinum and palladium have diverged. Palladium is weighed upon by automotive substitution (Fig. 5), overreliance on ICE autocatalyst demand, and expected growth in recycling supply. Conversely, substitution benefits platinum as do more diverse end-markets (Pt auto demand ~40%, vs. ~80% for Pd). WPIC expects platinum deficits from 2023 to at least 2028 (Fig. 2), but palladium is forecast to transition to a surplus from 2025 (Fig. 4). Net managed money positions highlight a build of investor short positions on palladium (Fig 6) while platinum’s average positioning has been less consistently directional (Fig. 7).
Source: Bloomberg, WPIC Research, N.B. London trading hours
Source: SFA (Oxford) 2013-2018, Metals Focus 2019-2024f, WPIC Research thereafter
In the near-term palladium prices are likely to be volatile as investors continue to cover short positions, with two short squeezes since December 2023 alone. In addition, there are some supply risks to palladium’s move into surplus; palladium recycling supply is expected to grow by ~1 Moz p.a., but with the recycling industry facing a number of challenges, should this supply not materialise in full it could make palladium markets much more balanced or even keep them in deficit. However, it is more pertinent to understand why platinum, with its better outlook, did not see prices converge upwards towards palladium. From a sentiment perspective, platinum, as a non-yielding asset, was hampered by tightening monetary policy undertaken by central banks to contain inflation through 2022 and 2023. While physical platinum purchases were impacted by reduced automaker purchases after a period of large inventory accumulation as a result of under-producing vehicles during COVID and the semiconductor shortage. There are early signs that automakers are returning to normalised purchasing patterns. This comes as platinum is forecast to enter the second year of a protracted period of market deficits, arguably boding well for upward pressure on prices and investor returns.
Platinum’s attraction as an investment asset arises from:
WPIC research indicates the platinum market entering a period of consecutive deficits from 2023
Platinum supply remains challenged, both from primary mining and secondary recycling
Automotive platinum demand growth should continue into 2024f due principally to substitution of platinum for palladium in gasoline vehicles
Platinum is a critical mineral in the global energy transition underpinning a key role in the hydrogen economy
The platinum price remains historically undervalued and significantly below both gold and palladium
Source: Bloomberg, WPIC Research
Source: Metals Focus to 2022, WPIC Research thereafter
Source: Metals Focus (Pt to 2024) (Pd to 2022), WPIC research thereafter
Source: Bloomberg, WPIC Research
Source: Bloomberg, WPIC research
Source: SFA (Oxford) 2013-2018, Metals Focus 2019-2024f, WPIC Research thereafter
IMPORTANT NOTICE AND DISCLAIMER: This publication is general and solely for educational purposes. The publisher, The World Platinum Investment Council, has been formed by the world’s leading platinum producers to develop the market for platinum investment demand. Its mission is to stimulate investor demand for physical platinum through both actionable insights and targeted development: providing investors with the information to support informed decisions regarding platinum; working with financial institutions and market participants to develop products and channels that investors need.
This publication is not, and should not be construed to be, an offer to sell or a solicitation of an offer to buy any security. With this publication, the publisher does not intend to transmit any order for, arrange for, advise on, act as agent in relation to, or otherwise facilitate any transaction involving securities or commodities regardless of whether such are otherwise referenced in it. This publication is not intended to provide tax, legal, or investment advice and nothing in it should be construed as a recommendation to buy, sell, or hold any investment or security or to engage in any investment strategy or transaction. The publisher is not, and does not purport to be, a broker-dealer, a registered investment advisor, or otherwise registered under the laws of the United States or the United Kingdom, including under the Financial Services and Markets Act 2000 or Senior Managers and Certifications Regime or by the Financial Conduct Authority.
This publication is not, and should not be construed to be, personalized investment advice directed to or appropriate for any particular investor. Any investment should be made only after consulting a professional investment advisor. You are solely responsible for determining whether any investment, investment strategy, security or related transaction is appropriate for you based on your investment objectives, financial circumstances and risk tolerance. You should consult your business, legal, tax or accounting advisors regarding your specific business, legal or tax situation or circumstances.
The information on which this publication is based is believed to be reliable. Nevertheless, the publisher cannot guarantee the accuracy or completeness of the information. This publication contains forward-looking statements, including statements regarding expected continual growth of the industry. The publisher notes that statements contained in the publication that look forward in time, which include everything other than historical information, involve risks and uncertainties that may affect actual results. The logos, services marks and trademarks of the World Platinum Investment Council are owned exclusively by it. All other trademarks used in this publication are the property of their respective trademark holders. The publisher is not affiliated, connected, or associated with, and is not sponsored, approved, or originated by, the trademark holders unless otherwise stated. No claim is made by the publisher to any rights in any third-party trademarks
WPIC Research MiFID II Status
The World Platinum Investment Council -WPIC- has undertaken an internal and external review of its content and services for MiFID II. As a result, WPIC highlights the following to the recipients of its research services, and their Compliance/Legal departments:
WPIC research content falls clearly within the Minor Non-Monetary Benefit Category and can continue to be consumed by all asset managers free of charge. WPIC research can be freely shared across investment organisations.
WPIC does not conduct any financial instrument execution business. WPIC does not have any market making, sales trading, trading or share dealing activity. (No possible inducement).
WPIC content is disseminated widely and made available to all interested parties through a range of different channels, therefore qualifying as a “Minor Non-Monetary Benefit” under MiFID II (ESMA/FCA/AMF). WPIC research is made freely available through the WPIC website. WPIC does not have any permissioning requirements on research aggregation platforms.
WPIC does not, and will not seek, any payment from consumers of our research services. WPIC makes it clear to institutional investors that it does not seek payment from them for our freely available content.
Newmont went down 7% for the same reason a dog walks into the middle of the road to lick its dick.
Because it can.
A number of other writers including John Hathaway are commenting on the disconnect between the cost of gold and silver compared to the price of resource stocks. While gold has pretty much held its own and silver is down but a tiny bit lately, the resource stocks have been hammered to all time lows lately seemingly without reason.
There is a reason.
Actually, there are two reasons.
It’s common for investors to focus on the price and action of the shares they own and what they might be interested in buying. But right now, those numbers are meaningless. Newmont didn’t have a pit collapse in Turkey. They didn’t have a copper mine seized in Panama or any abysmal drill results from an important project.
Newmont shares got sold because they could.
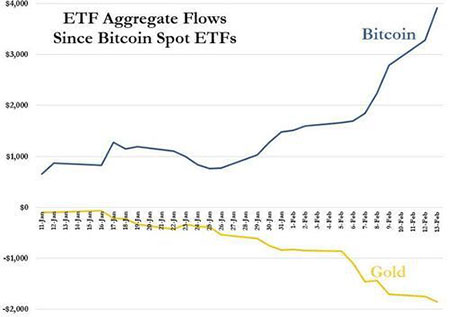
In the past six weeks as Bitcon soared higher, over four billion dollars of new money flowed into the speculation. The money had to come from somewhere. It came from gold and silver ETFs and it plunged out of resource funds at a historic rate. While four billion shot into Bitcon, two billion came out of gold and silver ETFs.
The money didn’t come out of the cheapest and worst resource stocks. They are the least liquid. It came out of the biggest and the best, the most liquid.
Because it could.
So, a lot of money left the tiny world of gold and silver stocks to enter the far bigger speculation we call Bitcon. But there was another giant factor pretty much ignored by everyone.
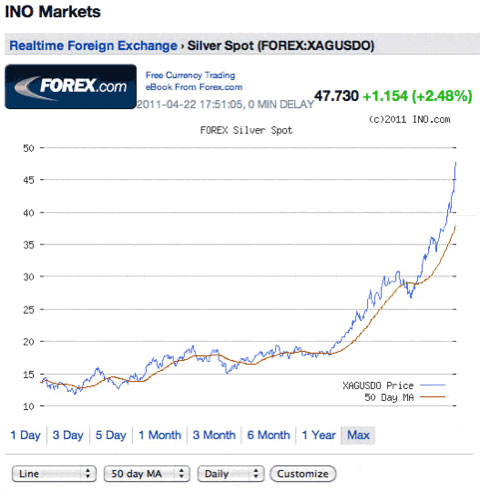
According to Jim Rogers all parabolic moves end badly. I have seen similar charts in all kinds of commodities and they always correct. Parabolic charts mark tops. So, when silver bugs start suggesting, “This time it’s different” I know better.
Study the chart below. Ignore the commodity. When charts go parabolic, it ends badly. I was an investor in the 1970s in both gold and silver. I started buying gold at $35 and silver around $5 an ounce. I sold out all my silver in January of 1980 a week too early at $35 as it rocketed to $50.25 an ounce at the open on January 21, 1980. It went parabolic and basically that’s all you need to know.
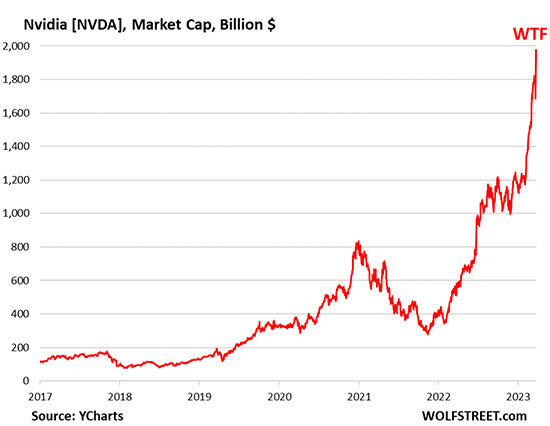
Nvidia reported earnings last week and the shares continued their rocket launch. Here is a chart of the stock.
Compare the two charts. What I said in my piece from April 25th of 2011 is just as true today. All parabolic moves end badly. Nvidia shares are about to crash.
All those weak hands who were eager to see if they could sell at the very bottom of the gold/silver resource cycle are going to regret being part of the thundering herd.
When Nvidia crashes and Bitcon returns to earth, the direction of money flow will reverse. Bitcon is up 30% in just six weeks. There is nothing in economics that justifies that any more than Newmont dropping 7% in a day.
Edmonton, Alberta–(Newsfile Corp. – February 27, 2024) – Visit Grizzly Discoveries Inc. (TSXV: GZD) (OTCQB: GZDIF) at Booth #3020 at the Prospectors & Developers Association of Canada’s (PDAC) Convention at the Metro Toronto Convention Centre (MTCC) from Sunday, March 3 to Wednesday, March 6, 2024.
About Grizzly Discoveries Inc.
Grizzly is a diversified Canadian mineral exploration company with its primary listing on the TSX Venture Exchange focused on developing its approximately 72,700 ha (approximately 180,000 acres) of precious and base metals properties in southeastern British Columbia. Grizzly is run by a highly experienced junior resource sector management team, who have a track record of advancing exploration projects from early exploration stage through to feasibility stage.
About PDAC
The World’s Premier Mineral Exploration & Mining Convention is the leading convention for people, governments, companies and organizations connected to mineral exploration. In addition to meeting more than 1,100 exhibitors, 2,500 investors and 24,000 attendees in person in 2023, participants could also attend programming, courses and networking events.
The annual convention is held in Toronto, Canada. It has grown in size, stature and influence since it began in 1932 and today is the event of choice for the world’s mineral industry.
Vancouver, British Columbia–(Newsfile Corp. – February 22, 2024) – Goldshore Resources Inc. (TSXV: GSHR) (OTCQB: GSHRF) (FSE: 8X00) (“Goldshore” or the “Company“) announces that Brett A. Richards, the Company’s President, Chief Executive Officer (“CEO“) and Director, is transitioning to Interim CEO and Director.
As part of an ongoing commitment to Goldshore, Mr. Richards has decided to transition to Interim CEO and maintain his board seat, ensuring the Company has adequate leadership and working capital for the next twenty-four (24) months.
Goldshore continues to be committed to managing the risk(s) of operating in the current capital market environment while demonstrating the resiliency of its board and management team to make difficult decisions to protect and manage the best interest of shareholders. The Goldshore board will regularly review its management structure and make adjustments as necessary in the future.
About Goldshore
Goldshore is an emerging junior gold development company, and owns the Moss Gold Project located in Ontario. The Company is led and supported by an industry-leading management group, board of directors and advisory personnel. Goldshore is well-positioned and well financed to advance the Moss Gold Project through the next stages of exploration and development.
Neither the TSXV nor its Regulation Services Provider (as that term is defined in the policies of the TSXV) accepts responsibility for the adequacy or accuracy of this release.
For More Information – Please Contact:
Brett A. Richards Interim Chief Executive Officer and Director Goldshore Resources Inc.
This news release contains statements that constitute “forward-looking statements.” Such forward looking statements involve known and unknown risks, uncertainties and other factors that may cause the Company’s actual results, performance or achievements, or developments to differ materially from the anticipated results, performance or achievements expressed or implied by such forward-looking statements. Forward looking statements are statements that are not historical facts and are generally, but not always, identified by the words “expects,” “plans,” “anticipates,” “believes,” “intends,” “estimates,” “projects,” “potential” and similar expressions, or that events or conditions “will,” “would,” “may,” “could” or “should” occur.
Forward-looking statements in this news release include, among others, statements relating to expectations regarding the exploration and development of the Moss Gold Project, future changes to the Company’s management structure, and other statements that are not historical facts. By their nature, forward-looking statements involve known and unknown risks, uncertainties and other factors which may cause our actual results, performance or achievements, or other future events, to be materially different from any future results, performance or achievements expressed or implied by such forward-looking statements. Such factors and risks include, among others: the Company may require additional financing from time to time in order to continue its operations which may not be available when needed or on acceptable terms and conditions acceptable; compliance with extensive government regulation; domestic and foreign laws and regulations could adversely affect the Company’s business and results of operations; the stock markets have experienced volatility that often has been unrelated to the performance of companies and these fluctuations may adversely affect the price of the Company’s securities, regardless of its operating performance; the impact of COVID-19; the ongoing military conflict in Ukraine; and other risk factors outlined in the Company’s public disclosure documents.
The forward-looking information contained in this news release represents the expectations of the Company as of the date of this news release and, accordingly, is subject to change after such date. Readers should not place undue importance on forward-looking information and should not rely upon this information as of any other date. The Company undertakes no obligation to update these forward-looking statements in the event that management’s beliefs, estimates or opinions, or other factors, should change.
In this interview we sit down with Shawn Khunkhun the CEO of Dolly Varden Silver, which just announced Step-Out Drilling at Homestake Ridge Discovers New, High-Grade Gold Zone: 79.49 g/t Au over 12.45m, including 1,335 g/t Au over 0.68m. Find out why Eric Sprott, Rick Rule, Fidelity, Fury Gold Mines, Hecla Mining, Sprott, Delbrook, U.S. Global Investors are significant shareholders in Dolly Varden Silver.
Dolly Varden Silver Corporation is a mineral exploration company focused on advancing its 100% held Kitsault Valley Project located in the Golden Triangle of British Columbia, Canada, 25kms by road to deep tide water.
The 163 sq. km. project hosts the high-grade silver and gold resources of Dolly Varden and Homestake Ridge along with the past producing Dolly Varden and Torbrit silver mines. It is considered to be prospective for hosting further precious metal deposits, being on the same structural and stratigraphic belts that host numerous other, on-trend, high-grade deposits, such as Eskay Creek and Brucejack. The project also contains the Big Bulk property which is prospective for porphyry and skarn style copper and gold mineralization, similar to other such deposits in the region (Red Mountain, KSM, Red Chris).
The Company’s common shares are listed and traded on the TSX.V under the symbol DV and on the OTCQX system under the symbol DOLLF.
Vancouver, British Columbia–(Newsfile Corp. – February 14, 2024) – Emperor Metals Inc. (CSE: AUOZ) (OTCQB: EMAUF) (FSE: 9NH) (“Emperor“, or the “Company“) is pleased to announce that the Company has completed a 424 line-km aeromagnetic geophysical survey comprising 14.5 km2 at the Duquesne West Gold project in Quebec. This high-resolution survey enhances Emperor’s exploration strategy by refining geological models and targeting capabilities for gold deposition.
Highlights
Enhanced Aeromagnetic Resolution: Achieved with 50 meter and 25 m line spacing providing new and improved detail.
Advanced Geological Understanding: Advances Emperor’s understanding of the structural framework and lithological controls crucial to mineralization.
Revealed Greenstone Belt Architecture: Illustrates the underlying architecture of the greenstone belt; pinpointing areas to favorable ore environments.
Discovery of Unknown Structural Features: Reveals unknown structural features not identified by past explorers, offering new exploration targets.
CEO John Florek commented:
“This dataset not only enhances our understanding of the complex geological environment at Duquesne West but also aligns perfectly with our strategic objectives. By identifying signatures indicative of both high-grade and bulk tonnage gold deposits, we’re now equipped to expand our exploration efforts across multiple fronts. This improved aeromagnetic detail is meaningful for our 2024 drilling program, setting the stage for a transformative year. With these insights, we’re more confident than ever in our ability to uncover new targets for expanding known mineralization and exploring new prospects. We anticipate a busy and productive summer ahead.”
Strategic Implications:
This dataset is instrumental in distinguishing the signatures related to favorable gold deposition, enabling the identification of previously overlooked targets. Specifically, it aids in exploration for:
Underground High-Grade Gold
Open Pit Bulk Tonnage Gold
Underground Bulk Tonnage Gold
These findings are aligned with Emperor Metals’ strategic vision to explore and develop diverse gold resources, leveraging advanced technologies to uncover the full potential of the Duquesne West Gold Project.
2024 Geophysical Survey
This survey marks the first set of detailed (<100m line spacing) aeromagnetics geophysical data on the Duquesne West project with substantially better resolution than historical government data which gives the company valuable insight into magnetic characteristics on its claims.
The survey is expected to enhance the understanding of structure, mineralogy, and spatial positioning of potential economic mineralization related to magnetic anomalies. This survey will assist the company in expanding the footprint of known mineralization and defining near surface targets ahead of the Company’s 2024 drill program.
About the Duquesne West Gold Project
The Duquesne West Gold Property is located 32 km northwest of the city of Rouyn-Noranda and 10 km east of the town of Duparquet. The property lies within the historic Duparquet gold mining camp in the southern portion of the Abitibi Greenstone Belt in the Superior Province.
Under an Option Agreement, Emperor agreed to acquire a one hundred percent (100%) interest in a mineral claim package comprising 38 claims covering approximately 1,389 ha, located in the Duparquet Township of Quebec (the “Duquesne West Property”) from Duparquet Assets Ltd., a 50% owned subsidiary of Globex Mining Enterprises Inc. For further information on the Duquesne West Property and Option Agreement, see Emperor’s press release dated October 12, 2022, available on SEDAR.
The Property hosts a historical inferred mineral resource estimate of 727,000 ounces of gold at a grade of 5.42 g/t Au.1,2 The mineral resource estimate predates modern CIM guidelines and a Qualified Person on behalf of Emperor has not reviewed or verified the mineral resource estimate, therefore it is considered historical in nature and is reported solely to provide an indication of the magnitude of mineralization that could be present on the property. The gold system remains open for resource identification and expansion.
Reinterpretation of the existing geological model was created using Artificial Intelligence (A.I) and Machine Learning. This model shows the opportunity for additional discovery of ounces by revealing gold trends unknown to previous workers and the potential to expand the resource along significant gold-endowed structural zones.
Multiple scenarios exist to expand additional resources which include:
Underground High-Grade Gold
Open Pit Bulk Tonnage Gold
Underground Bulk Tonnage Gold.
1 Watts, Griffis, and McOuat Consulting Geologists and Engineers, Oct 20, 2011, Technical Report and Mineral Resource Estimate Update for the Duquesne-Ottoman Property, Quebec, Canada for XMet Inc.
2 Power-Fardy and Breede, 2011. The Mineral Resource Estimate (MRE) constructed in 2011 is considered historical in nature as it was constructed prior to the most recent Canadian Institute of Mining and Metallurgy (CIM) standards (2014) and guidelines (2019) for mineral resources. In addition, the economic factors used to demonstrate reasonable prospects of eventual economic extraction for the MRE have changed since 2011. A qualified person has not done sufficient work to consider the MRE as a current MRE. Emperor is not treating the historical MRE as a current mineral resource. The reader is cautioned not to treat it, or any part of it, as a current mineral resource.
QP Disclosure
The technical content for the Duquesne West Project in this news release has been reviewed and approved by John Florek, M.Sc., P.Geol., a Qualified Person pursuant to CIM guidelines.
About Emperor Metals Inc.
Emperor Metals Inc. is an innovative Canadian mineral exploration company focused on developing high-quality gold properties situated in the Canadian Shield. For more information, please refer to SEDAR PLUS (www.sedarplus.com), under the Company’s profile.
ON BEHALF OF THE BOARD OF DIRECTORS
s/ “John Florek” John Florek, M.Sc., P.Geol President, CEO and Director Emperor Metals Inc.
CERTAIN STATEMENTS MADE AND INFORMATION CONTAINED HEREIN MAY CONSTITUTE “FORWARD-LOOKING INFORMATION” AND “FORWARD-LOOKING STATEMENTS” WITHIN THE MEANING OF APPLICABLE CANADIAN AND UNITED STATES SECURITIES LEGISLATION. THESE STATEMENTS AND INFORMATION ARE BASED ON FACTS CURRENTLY AVAILABLE TO THE COMPANY AND THERE IS NO ASSURANCE THAT ACTUAL RESULTS WILL MEET MANAGEMENT’S EXPECTATIONS. FORWARD-LOOKING STATEMENTS AND INFORMATION MAY BE IDENTIFIED BY SUCH TERMS AS “ANTICIPATES”, “BELIEVES”, “TARGETS”, “ESTIMATES”, “PLANS”, “EXPECTS”, “MAY”, “WILL”, “COULD” OR “WOULD”.
FORWARD-LOOKING STATEMENTS AND INFORMATION CONTAINED HEREIN ARE BASED ON CERTAIN FACTORS AND ASSUMPTIONS REGARDING, AMONG OTHER THINGS, THE ESTIMATION OF MINERAL RESOURCES AND RESERVES, THE REALIZATION OF RESOURCE AND RESERVE ESTIMATES, METAL PRICES, TAXATION, THE ESTIMATION, TIMING AND AMOUNT OF FUTURE EXPLORATION AND DEVELOPMENT, CAPITAL AND OPERATING COSTS, THE AVAILABILITY OF FINANCING, THE RECEIPT OF REGULATORY APPROVALS, ENVIRONMENTAL RISKS, TITLE DISPUTES AND OTHER MATTERS. WHILE THE COMPANY CONSIDERS ITS ASSUMPTIONS TO BE REASONABLE AS OF THE DATE HEREOF, FORWARD-LOOKING STATEMENTS AND INFORMATION ARE NOT GUARANTEES OF FUTURE PERFORMANCE AND READERS SHOULD NOT PLACE UNDUE IMPORTANCE ON SUCH STATEMENTS AS ACTUAL EVENTS AND RESULTS MAY DIFFER MATERIALLY FROM THOSE DESCRIBED HEREIN. THE COMPANY DOES NOT UNDERTAKE TO UPDATE ANY FORWARD-LOOKING STATEMENTS OR INFORMATION EXCEPT AS MAY BE REQUIRED BY APPLICABLE SECURITIES LAWS.
Vancouver, British Columbia–(Newsfile Corp. – February 12, 2024) – Dolly Varden Silver Corporation (TSXV: DV) (OTC: DOLLF) (the “Company” or “Dolly Varden“) is pleased to announce 2023 step-out drilling at the Homestake Ridge property intersected a new gold-rich zone, to the northwest from the Homestake Silver Deposit.
Highlights of Homestake Silver step-outs to the northwest include: (intervals shown are core length**)
HR23-389: 79.49 g/t Au and 60 g/t Ag (80.21 g/t AuEq*) over 12.45meters including 1,335 g/t Au*** and 781 g/t Ag (1,344.42 g/t AuEq*) over 0.68 meters within a broad mineralized zone grading 15.26 g/t Au and 20.05 g/t Ag (15.50 g/t AuEq*) over 66.50 meters.
HR23-399: 43.10 g/t Au and 66 g/t Ag (43.90 g/t AuEq*) over 1.01 meters and 40.33 g/t Au and 418 g/t Ag (45.37 g/t Au Eq**) over 1.75 meters within a broad mineralized zone grading 2.68 g/t Au and 20 g/t Ag (2.92 g/t AuEq*) over 57.70 meters.
HR23-410: 10.17 g/t Au over 6.61 meters including 50.70 g/t Au over 0.62 meters.
Highlights from Homestake Main infill drilling below high-grade plunge include: (intervals shown are core length**)
HR23-374:22.60 g/t Au over 0.67 meters, 18.75 g/t Au over 2.00 meters and 10.15 g/t Au over 1.00 meter in separate vein breccias included in a wider mineralized envelope grading 1.22 g/t Au and 1.90 g/t Ag (1.24 g/t AuEq*) over 83.51 meters.
HR23-386: 18.14 g/t Au and 30 g/t Ag (18.51 g/t AuEq*) over 2.50 meters including 69.9 g/t Au and 42 g/t Ag (70.41 g/t AuEq*) over 0.50 meters.
HR23-390: 129.00 g/t Au and 218 g/t Ag (131.63 g/t AuEq*) over 0.50 meters in a vein breccia included in a wider mineralized envelope grading 1.92 g/t Au and 3.58 g/t Ag (1.96 g/t AuEq*) over 50.30 meters.
*AuEq and AgEq are calculated using $US1650/oz Au, $US20/oz Ag **Estimated true widths vary depending on intersection angles and range from 50% to 85% of core lengths. ***Determined using metallic screen fire assay on 1.0 kg split
“Whether we discover new zones of high-grade gold at Homestake Ridge or expand the large, wide and high-grade silver deposits at Wolf and Torbrit, drilling continues to deliver results from the premier, undeveloped gold-silver trend in Canada,” said Shawn Khunkhun, CEO of Dolly Varden Silver.
“The new high-grade gold and silver mineralization encountered in step out drilling to the northwest of Homestake Silver represents a significant breakthrough in further defining, upgrading and expanding the mineralization at Homestake Ridge,” said Rob van Egmond, Vice-President Exploration.” This new zone remains open to the northwest, projecting towards the Homestake Main Deposit.”
This release includes the remaining drill results from 48 drill holes from the 2023 drill program at the 100%-owned Kitsault Valley Project that includes the Homestake Ridge and Dolly Varden properties in BC’s Golden Triangle. Reporting 26 drill holes at Homestake Main (11,054.90m), four drill holes (2,478.00m) from the new gold-rich zone at the Homestake Silver northwestern extension, and six exploration drill holes on the Homestake Ridge property (1,627.00m). In addition, twelve holes (6,971.00m) from the Dolly Varden property including the North Star, Red Point and Wolf areas are reported in this release.
Homestake Silver Step-Out Drilling
The high-grade gold and silver intersections in holes HR23-389 and HR23-399 are horizontally separated by approximately 40m and are interpreted to be a new gold zone extending northwest, at depth towards the Homestake Main deposit. Deeper in these holes a second, targeted mineralized envelope was encountered (Figure 5). In longitudinal section, the new gold zone overlaps parallel with the known mineralized envelopes approximately 50 meters to the east. This zone remains open to the northwest below historic drilling. Drilling in 2024 will target a 350m long gap between the Homestake Silver and Homestake Main Deposits to expand this new zone (Figure 2).
Drill hole HR23-410 is a 75-meter step-out from previously released holes HR23-395 and 398 (January 4th, 2024 release) and represents an extension of the higher grade veins to depth and below the wide, higher grade plunge.
The dip of drill hole HR23-394 steepened due to hole deviation more than anticipated and remained in the footwall to mineralized zones.
Figure 1. Location in this release along Dolly Varden’s Kitsault Valley trend
The objective of drilling during 2023 at the Homestake Main and Homestake Silver deposits was to expanded multiple, subparallel mineralized zones and to upgrade Inferred Mineral Resources in the projected plunge of the wider, higher-grade zone. The drilling completed in 2023 at Homestake Main was primarily resource expansion drilling, targeting both down dip and along strike from current Mineral Resources.
At Homestake Main, the 2023 drilling tested the depth extent of the structural corridor that hosts the mineralization and infilled in areas of higher grades. Drill hole HR23-374 is located approximately 200m down dip from the modelled wide, high-grade plunge, planned as a depth test at the bottom edge of the known mineralized envelope.
Drilling along the northwest projection of the Homestake Main zone intersected the structural corridor and associated alteration but with a decrease in vein stockwork and vein breccias density.
Homestake Ridge Exploration Drilling
Four exploration drill holes (HR23-417, 420, 421 and 424) tested two parallel, northwest trending structures located 300 metres and 600 meters to the west of the Homestake Silver deposit. HR23-424 tested the Fox Reef, a parallel structure approximately 900 meters to the southwest. Numerous veins and breccias were intersected with lower grade gold values (Table 3). Another two drill holes (HR23-422 and 423) tested the Dilly – Rambler exploration target 1,500m to the south of Homestake Silver. Although zones of QSP alteration and structures of interest were intersected, no significant precious metal grades were returned from the samples in these holes.
The Homestake Ridge deposits are interpreted as a structurally controlled, multi-phase epithermal vein stockwork and vein breccia system hosted in Jurassic Hazelton Volcanic rocks. Mineralization consists of pyrite and chalcopyrite in a breccia matrix within a silica breccia vein system and quart-carbonate veining (Figure 3). The northwest orientation of the main Homestake structural trend appears to have numerous subparallel internal structures that are interpreted to form the controls for higher grade gold and silver shoots within a broader low-grade (>0.1 g/t Au) zone at the Homestake Main deposit. The main structural corridor dips steeply to the northeast at Homestake Main and rolls to steeply Southwest at Homestake Silver (Figure 2 and 5).
Figure 2. Long Section of Homestake Silver and Main. Modelled mineralized envelope from resource in Red (looking southwest)
Figure 3. Drill hole HR23-389 at the gold zone from the Homestake Silver deposit hosting quartz carbonate vein and stockwork with high-grade gold and silver mineralization.
Figure 4. Location of 2023 Drill holes at Homestake Main and northwest step outs at Homestake Silver in this release. Plan View with Current Mineral Resource block model in grey, primarily of Inferred Classification
Table 1. Completed Drill Hole Assays from the Homestake Silver Deposit Northern Extension drilling
Hole ID
From (m)
To (m)
Length (m)**
Au (g/t)
Ag (g/t)
Cu (%)
AuEq*
AgEq*
HR23-389
329.50
369.93
40.43
0.11
67
0.00
0.91
76
including
366.00
368.00
2.00
0.52
559
0.03
7.26
602
including
367.00
368.00
1.00
0.99
996
0.04
13.00
1078
New Au Zone
377.50
444.00
66.50
15.26
20
0.01
15.50
1285
including
401.00
413.45
12.45
79.49
60
0.01
80.21
6649
including
409.90
410.58
0.68
1335***
781
0.01
1344.42
111440
Lower Zone
503.07
550.35
47.28
1.22
1
0.01
1.23
102
including
510.60
511.85
1.25
13.70
4
0.01
13.75
1140
including
522.77
523.37
0.60
8.53
4
0.01
8.57
711
including
525.79
526.81
1.02
13.65
6
0.01
13.72
1137
HR23-394
416.50
421.50
5.00
0.52
14
0.02
0.69
57
including
416.50
417.50
1.00
2.10
26
0.03
2.42
200
and
484.00
486.00
2.00
2.20
50
0.02
2.79
231
HR23-399 New Au Zone
377.90
435.60
57.70
2.68
20
0.02
2.92
242
including
396.24
397.25
1.01
43.10
66
0.23
43.90
3639
including
413.00
414.75
1.75
40.33
418
0.13
45.37
3761
and
446.80
452.00
5.20
1.40
5
0.02
1.46
121
Lower Zone
545.10
570.00
24.90
0.36
NSV
0.36
30
HR23-410
329.35
329.85
0.50
0.12
1215
0.04
14.77
1225
and
329.85
330.35
0.50
0.06
192
0.41
2.37
197
75m Step out
566.11
572.72
6.61
10.17
7
0.03
10.25
850
including
567.58
571.47
3.89
16.81
10
0.04
16.93
1403
including
567.58
568.20
0.62
50.70
26
0.08
51.01
4229
including
570.00
571.47
1.47
15.30
9
0.05
15.41
1277
Table 2. Completed Drill Hole Assays from the Homestake Main Deposit Area
Hole ID
From (m)
To (m)
Length (m)**
Au (g/t)
Ag (g/t)
Cu (%)
AuEq*
AgEq*
HR23-367
295.75
304.80
9.05
1.66
1
0.01
1.68
139
including
299.96
300.80
0.84
3.16
2
0.03
3.19
264
including
301.32
301.82
0.50
19.80
11
0.06
19.94
1652
HR23-368
186.90
188.90
2.00
0.18
NSV
0.18
15
and
207.70
212.95
5.25
0.17
NSV
0.17
14
HR23-369
204.00
211.00
7.00
0.60
NSV
0.60
50
including
231.07
231.62
0.55
0.83
4
0.01
0.88
73
and
294.50
317.34
22.84
0.37
NSV
0.37
31
including
313.19
314.50
1.31
3.31
18
0.00
3.52
292
HR23-370
288.00
295.00
7.00
1.65
2
0.01
1.67
139
including
293.00
295.00
2.00
4.83
5
0.01
4.89
405
HR23-371
323.00
323.50
0.50
1.45
NSV
1.45
120
HR23-372
234.36
258.50
24.14
0.87
1
0.04
0.88
73
including
246.50
250.50
4.00
3.58
3
0.10
3.61
299
including
257.70
258.50
0.80
1.05
7
0.52
1.13
94
HR23-373
341.00
343.00
2.00
0.45
NSV
0.45
37
HR23-374
261.03
344.54
83.51
1.22
2
0.04
1.24
103
including
268.48
269.15
0.67
22.60
10
0.17
22.72
1883
including
311.00
313.00
2.00
18.75
8
0.22
18.85
1562
including
321.00
322.00
1.00
10.15
9
0.09
10.26
850
HR23-375
234.00
237.18
3.18
0.14
2
0.01
0.17
14
HR23-376
402.09
409.13
7.04
0.97
1
0.05
0.98
81
including
408.32
409.13
0.81
5.29
5
0.32
5.35
444
HR23-377
475.75
477.26
1.51
0.32
4
0.04
0.37
31
HR23-378
523.55
526.00
2.45
0.36
NSV
0.36
30
and
569.85
571.46
1.61
0.45
NSV
0.45
37
HR23-379
264.00
293.00
29.00
0.47
1
0.02
0.49
40
including
284.88
286.50
1.62
4.96
14
0.25
5.13
425
and
299.75
315.35
15.60
0.29
NSV
0.29
24
and
387.00
416.00
29.00
0.38
NSV
0.38
31
including
395.00
399.50
4.50
0.80
NSV
0.80
66
including
403.00
406.00
3.00
0.92
NSV
0.92
76
HR23-380
420.44
446.00
25.56
0.25
0
0.00
0.25
21
HR23-381
259.97
277.00
17.03
0.56
12
0.03
0.71
59
including
265.24
265.89
0.65
3.38
111
0.41
4.72
391
including
268.02
268.61
0.59
1.30
4
0.00
1.35
112
HR23-382
312.00
394.41
82.41
0.26
NSV
0.02
0.26
22
including
324.60
325.12
0.52
3.33
4
0.44
3.38
280
including
359.50
360.22
0.72
1.95
13
0.48
2.11
175
and
404.00
434.00
30.00
0.38
NSV
0.01
0.38
31
including
426.30
427.12
0.82
4.86
21
0.32
5.11
424
Table 2 con’t. Completed Drill Hole Assays from the Homestake Main Deposit Area
Hole ID
From (m)
To (m)
Length (m)**
Au (g/t)
Ag (g/t)
Cu (%)
AuEq*
AgEq*
HR23-383
166.08
168.00
1.92
0.86
39
0.00
1.33
110
HR23-384
338.12
371.10
32.98
0.31
1
0.01
0.33
27
and
391.00
444.00
53.00
0.30
1
0.00
0.31
26
HR23-385
485.67
515.05
29.38
0.25
2
0.07
0.27
22
and
510.00
510.70
0.70
0.93
15
0.63
1.11
92
HR23-386
156.69
208.95
52.26
1.47
25
0.13
1.78
147
including
159.00
160.00
1.00
1.35
969
0.09
13.04
1081
including
161.00
163.50
2.50
18.14
30
0.24
18.51
1534
including
161.00
161.50
0.50
69.90
42
0.18
70.41
5836
including
183.90
190.00
6.10
2.19
16
0.91
2.39
198
HR23-387
146.84
190.10
43.26
0.62
6
0.13
0.69
57
including
150.00
150.50
0.50
6.18
10
0.16
6.31
523
including
166.00
168.65
2.65
2.54
35
1.68
2.96
246
including
189.10
189.60
0.50
2.62
1
0.11
2.64
219
HR23-388
211.90
229.50
17.60
1.00
4
0.14
1.04
86
including
213.86
215.00
1.14
1.90
17
0.93
2.10
174
including
219.48
220.20
0.72
7.80
8
0.13
7.90
655
including
221.50
222.00
0.50
1.03
9
0.16
1.14
94
including
225.60
228.40
2.80
2.05
4
0.14
2.10
174
and
372.50
381.50
9.00
1.76
3
0.13
1.80
149
including
373.38
373.88
0.50
28.80
47
2.23
29.37
2434
HR23-390
167.70
218.00
50.30
1.92
4
0.03
1.96
162
including
169.68
170.18
0.50
129.00
218
1.09
131.63
10911
including
173.95
174.45
0.50
5.59
8
0.13
5.68
471
including
206.00
207.00
1.00
2.72
1
0.00
2.73
227
including
216.00
218.00
2.00
2.12
5
0.03
2.18
180
HR23-391
159.00
167.50
8.50
0.12
NSV
0.12
10
and
232.00
239.55
7.55
1.22
5
0.14
1.28
106
including
234.00
236.55
2.55
3.29
11
0.36
3.43
284
and
246.04
306.90
60.86
0.72
3
0.09
0.76
63
including
246.04
246.61
0.57
3.56
40
0.12
4.04
335
including
254.48
273.30
18.82
1.52
4
0.14
1.56
130
including
304.70
305.20
0.50
13.55
50
0.27
14.15
1173
and
324.00
346.20
22.20
0.26
0
0.02
0.27
22
including
331.80
332.30
0.50
3.96
5
0.84
4.03
334
HR23-392
113.00
119.00
6.00
0.45
47
0.02
1.01
84
Table 3. Completed Drill Hole Assays from the Homestake Ridge Property Exploration
Hole ID
From (m)
To (m)
Length (m)**
Au (g/t)
Ag (g/t)
Cu (%)
AuEq*
AgEq*
HR23-422
193.00
194.17
1.17
0.36
24
0.13
0.65
54
HR23-424
10.00
17.00
7.00
0.27
NSV
HR23-424
12.00
13.16
1.16
1.06
9
1.17
97
and
23.25
23.75
0.50
5.72
22
0.40
5.98
496
and
95.20
95.70
0.50
0.54
20
0.79
65
and
196.05
196.66
0.61
1.76
2
1.79
148
and
199.35
199.85
0.50
1.97
3
2.00
166
and
249.35
249.93
0.58
1.84
2
1.86
154
HR23-423
168.60
169.70
1.10
1.52
1
1.53
127
and
246.75
247.75
1.00
0.78
NSV
0.78
65
HR23-420
NSV
HR23-421
97.60
206.00
108.40
0.11
NSV
0.112
9
HR23-417
156.20
161.20
5.00
0.98
NSV
0.978
81
including
158.20
159.20
1.00
2.09
NSV
2.09
173
*AuEq and AgEq are calculated using $US1650/oz Au, $US20/oz Ag. **Estimated true widths vary depending on intersection angles and range from 50% to 90% of core lengths ***Determined using metallic screen fire assay on 1.0kg
Table 4. Drill Hole Collar Locations for 2023 Homestake Ridge drill holes in this release
Hole ID
Easting UTM83 (m)
Northing UTM83 (m)
Elev. (m)
Azimuth
Dip
Length (m)
HR23-367
462840
6179693
952
211
-58
351.00
HR23-368
462840
6179693
952
202
-68
402.00
HR23-369
463071
6179531
927
237
-55
414.00
HR23-370
462840
6179693
952
226
-56
324.90
HR23-371
462771
6179849
1091
200
-75
589.00
HR23-372
463071
6179531
927
235
-62
390.00
HR23-373
462840
6179693
952
230
-68
450.00
HR23-374
463166
6179562
895
232
-53
441.00
HR23-375
462771
6179849
1091
200
-62
582.00
HR23-376
462897
6179729
964
140
-65
609.00
HR23-377
463166
6179562
895
232
-71
552.00
HR23-378
462771
6179849
1091
200
-73
609.00
HR23-379
463015
6179634
918
210
-59
450.00
HR23-380
463132
6179539
914
221
-70
501.00
HR23-381
462794
6179271
1116
106
-45
402.00
HR23-382
463075
6179672
902
212
-55
450.00
HR23-383
463129
6179330
986
220
-53
285.00
HR23-384
463132
6179539
914
205
-66
501.00
HR23-385
462897
6179729
964
240
-74
600.00
HR23-386
463120
6179391
969
223
-57
300.00
HR23-387
463120
6179391
969
231
-52
306.00
HR23-388
463133
6179500
925
223
-47
399.00
HR23-390
463120
6179391
969
205
-62
354.00
HR23-391
463133
6179500
925
218
-61
439.00
HR23-392
462794
6179271
1116
116
-45
354.00
HR23-389
463590
6179193
825
228
-46
603.00
HR23-394
463590
6179193
825
228
-53
654.00
HR23-399
463590
6179193
825
232
-48
621.00
HR23-410
463560
6179124
834
220
-50
600.00
HR23-417exp
463182
6178630
1070
240
-50
283.00
HR23-420exp
463482
6178246
1014
240
-50
279.00
HR23-421exp
463295
6177829
1200
282
-46
222.00
HR23-422exp
463305
6177143
1117
166
-46
261.00
HR23-423exp
463713
6176389
1038
315
-50
255.00
HR23-424exp
463318
6178059
1169
230
-46
327.00
Dolly Varden Exploration Drilling
Result for twelve drill holes competed at the end of the 2023 season on the Dolly Varden property come from three main areas: Red Point, North Star and Wolf (Figure 6).
Red Point Drilling
Three holes were drilled in the Red Point area, located at the southern end of the western gold belt, approximately 10 kilometers southeast along the trend from the Homestake Ridge deposits. Styles of mineralization encountered including varying degrees of quartz and quartz-carbonate veining in a QSP alteration halo, similar to what is seen at the Homestake Ridge deposits. Highlights from the 2023 exploration drilling include: (intervals shown are core length**)
HR23-360: 1.92 g/t Au over 13.10 meters including 7.25 g/t Au and 1.12% Cu over 2.30 meters near surface all within a broad mineralized halo grading 0.44 g/t Au over 120.62 meters.
**Estimated true widths vary depending on intersection angles and range from 70% to 90% of core lengths.
North Star Drilling
Two drill holes intersected the stratabound mineralization of the North Star deposit, part of the Torbrit Horizon, approximately 50 meters down dip from historic underground drilling in the 1960s. The surface drill holes collars were moved further back to intercept the horizon at a better angle and test for continuity. The North Star deposit has higher lead (Pb) and zinc (Zn) values than the Torbrit deposit located across the Kitsault Valley. The Current Mineral Resource Estimate for North Star does not include any credits for the significant base metals in the mineralized horizon.
Highlights from North Star Area include: (intervals shown are core length**)
HR23-358: west step out, entire horizon: 199 g/t Ag with 1.28% Pb and 1.21% Zn (292 g/t AgEq) over 18.10 meters including 1,510 g/t Ag, 1.23% Pb and 5.34% Zn (1,755 g/t AgEq) over 0.58 meters and 753 g/t Ag, 0.51 g/t Au, 15.20% Pb and 4.32% Zn (1,430 g/t AgEq) over 1.00 meters.
**Estimated true widths vary depending on intersection angles and range from 80% to 95% of core lengths.
The North Star deposit (along the Torbrit Horizon) remains open to the west down dip along the Torbrit Horizon for follow up in the 2024 drill program.
Wolf Drilling
The five drill holes reported in this release for Wolf were part of an end of season follow up to test below the plunge of the wide, higher-grade zone. The Wolf structure was intersected with low silver grades and increased lead and zinc values, typical of below and outside of the plunge of high-grade silver zone (Figure 8).
Figure 6. Drill hole location map for Dolly Varden Property holes reported in this release.
Figure 7. Wolf Long Section with 2023 drill holes in this release highlighted in white. The 2023 result highlights shown from step-outs along the wide, high-grade plunge are from previous releases (Sept 11th and Nov 06th, 2023).
Table 5. Completed Drill Hole Assays from the Dolly Varden Property Exploration Drilling in this release.
Hole ID
From (m)
To (m)
Length (m)**
Ag (g/t)
Au (g/t)
Pb (%)
Zn (%)
AgEq (g/t)
DV23-353 North Star
251.05
254.50
3.45
138
0.07
3.50
7.69
543
including
252.50
254.50
2.00
211
0.10
5.74
9.82
769
and
266.45
267.10
0.65
426
0.39
0.59
0.24
485
and
291.50
292.50
1.00
219
0.47
0.05
1.29
308
DV23-358 North Star
278.96
280.80
1.84
52
0.03
0.80
11.10
500
and
293.32
311.42
18.10
199
0.08
1.28
1.21
292
including
293.32
300.75
7.43
345
5.92
2.75
1.6
491
including
293.32
293.90
0.58
1510
0.06
1.23
5.34
1755
including
296.00
297.00
1.00
753
0.51
15.20
4.32
1430
DV23-360 Red Point
1.85
122.47
120.62
3
0.44
0.02
0.05
42
including
34.90
48.00
13.10
6
1.92
0.03
0.08
169
including
44.00
46.30
2.30
15
7.25
0.03
0.07
619
DV23-363 Red Point
29.00
109.00
80.00
NSV
0.38
including
51.00
54.10
3.10
12
3.45
298
DV23-384 Red Point
724.20
783.00
58.80
1
0.28
0.01
0.03
26
including
737.50
761.81
24.31
1
0.45
0.00
0.02
39
DV23-377 Surprise
NSV
DV23-378 Surprise
NSV
DV23-380 Wolf
575.60
584.28
8.68
2
NSV
0.12
0.55
26
DV23-381 Wolf
593.13
594.10
0.97
115
0.03
1.60
1.73
233
and
669.20
670.20
1.00
184
0.04
0.52
2.44
295
and
671.92
673.90
1.98
215
0.01
0.23
3.17
343
and
675.40
676.40
1.00
138
0.03
15.04
3.12
725
DV23-382 Wolf
549.83
570.70
20.87
39
0.18
1.25
0.70
119
including
551.00
552.30
1.30
250
0.28
15.38
3.80
895
DV23-383 Wolf
274.00
276.72
2.72
6
0.03
0.06
1.14
53
DV23-385 Wolf
369.02
384.62
15.60
21
0.05
0.77
0.61
72
including
372.10
372.92
0.82
131
0.28
0.34
0.55
185
*AgEq is calculated using $US20/oz Ag, $US0.90/lb Pb and $US1.10/lb Zn **Estimated true widths vary depending on intersection angles and range from 70% to 95% of core lengths
Table 6. Drill Hole Collar Locations for 2023 Dolly Varden Property drill holes in this release.
Hole ID
Easting UTM83 (m)
Northing UTM83 (m)
Elev. (m)
Azimuth
Dip
Length (m)
DV23-353 North Star
467575
6171329
533
115
-60
431.00
DV23-358 North Star
467575
6171329
533
155
-58
413.00
DV23-360 Red Point
467026
6172064
618
205
-50
384.00
DV23-363 Red Point
466782
6172288
707
220
-63
378.00
DV23-384 Red Point
466500
6171968
759
260
-60
912.00
DV23-377 Surprise
466815
6173693
446
232
-46
300.00
DV23-378 Surprise
466815
6173693
446
340
-60
618.00
DV23-380 Wolf
467013
6173643
383
140
-71
803.00
DV23-381 Wolf
467013
6173643
383
140
-74
824.00
DV23-382 Wolf
467013
6173643
383
142
-65
648.00
DV23-383 Wolf
467265
6172994
372
305
-55
762.00
DV23-385 Wolf
467127
6173757
364
138
-57
498.00
Quality Assurance and Quality Control
The Company adheres to CIM Best Practices Guidelines for exploration related activities conducted on its property. Quality Assurance and Quality Control (QA/QC) procedures are overseen by the Qualified Person.
Dolly Varden QA/QC protocols are maintained through the insertion of certified reference material (standards), blanks and field duplicates within the sample stream. Drill core is cut in-half with a diamond saw, with one-half placed in sealed bags and shipped to the laboratory and the other half retained on site. Third party laboratory checks on 5% of the samples are carried out as well. Chain of custody is maintained from the drill to the submittal into the laboratory preparation facility.
Analytical testing was performed by ALS Canada Ltd. in North Vancouver, British Columbia. The entire sample is crushed to 70% minus 2mm (10 mesh), of which a 500 gram split is pulverized to minus 200 mesh. Multi-element analyses were determined by Inductively Coupled Plasma Mass Spectrometry (ICP-MS) for 48 elements following a 4-acid digestion process. High grade silver testing was determined by Fire Assay with either an atomic absorption, or a gravimetric finish, depending on grade range. Gold is determined by Fire Assay on a 30g split with and AA finish and over limits determined by Fire Assay with a gravimetric finish. Metallic screen fire assay analysis on 1kg sample +106umis carried out when determined to be necessary on higher grade samples.
Qualified Person
Rob van Egmond, P.Geo., Vice-President Exploration for Dolly Varden Silver, the “Qualified Person” as defined by NI43-101 has reviewed, validated and approved the scientific and technical information contained in this news release and supervises the ongoing exploration program at the Dolly Varden Project.
About Dolly Varden Silver Corporation
Dolly Varden Silver Corporation is a mineral exploration company focused on advancing its 100% held Kitsault Valley Project (which combines the Dolly Varden Project and the Homestake Ridge Project) located in the Golden Triangle of British Columbia, Canada, 25kms by road to tide water. The 163 sq. km. project hosts the high-grade silver and gold resources of Dolly Varden and Homestake Ridge along with the past producing Dolly Varden and Torbrit silver mines. It is considered to be prospective for hosting further precious metal deposits, being on the same structural and stratigraphic belts that host numerous other, on-trend, high-grade deposits, such as Eskay Creek and Brucejack. The Kitsault Valley Project also contains the Big Bulk property which is prospective for porphyry and skarn style copper and gold mineralization, similar to other such deposits in the region (Red Mountain, KSM, Red Chris).
Forward-Looking Statements
This release may contain forward-looking statements or forward-looking information under applicable Canadian securities legislation that may not be based on historical fact, including, without limitation, statements containing the words “believe”, “may”, “plan”, “will”, “estimate”, “continue”, “anticipate”, “intend”, “expect”, “potential”, and similar expressions. Forward-looking statements involve known and unknown risks, uncertainties, and other factors which may cause the actual results, performance, or achievements of Dolly Varden to be materially different from any future results, performance, or achievements expressed or implied by the forward-looking statements. Forward-looking statements or information in this release relates to, among other things, the 2022 drill program at the Kitsault Valley Project, the results of previous field work and programs and the continued operations of the current exploration program, interpretation of the nature of the mineralization at the project and that that the mineralization on the project is similar to Eskay and Brucejack, results of the mineral resource estimate on the project, the potential to grow the project, the potential to expand the mineralization and our beliefs about the unexplored portion of the property.
These forward-looking statements are based on management’s current expectations and beliefs and assume, among other things, the ability of the Company to successfully pursue its current development plans, that future sources of funding will be available to the company, that relevant commodity prices will remain at levels that are economically viable for the Company and that the Company will receive relevant permits in a timely manner in order to enable its operations, but given the uncertainties, assumptions and risks, readers are cautioned not to place undue reliance on such forward-looking statements or information. The Company disclaims any obligation to update, or to publicly announce, any such statements, events or developments except as required by law.
For additional information on risks and uncertainties, see the Company’s most recently filed annual management discussion & analysis (“MD&A“) and management information circular dated January 21, 2022 (the “Circular“), both of which are available on SEDAR at www.sedar.com. The risk factors identified in the MD&A and the Circular are not intended to represent a complete list of factors that could affect the Company.
Neither the TSX Venture Exchange nor its Regulation Services Provider (as that term is defined in the policies of the TSX-V) accepts responsibility for the adequacy or accuracy of this news release.