Liquidity Crunch, Not a Broken Thesis: Gold was sold as a source of liquidity during forced deleveraging, not because its underlying fundamentals had weakened.
Iran Shock Disrupted Reserve Flows: The conflict in Iran and the closure of the Strait of Hormuz (through which ~20% of global oil flows) halted energy revenues and stalled sovereign gold buying, removing a key pillar of demand.
A Familiar Stress Pattern: Like 2008 and 2020, gold is reacting to liquidity pressure, not failing as a hedge.
Setup for Gold’s Next Bull Phase: Structural pressures are building toward renewed monetary support—historically a powerful catalyst for gold.
Gold’s Dramatic Sell-Off
Since reaching an all-time high of $5,589.38 per ounce on January 28, 2026, gold has been a volatile ride. The major sell-off over the last three weeks in March has left gold in the $4,400 range. This dramatic pullback has surprised many investors. The decline has occurred against a backdrop that, under traditional frameworks, should have been supportive: elevated geopolitical risk, a major energy shock, rising volatility across asset classes and growing concerns about global growth. Yet gold has fallen sharply.
Gold is being sold in a liquidity-driven deleveraging.
We believe the move reflects a broad liquidity-driven selling event, driven by macro reserve-flow dynamics and forced deleveraging across investment portfolios. In short, gold is being sold because liquidity is being raised, not because its role as a strategic asset has diminished.
Figure 1. Gold Chart Highlighting Support Zone and 200-Day Moving Average
Source: Bloomberg. Data as of 3/24/2026. The spot gold price is measured by XAU Curncy. The 200‑day moving average is a technical indicator that represents the average closing price of an asset over the past 200 trading days. It is commonly used to assess an asset’s long‑term trend.
Gold Is Now Anchored to Reserve Flows
Since 2022, gold’s primary price anchor has shifted. Historically, Western investment flows dominated price action, with gold trading mostly as a function of market-related factors such as real rates, the dollar and risk sentiment. That regime has changed considerably.
The freezing of Russia’s foreign exchange reserves in 2022 fundamentally altered global reserve behavior. Excess reserves that once flowed primarily into U.S. Treasuries increasingly moved into gold. As a result, gold has become more tightly linked to reserve accumulation by central banks, sovereigns and sovereign wealth funds than to traditional portfolio flows.
This matters because reserve accumulation is inherently cyclical. It depends on trade surpluses, export revenues, and, critically in the current environment, commodity income. When those flows slow or reverse, gold demand at the margin weakens.
Hormuz Energy Shock Hit Gold Through Reserves
The closure of the Strait of Hormuz—stemming from the conflict involving Iran, the U.S. and Israel—has had a direct, underappreciated impact on gold through reserve flows.
The Hormuz oil shock hit energy markets and quietly drained the reserve flows that had been supporting gold.
Gulf Cooperation Council (GCC) countries are among the world’s largest accumulators of reserves, funded overwhelmingly by oil exports. With energy flows disrupted, reserve accumulation has stalled. In some cases, reserves are being drawn down to meet fiscal obligations. Importantly, prices are set at the margin: gold does not require outright selling to fall; the loss of incremental buying pressure is sufficient. In other words, a buyer cohort that had been buying gold at scale has abruptly stepped away. When marginal demand falls from very strong to nonexistent, prices adjust sharply even in the absence of any forced selling.
The spillover effects extend beyond the Gulf. The energy shock is primarily affecting Asia, where about 80% of Persian Gulf energy flows. Higher oil prices represent a negative terms of trade shock for energy importers, reducing surplus reserves and, in turn, incremental gold demand. Together, these reserve flow dynamics have removed a key pillar of near-term support for gold prices.
China is the world’s largest importer of oil, but is also the world’s largest gold buyer. While there is a risk that China could slow its gold purchases due to reduced surplus reserves, the evidence suggests the opposite. In Figure 2, the left chart shows China’s gold ETF holdings, which have just spiked into the gold price downturn (we use China’s gold ETF holdings as a proxy for the broader China gold trend). The right chart plots the Shanghai gold premium, which is +4.4% above the London spot quote. The 4.4% premium is about 3 standard deviations above the 10-year average, indicating an aggressive bid for gold.
Figure 2. China Has Been Buying into the Gold Sell-Off
Source: Bloomberg. Data as of March 20, 2026.
Gold’s Move Amplified by Investment Side Selling
While reserve flows explain the macro backdrop, they do not fully account for the speed and magnitude of the decline. That acceleration came from the investment side.
Gold wasn’t sold on conviction; it became a source of cash.
The dominant driver here has been degrossing and deleveraging. Rising volatility across rates, foreign exchanges (FX), equities, and commodities triggered mechanical risk reduction across hedge funds, systematic strategies, commodity trading advisors (CTAs), and leveraged portfolios. In these environments, selling is rarely gradual. Positions are cut quickly, correlations rise and liquidity is raised as the primary objective.
Gold was a very popular holding and was widely held by funds. As portfolios were forced to shrink gross and net exposure, gold was sold alongside equities, credit, and other non-energy assets, not because investors suddenly became bearish on gold, but because it was a source of liquidity.
Additional factors reinforced the move:
The rapid unwind of short USD and de-dollarization trades also contributed to selling across precious metals.
Some systematic strategies responded to rising rates and a stronger dollar by mechanically reducing gold exposure.
Capital rotated aggressively into the energy complex, drawing flows away from metals.
Options-related positioning and volatility dynamics exacerbated short-term price moves.
Taken together, these forces created a classic liquidity-driven deleveraging, the same dynamic observed in prior stress episodes.
We’ve Been Here Before
History offers clear parallels. In both 2008 and 2020, gold initially sold off sharply during periods of acute financial stress. In each case, gold was sold not because it failed as a hedge but because it was one of the last remaining sources of liquidity. Once forced selling ran its course and policy responses followed, gold rallied strongly to all-time highs within months of market lows.
Today’s environment shares key features with those episodes: rising cross-asset volatility, tightening financial conditions and growing pressure on the global monetary system. The current drawdown fits that historical pattern.
Gold’s Longer-Term Setup Is Strengthening
Paradoxically, the same forces pressuring gold in the short term are improving its long-term outlook.
The global system is moving deeper into a regime defined by energy scarcity, fiscal strain and elevated inflation risk. Debt levels are high, deficits are widening and central banks face increasingly constrained policy choices. If the energy shock persists and growth deteriorates, the probability of renewed large-scale liquidity support (QE or quantitative easing) rises materially.
At that point, the debate shifts from theoretical to actual debasement. Historically, that transition has been powerful for gold.
The forces weighing on gold today are likely to drive its next bull run.
Moreover, the structural trends that underpin gold’s secular bull market remain intact: the erosion of the dollar-centric reserve system, the fragility of the petrodollar framework, and the remonetization of gold as a neutral reserve asset. None of these dynamics has reversed; if anything, they have accelerated.
Silver’s Volatility Is Being Driven by Derivatives
Silver, meanwhile, has behaved differently, with greater volatility. The price of silver set a record high above $121 per ounce in February 2026, and now sits at ~$65 as of this writing. While macro flows largely drove gold’s moves, silver’s price action has been heavily influenced by options positioning and market structure. In simple terms, derivatives activity, not underlying fundamentals, has been the dominant driver of short-term price movements. This has led to wider trading ranges and reduced visibility for directional investors.
Figure 3. Silver’s Volatile Trading (2025-2026)
Source: Bloomberg. Data as of 3/24/2026. The spot silver price is measured by XAU Curncy.
The Bottom Line?
Gold’s decline was triggered by liquidity-driven deleveraging, not by a change in fundamentals. Rising cross-asset volatility forced investors to raise cash and reduce exposure, prompting the sale of gold as a liquid source of capital.
A sudden halt in reserve flow demand removed a critical price-support mechanism. Central banks, sovereigns, and sovereign wealth funds, particularly in the Gulf Cooperation Council (GCC), shifted from aggressive accumulation to zero incremental buying as energy revenues stalled, mechanically pressuring prices at the margin.
The sell-off is setting up, not negating, the next bull phase. Energy scarcity, fiscal strain, and constrained central banks increase the likelihood of future liquidity support and monetary debasement, conditions that have historically preceded major gold up moves.
Investment Risks and Important Disclosure
Relative to other sectors, precious metals and natural resources investments have higher headline risk and are more sensitive to changes in economic data, political or regulatory events, and underlying commodity price fluctuations. Risks related to extraction, storage and liquidity should also be considered.
Gold and precious metals are referred to with terms of art like “store of value,” “safe haven” and “safe asset.” These terms should not be construed to guarantee any form of investment safety. While “safe” assets like gold, Treasuries, money market funds and cash generally do not carry a high risk of loss relative to other asset classes, any asset may lose value, which may involve the complete loss of invested principal.
Past performance is no guarantee of future results. You cannot invest directly in an index. Investments, commentary and opinions are unique and may not be reflective of any other Sprott entity or affiliate. Forward-looking language should not be construed as predictive. While third-party sources are believed to be reliable, Sprott makes no guarantee as to their accuracy or timeliness. This information does not constitute an offer or solicitation and may not be relied upon or considered to be the rendering of tax, legal, accounting or professional advice.
Denver, Colorado–(Newsfile Corp. – March 24, 2026) – Elemental Royalty Corporation (TSXV: ELE) (NASDAQ: ELE) (“Elemental” or the “Company“) is pleased to report results for the year ended December 31, 2025. For the year, Elemental delivered revenue of US$43.6 million, revenue plus attributable share of Caserones1 of US$49.2 million, and adjusted EBITDA1 of US$34.9 million.
2025 Financial Highlights
Record full year revenue plus attributable share of Caserones1 of US$49.2 million, up 128% over prior year, exceeding 2025 updated guidance of US$42 million;
Gold Equivalent Ounces (“GEOs”) of 14,285 for 2025 (8,987 in 2024), driven by contributions from Karlawinda, Bonikro, Korali Sud, and Caserones, and the completion of the merger with EMX Royalty Corporation;
Adjusted EBITDA1 of US$34.9 million, up 131% over prior year, demonstrating strong cash flow conversion;
Adjusted operating cash flow1 of US$33.9 million, up 288% over prior year; and
Cash and cash equivalents as of December 31, 2025 of US$53.1 million and a working capital1 of US$80.1 million, demonstrating financial flexibility for growth.
Q4 2025 Financial Highlights
Record Q4 revenue of US$16.0 million and record revenue plus attributable share of Caserones1 of US$17.2 million, up 153% on Q4 2024
Q4 attributable GEOs1 of 4,133 ounces (2,551 GEOs in Q4 2024)
US$52 million acquisition of uncapped 2% GRR on the Laverton Gold Project and an uncapped 2% GRR on Jasper Hills in Western Australia
Completion of merger with EMX Royalty Corporation
2026 Outlook and Guidance
Revenue guidance for 2026 US$76.5 to US$94.5 million based on a gold price of US$4,500/oz and a copper price of US$5.50/lb
GEO guidance for 2026 of 17,000 to 21,000 GEOs
David M. Cole, Elemental Chief Executive Officer, commented: “2025 was a landmark year for Elemental, underscored by our merger with EMX Royalty Corporation, which significantly expanded our revenue base and strengthened our platform for long-term growth. The combination creates a more broadly diversified royalty portfolio across commodities, jurisdictions, and development stages, enhancing resilience and scale, with key cash-flowing assets such as Caserones, Timok, Karlawinda, and Leeville. This broader portfolio provides greater optionality through exposure to an expanded pipeline of organic growth opportunities and future project advancements, including the Laverton Gold Project, which we expect to become a cornerstone asset. As we enter 2026, we are well positioned to benefit from the merger’s synergies and deliver continued value creation for shareholders.”
Investor Webinar
An investor webinar will be held on Wednesday March 25, 2026, starting at 11am Eastern Time, to discuss these results, followed by a question-and-answer session.
To register for the investor webcast, please click the link below:
https://app.webinar.net/XxJnNlbkAGY
A replay of the event will be available on the Elemental website following the presentation.
Financial Summary for the Three Months and Year Ended December 31, 2025:
For the three months ended December 31,
For the year ended December 31,
(In thousands of US dollars)
2025
2024
2025
2024
Statement of Income
Revenue
$
16,047
$
5,519
$
43,643
$
16,323
General and administrative expense
$
9,842
$
2,149
$
16,467
$
7,396
Royalty generation expense, net
$
1,058
$
–
$
1,058
$
–
Net income (loss) from continuing operations
$
(3,209
)
$
132
$
1,772
$
(312
)
Statement of Cash Flows
Cash flows from operating activities
$
11,203
$
2,555
$
30,811
$
4,816
Non-IFRS Financial Measures1
Revenue plus attributable share of Caserones
$
17,226
$
6,827
$
49,200
$
21,600
Adjusted cash flows from operating activities
$
11,203
$
3,315
$
33,937
$
8,738
Adjusted EBITDA
$
8,456
$
4,769
$
34,901
$
15,111
GEOs sold
4,133
2,551
14,285
8,987
Key Strategic Developments
2025 was a transformative year for Elemental, defined by strategic initiatives that strengthened the Company’s scale, diversification, and long-term growth profile. Key developments during the year included:
Completion of the merger with EMX, creating a larger, combined royalty company with a materially expanded revenue base and enhanced capital markets presence.
Secured a strategic investment from Tether Investments S.A. de C.V (“Tether”), strengthening the share register, enhancing financial flexibility, and supporting the Company’s growth initiatives.
Acquired the uncapped 2% GRR royalty over the Laverton Gold Project in Western Australia for US$52 million, which is expected to become a cornerstone asset within the portfolio given its scale, development trajectory, and long-term upside.
Benefited from continued advancement and optimization across producing assets within the portfolio, supporting stable cash flow generation and near-term growth visibility.
Announced after year end, the Company advanced its capital allocation framework and financial capacity through the introduction of an inaugural annual dividend of US$0.12 per share (paid quarterly) and the establishment of a US$150 million revolving credit facility and US$50 million accordion feature, enhancing balance sheet flexibility to support future growth initiatives while delivering sustainable returns to shareholders.
2025 Performance to Guidance:
Please see our MD&A for the year ended December 31, 2025 for more details on our guidance and see “Forward-Looking Statements” and “Future-Oriented Financial Information” below.
The following is an evaluation of the Company’s performance compared to our 2025 Guidance:
2025 GuidanceA
2025 Updated GuidanceB
2025 Results
GEO Sales
11,600 to 13,200
11,600 to 13,200
14,285
Revenue plus attributable share of Caserones1
US$31.1 to US$34.3 million
US$42.0 million
US$49.2 million
A Assumed commodity prices of US$2,600/oz gold and US$4.00/lb copper.
B Assumed commodity price of US$4,000/oz gold and US$4.00/lb copper.
Excluding revenue attributable to assets acquired through the merger with EMX, Elemental’s assets recognized 12,459 GEO Sales1, placing results in the top half of the updated guidance range. Assets acquired through the EMX merger contributed an additional 1,826 GEOs following the date of the closing of the transaction, November 13, 2025. Had the merger taken place on January 1, 2025, the Company would have generated US$72.2 million in revenue and US$87.5 million in revenue plus attributable share of Caserones1, aligning with consensus combined revenue guidance of US$85 million.
2026 Guidance
In 2026, we expect royalty revenue of 17,000 to 21,000 GEOs. 2026 guidance is based on public forecasts and disclosures by the owners and operators of our assets, historical performance, and management’s understanding of the underlying producing assets.
2026 GuidanceA
GEO Sales1
17,000 to 21,000
Revenue
US$76.5 to US$94.5 million
A Assumed commodity price of US$4,500/oz gold and US$5.50/lb copper.
The noted increase in expected GEOs compared to 2025 is mainly due to the contribution of assets acquired through the merger with EMX in Q4 2025, offset by a decrease in production at Korali Sud.
The Company has assumed a commodity price of US$4,500/oz gold and US$5.50/lb copper. The increase in gold prices has outpaced the rise in copper prices, resulting in a negative impact on GEOs due to Elemental’s exposure to copper-linked assets, specifically Caserones and Timok.
Following an amendment to the SLM California shareholder agreement effective November 13, 2025, the Company reassessed its interest in SLM California, which holds the Caserones royalty. The revised arrangement was determined to constitute a joint operation under IFRS 11, resulting in the discontinuation of equity accounting under IAS 28 and the recognition of the Company’s proportionate share of assets, liabilities, revenues, and expenses. As a result, the contribution from Caserones in 2026 will be fully categorized as revenue and will no longer require an adjustment to revenue in future periods.
Portfolio Growth
Elemental continues to advance a disciplined growth strategy focused on building a globally diversified portfolio of high-quality royalty and streaming interests, with a core emphasis on gold and precious metals. The Company’s portfolio provides exposure to a range of assets throughout the development and production pipeline, including cornerstone interests such as Karlawinda, Laverton, and Leeville. This gold-focussed approach is complemented with selective exposure to large-scale base metals assets such as Caserones and Timok, with diversification across commodities, jurisdictions, and operators supporting stable cash flow generation, while preserving meaningful upside to exploration success and mine life extensions.
Near to medium-term portfolio growth is expected to be supported by continued development, optimization, and exploration activities at several key assets. At Timok, ongoing advancement of both the Upper and Lower Zone projects provides exposure to a world-class copper-gold system with significant scale potential. In addition, recent exploration success in the broader Timok district, including the Malka Golaja discovery, highlights the prospectivity of the regional land package and reinforces the long-term optionality of Elemental’s royalty interest. While the ultimate impact of such discoveries remains subject to further delineation and development by the operator, management views these results as encouraging indicators of the district’s geological potential.
Elemental’s exposure to precious metals growth is anchored by assets such as Karlawinda, a long-life gold operation in Western Australia. Ongoing mining activities and regional exploration at Karlawinda offer the potential to support stable production and incremental upside over time. The recently acquired Laverton royalty further enhances the Company’s exposure to a highly prospective gold district in Western Australia, in addition to the acquisition of the Dugbe royalty in Liberia, both of which support the near to medium-term pipeline of exploration-driven optionality and reinforce Elemental’s strategy of acquiring royalties over large land packages in established mining camps with Tier-one operators.
In addition to its core precious metals weighting, Elemental benefits from exposure to established and operating base metal assets such as Caserones, a large-scale copper mine where continued operational optimization and exploration efforts may contribute to sustained production and potential mine life extension. These base metal assets complement the gold-focussed portfolio, providing diversification and leverage to copper demand, which is increasingly supported by structural trends related to electrification, infrastructure investment, and the global energy transition.
Elemental remains well positioned to pursue additional accretive royalty and streaming opportunities across its targeted commodities. Management continues to evaluate a robust pipeline of potential transactions, reflecting sustained interest from mining companies seeking non-dilutive sources of capital. The Company’s strong balance sheet, recently amended US$150 million revolving credit facility, with a US$50 million accordion, and scalable business model provide enhanced financial flexibility to support disciplined capital deployment. The Company also benefits from supportive long-term shareholders, including Tether, whose investment reflects confidence in Elemental’s strategy and growth outlook.
Management believes Elemental’s gold-focussed, diversified asset base, strengthened liquidity position, and aligned shareholder support provide a solid foundation for long-term value creation.
Fourth Quarter and Full Year 2025 Performance by Asset
The following table is a summary of GEOs1 sold and revenue plus attributable share of Caserones1 for the fourth quarter of 2025 and 2024:
GEOs Sold
Revenue (in thousands of US dollars)
2025
2024
2025
2024
Ballarat
179
151
$
745
$
403
Bonikro
692
900
2,886
2,407
Caserones2
879
–
3,665
–
Gediktepe
387
–
1,613
–
Karlawinda
648
556
2,699
1,490
Korali-Sud
74
–
307
–
Leeville
286
–
1,192
–
Timok
261
–
1,086
–
Wahgnion
–
284
–
764
Other producing royalties
337
172
1,403
455
Advanced royalty payments
40
–
167
–
Total royalty revenue
3,782
2,063
$
15,763
$
5,519
Option, property and other revenue
68
–
284
–
Caserones (before reclassification)2
283
488
1,179
1,308
Revenue plus attributable share of Caserones1
4,133
2,551
$
17,226
$
6,827
The following table is a summary of GEOs1 sold and revenue plus attributable share of Caserones1 for the year ended December 31, 2025 and 2024:
GEOs Sold
Revenue (in thousands of US dollars)
2025
2024
2025
2024
Ballarat
709
323
$
2,454
$
807
Bonikro
3,174
2,208
10,886
5,430
Caserones2
387
–
3,665
–
Gediktepe
387
–
1,613
–
Karlawinda
2,563
2,171
8,857
5,199
Korali-Sud
3,446
–
10,515
–
Leeville
286
–
1,192
–
Timok
261
–
1,086
–
Wahgnion
–
1,126
–
2,692
Other producing royalties
812
789
2,924
1,865
Advanced royalty payments
40
–
167
–
Total royalty revenue
12,556
6,617
$
43,359
$
15,993
Option, property and other income
68
140
284
330
Caserones (before reclassification)2
1,661
2,230
5,557
5,277
Revenue plus attributable share of Caserones
14,285
8,987
$
49,200
$
21,600
Qualified Person
Michael P. Sheehan, CPG, a Qualified Person as defined by NI 43-101 and employee of the Company, has reviewed, verified, and approved the above technical disclosure.
About Elemental Royalty Corporation.
Elemental is a new mid-tier, gold-focused streaming and royalty company with a globally diversified portfolio of 16 producing assets and more than 200 royalties, anchored by cornerstone assets and operated by world-class mining partners. Formed through the merger of Elemental Altus and EMX, the Company combines Elemental Altus’s track record of accretive royalty acquisitions with EMX’s strengths in royalty generation and disciplined growth. This complementary strategy delivers both immediate cash flow and long-term value creation, supported by a best-in-class asset base, diversified production, and sector-leading management expertise.
Elemental trades on the Nasdaq and the TSX Venture Exchange under the ticker “ELE”.
This news release contains certain “forward looking statements” and certain “forward-looking information” as defined under applicable Canadian securities laws. Forward-looking statements and information can generally be identified by the use of forward-looking terminology such as “may”, “will”, “should”, “expect”, “intend”, “estimate”, “anticipate”, “believe”, “continue”, “plans” or similar terminology.
Forward-looking statements and information include, but are not limited to, statements with respect to the Company’s annual revenue and GEO guidance for 2026, future development and upside of the Laverton royalty, and the Company’s ability to support the future growth, and provide stable and sustainable returns. Forward-looking statements and information are based on forecasts of future results, estimates of amounts not yet determinable and assumptions that, while believed by management to be reasonable, are inherently subject to significant business, economic and competitive uncertainties and contingencies.
Forward-looking statements and information are subject to various known and unknown risks and uncertainties, many of which are beyond the ability of Elemental to control or predict, that may cause Elemental’s actual results, performance or achievements to be materially different from those expressed or implied thereby, and are developed based on assumptions about such risks, uncertainties and other factors set out herein, including but not limited to: the impact of general business and economic conditions, the absence of control over the mining operations from which Elemental will receive royalties, risks related to international operations, government relations and environmental regulation, the inherent risks involved in the exploration and development of mineral properties; the uncertainties involved in interpreting exploration data; the potential for delays in exploration or development activities; the geology, grade and continuity of mineral deposits; the possibility that future exploration, development or mining results will not be consistent with Elemental’s expectations; accidents, equipment breakdowns, title matters, labour disputes or other unanticipated difficulties or interruptions in operations; fluctuating metal prices; unanticipated costs and expenses; uncertainties relating to the availability and costs of financing needed in the future; the inherent uncertainty of production and cost estimates and the potential for unexpected costs and expenses, commodity price fluctuations; currency fluctuations; regulatory restrictions, including environmental regulatory restrictions; liability, competition, loss of key employees and other related risks and uncertainties. For a discussion of important factors which could cause actual results to differ from forward-looking statements, refer to the annual information form of Elemental for the year ended December 31, 2025. Elemental undertakes no obligation to update forward-looking statements and information except as required by applicable law. Such forward-looking statements and information represents management’s best judgment based on information currently available. No forward-looking statement or information can be guaranteed, and actual future results may vary materially. Accordingly, readers are advised not to place undue reliance on forward-looking statements or information.
Neither the TSX-V, its Regulation Service Provider (as that term is defined in the policies of the TSX-V), or the Nasdaq Stock Market LLC accepts responsibility for the adequacy or accuracy of this press release.
Notes
Royalty revenue received carries no direct cash cost of sales: distributions from associates related to Elemental’s effective royalty on Caserones were received net of Chilean taxes and have no other costs.
Refer to the “Non-IFRS financial measures” section below or on page 29 of the Q4 2025 MD&A for more information on each non-IFRS financial measure. These non-IFRS measures are not standardized financial measures under the financial reporting framework used to prepare the financial statements to which the measures relates and might not be comparable to similar financial measures disclosed by other issuers.
Effective November 13, 2025, the Company discontinued accounting for SLM California as an investment in associate and began recognizing its share of revenue from the Caserones royalty directly, rather than as a share of profit from associate.
Non-IFRS Financial Measures
The Company has included performance measures which are non-IFRS and are intended to provide additional information and should not be considered in isolation or as a substitute for measures of performance prepared in accordance with IFRS Accounting Standards. The non-IFRS measures do not have any standard meaning under IFRS Accounting Standards and other companies may calculate measures differently.
Caserones Reclassification
Effective November 13, 2025, the shareholders of SLM California executed an amendment to the entity’s shareholder agreement, resulting in the Company reassessing the classification of its interest in SLM California, which holds the Company’s Caserones royalty. As a result of the amendment to the shareholder agreement, the Company determined that the revised arrangement constituted a joint operation in accordance with IFRS 11 Joint Arrangements. Consequently, on November 13, 2025, the Company discontinued equity accounting under IAS 28 Investments in Associates and Joint Ventures and began recognizing its proportionate share of the assets, liabilities, revenues, and expenses of SLM California as a joint operation.
Reconciliation of Adjusted EBITDA:
The following is the reconciliation of adjusted EBITDA:
For the three months ended December 31,
For the year ended December 31,
(In thousands of US dollars)
2025
2024
2025
2024
Net income (loss) for the year of continuing operations
$
(3,209
)
$
132
$
1,772
$
(312
)
Project evaluation and transaction related expenses
2,555
91
3,623
641
Interest Income
(387
)
(65
)
(731
)
(198
)
Interest and finance expenses
140
387
478
2,028
Tax expense plus attributable share of Caserones
2,160
631
6,008
2,746
Depletion plus attributable share of Caserones
5,132
2,775
17,791
8,750
Depreciation
23
–
23
–
Losses (gains) on revaluation of financial instruments
(789
)
14
(769
)
5
Share-based compensation
445
368
2,436
1,388
Losses (gains) on disposals
369
–
2,253
(373
)
Impairment charges
2,017
436
2,017
436
Adjusted EBITDA
$
8,456
$
4,769
$
34,901
$
15,111
The presentation of this non-IFRS measure is intended to provide additional information and should not be considered in isolation or as a substitute for measures of performance prepared in accordance with IFRS Accounting Standards. Other companies may calculate these non-IFRS measures differently.
Reconciliation of Revenue, Depletion and Tax expense plus Attributable Share of Caserones:
Revenue plus attributable share of Caserones is a non-IFRS financial measure, which is defined as including gross royalty revenue from associated entities holding royalty interests related to Elemental’s effective royalty on the Caserones copper mine. Management uses revenue plus attributable share of Caserones to evaluate the underlying operating performance of the Company for the reporting periods presented, to assist with the planning and forecasting of future operating results, and to supplement information in its financial statements. Management believes that in addition to measures prepared in accordance with IFRS Accounting Standards such as revenue, investors may use revenue plus attributable share of Caserones to evaluate the results of the underlying business, particularly as the revenue plus attributable share of Caserones may not typically be included in operating results. Management believes that revenue plus attributable share of Caserones is a useful measure of the Company performance because it adjusts for items which management believes reflect the Company’s core operating results from period to period. Revenue plus attributable share of Caserones is intended to provide additional information to investors and should not be considered in isolation or as a substitute for measures of performance prepared in accordance with IFRS Accounting Standards. It does not have any standardized meaning under IFRS Accounting Standards and may not be comparable to similar measures presented by other issuers.
Depletion plus attributable share of Caserones and tax expense plus attributable share of Caserones are non-IFRS measures which include depletion and tax expense from the Caserones royalty asset respectively, consistent with the recognition of revenue plus attributable share of Caserones as described above.
The following is the reconciliation of revenue plus attributable share of Caserones:
For the three months ended December 31,
For the year ended December 31,
(In thousands of US dollars)
2025
2024
2025
2024
Revenue
$
16,047
$
5,519
$
43,643
$
16,323
The Company’s share of royalty revenue from Caserones
$
1,179
$
1,308
$
5,557
$
5,277
Revenue plus attributable share of Caserones
$
17,226
$
6,827
$
49,200
$
21,600
The following is the reconciliation of depletion plus attributable share of Caserones:
For the three months ended December 31,
For the year ended December 31,
(In thousands of US dollars)
2025
2024
2025
2024
Depletion of royalties
$
(4,882
)
$
(2,392
)
$
(16,334
)
$
(7,218
)
Depletion of Caserones
$
(250
)
$
(383
)
$
(1,457
)
$
(1,532
)
Depletion plus attributable share of Caserones
$
(5,132
)
$
(2,775
)
$
(17,791
)
$
(8,750
)
The following is the reconciliation of tax expense plus attributable share of Caserones:
For the three months ended December 31,
For the year ended December 31,
(In thousands of US dollars)
2025
2024
2025
2024
Tax expense
$
(1,842
)
$
(304
)
$
(4,508
)
$
(1,321
)
Tax expense related to Caserones
$
(318
)
$
(327
)
$
(1,500
)
$
(1,425
)
Tax expense plus attributable share of Caserones
$
(2,160
)
$
(631
)
$
(6,008
)
$
(2,746
)
Reconciliation of Adjusted Cash Flows from Operating Activities:
Adjusted cash flows from operating activities is a non-IFRS measure which includes dividends from the Caserones royalty asset.
The following is the reconciliation of adjusted cash flows from operating activities:
For the three months ended December 31,
For the year ended December 31,
(In thousands of US dollars)
2025
2024
2025
2024
Cash provided by operating activities
$
11,203
$
2,555
$
30,811
$
4,816
Caserones royalty distributions
–
760
3,126
3,922
Adjusted cash flows from operating activities
$
11,203
$
3,315
$
33,937
$
8,738
Reconciliation of Gold Equivalent Ounces Sold
Elemental’s revenue plus attributable share of Caserones is converted to an attributable gold equivalent ounce, or GEO, basis by dividing the royalty and other revenue from associates in a period by the average gold price for the same respective period. The presentation of this non-IFRS measure is intended to provide additional information and should not be considered in isolation or as a substitute for measures of performance prepared in accordance with IFRS
Accounting Standards. Other companies may calculate these non-IFRS measures differently. The production forecast was derived using information that is available in the public domain as at the date hereof, which included guidance and estimates prepared and issued by management of the operators of the mining operations in which Elemental holds an interest. The production forecast is sensitive to the performance and operating status of the underlying mines. None of the information has been independently verified by Elemental and may be subject to uncertainty. There can be no assurance that such information is complete or accurate.
The following is the reconciliation of gold equivalent ounces sold:
For the three months ended December 31,
For the year ended December 31,
(Revenue and gold price In US dollars)
2025
2024
2025
2024
Revenue plus attributable share of Caserones (in $000s)
Denver, Colorado–(Newsfile Corp. – March 18, 2026) – Elemental Royalty Corporation (TSXV: ELE) (NASDAQ: ELE) (“Elemental” or “the Company“) will release its Q4 and Full Year 2025 results after market close on Tuesday March 24, 2026.
An investor webinar will be held on Wednesday March 25, 2026, starting at 9am Mountain Time, 11am Eastern Time, to discuss these results, followed by a question-and-answer session.
About Elemental Royalty Corporation. Elemental Royalty is a new mid-tier, gold-focused streaming and royalty company with a globally diversified portfolio of 18 producing assets and more than 200 royalties, anchored by cornerstone assets and operated by world-class mining partners. Formed through the merger of Elemental Altus and EMX, the Company combines Elemental Altus’s track record of accretive royalty acquisitions with EMX’s strengths in royalty generation and disciplined growth. This complementary strategy delivers both immediate cash flow and long-term value creation, supported by a best-in-class asset base, diversified production, and sector-leading management expertise.
Elemental Royalty trades on the TSX Venture Exchange and on NASDAQ under the ticker symbol “ELE”.
Cautionary note regarding forward-looking statements and financial outlook This news release contains certain “forward-looking statements” and certain “forward-looking information” as defined under applicable United States and Canadian securities laws. Forward-looking statements and information can generally be identified by the use of forward-looking terminology such as “may”, “will”, “should”, “expect”, “intend”, “estimate”, “anticipate”, “believe”, “continue”, “plans” or similar terminology (including negative and grammatical variations thereof).
Forward-looking statements and information include, but are not limited to, statements regarding future royalties and future consideration payments or issuances of shares, or other statements that are not statements of fact. Forward-looking statements and information are based on forecasts of future results, estimates of amounts not yet determinable and assumptions that, while believed by management to be reasonable, are inherently subject to significant business, economic and competitive uncertainties and contingencies.
Forward-looking statements and information are subject to various known and unknown risks and uncertainties, many of which are beyond the ability of Elemental to control or predict, that may cause Elemental’s actual results, performance or achievements to be materially different from those expressed or implied thereby, and are developed based on assumptions about such risks, uncertainties and other factors set out herein, including but not limited to: the impact of general business and economic conditions, the absence of control over the mining operations from which Elemental will receive royalties, risks related to international operations, government relations and environmental regulation, the inherent risks involved in the exploration and development of mineral properties; the uncertainties involved in interpreting exploration data; the potential for delays in exploration or development activities; the geology, grade and continuity of mineral deposits; the possibility that future exploration, development or mining results will not be consistent with Elemental’s expectations; accidents, equipment breakdowns, title matters, labour disputes or other unanticipated difficulties or interruptions in operations; fluctuating metal prices; unanticipated costs and expenses; uncertainties relating to the availability and costs of financing needed in the future; the inherent uncertainty of production and cost estimates and the potential for unexpected costs and expenses, commodity price fluctuations; currency fluctuations; regulatory restrictions, including environmental regulatory restrictions; liability, competition, loss of key employees and other related risks and uncertainties. For a discussion of important factors which could cause actual results to differ from forward-looking statements, refer to the annual information form of Elemental for the year ended December 31, 2024. Elemental undertakes no obligation to update forward-looking statements and information except as required by applicable law. Such forward-looking statements and information represent management’s best judgment based on information currently available. No forward-looking statement or information can be guaranteed, and actual future results may vary materially. Accordingly, readers are advised not to place undue reliance on forward-looking statements or information.
Neither the TSX-V, its Regulation Service Provider (as that term is defined in the policies of the TSX-V) or the Nasdaq Stock Market LLC accepts responsibility for the adequacy or accuracy of this press release.
Vancouver, British Columbia, March 18, 2026 – Apollo Silver Corp. (“Apollo Silver” or the “Company”) (TSX.V:APGO, OTCQB:APGOF, Frankfurt:6ZF) is pleased to announce that it has engaged SLR Consulting (Canada) Ltd. (“SLR”), a globally recognized engineering and environmental consulting firm, to lead a Preliminary Economic Assessment (“PEA”) on the Company’s Calico Silver Project (“Calico” or the “Project”), located in San Bernardino County, California. The Project hosts one of the largest undeveloped primary silver deposits in the United States.
In parallel with the PEA, Apollo Silver will advance metallurgical and geotechnical programs designed to further refine the Company’s technical understanding of the Project as it progresses forward on the development path. The Company has engaged SLR as advisors to assist in managing the geotechnical and metallurgical investigations required to support the mine development plan.
Highlights
PEA Initiated: SLR engaged to conduct a PEA at Calico.
Additional Technical Support: SLR will also provide on-going metallurgical and geotechnical advisory support for additional development engineering analysis at Calico as the Company continues to advance the Project.
Exploration Work: Precision GeoSurveys US Inc. (“Precision”) has recently completed a high-resolution airborne magnetic and radiometric survey covering ~632-line km, designed to support geological interpretation, future exploration, and drill targeting.
Ross McElroy, President and CEO of Apollo Silver, commented, “The initiation of the PEA marks an important milestone in advancing the Calico Project on the development path. This study will evaluate potential mining and processing scenarios for the significant mineral resources identified at the Project.Engaging SLR to lead the PEA, while also supporting our on-going metallurgical and geotechnical programs, is expected to strengthen our technical understanding of the Project to support further project development on the path to Calico becoming a future producer.”
“At the same time, our exploration activities continue to ramp up, as highlighted by the recently completed airborne geophysical survey. We believe that the Calico Project has excellent potential for further significant discoveries, and that a systematic, multi-faceted exploration approach beginning with the surficial lithologic and structural mapping and complemented by the regional geophysics survey that are now completed, is key to unlocking that potential.”
Geotechnical Analysis
SLR will provide geotechnical advisory services and technical oversight for our programs, including planning, analysis, and quality assurance of site investigations.
The geotechnical scope of work will include:
Site investigation planning and technical guidance for geotechnical logging and laboratory testing.
Desktop geotechnical gap analysis.
Supervision and QA/QC of third-party geotechnical work.
Metallurgical and Processing Test Work
SLR will also provide metallurgical advisory services to support test work and process evaluation at the Waterloo deposit. The metallurgical program is intended to advance the Company’s understanding of mineral recovery and support development of an optimized processing flowsheet for upcoming development studies.
Metallurgical work will include:
Test work recommendations and program design
Sample selection and laboratory test work planning
Monitoring and interpretation of metallurgical test work results
Processing flowsheet evaluation and recovery estimation
Previously collected metallurgical samples are being evaluated for further testing.
Exploration – Airborne Magnetic and Radiometric Survey
Apollo Silver engaged Precision to complete a high-resolution airborne magnetic and radiometric survey over portions of the Calico Project. The survey covered approximately 632-line km across the Waterloo and Mule properties and has now been completed. The survey was carried out at 50-meter line spacing, providing high-resolution geophysical coverage across the Project area.
The airborne program was designed to:
Collect high-resolution magnetic and radiometric data across priority exploration areas of the Calico Project.
Compare radiometric signatures observed at the Waterloo deposit with data collected over the Mule property.
Evaluate whether geological signatures associated with the known Waterloo mineralization can also be identified at Mule.
Generate and refine potential drill targets for future exploration programs.
About the Calico Project
The Calico Project is a large silver project located in San Bernardino County, California, approximately 9 miles northeast of the city of Barstow, in a region known as the historic Calico Silver Mining District. The Project is comprised of 525 mineral claims (2 unpatented mill site claims, 474 unpatented lode mining claims, 29 fee lands claims and 20 patented lode mining claims) in three separate properties (Langtry, Waterloo and Mule) totaling 8,419 acres. The majority of the mineral resources are located on private land with vested mining rights.
Apollo Silver’s Calico Project hosts one of the largest undeveloped primary silver resources in the United States. The 2025 mineral resource estimate for Calico contains 125 million ounces of silver in the Measured and Indicated category within 55 million tonnes grading 71 g/t silver, and 58 million ounces of silver in the Inferred category within 25 million tonnes grading 71 g/t silver.1
In addition, the Project contains significant critical mineral resources in barite and zinc, alongside its substantial silver resource, positioning Calico as a source of multiple minerals considered important to domestic supply chains. The deposit hosts an Indicated Resource of 2.7 million tonnes of barite and 354 million pounds of zinc within 36 million tonnes grading 7.4% barite and 0.45% zinc, and an Inferred Resource of 0.65 million tonnes of barite and 258 million pounds of zinc within 17 million tonnes grading 3.9% barite and 0.71% zinc.[1]
Qualified Person
The scientific and technical data contained in this news release was reviewed and approved by Isabelle Lépine, M.Sc., P.Geo., Apollo’s Director, Mineral Resources. Ms. Lépine is a registered professional geologist in British Columbia and a QP as defined by NI 43-101 and is not independent of the Company.
About Apollo Silver Corp.
Apollo Silver is advancing the second largest undeveloped primary silver project in the US. The Calico Project hosts a large, bulk minable silver deposit with significant barite and zinc credits – recognized as critical minerals essential to the U.S. energy, industrial and medical sectors. The Company also holds an option on the Cinco de Mayo Project in Chihuahua, Mexico, which is host to a major carbonate replacement (CRD) deposit that is both high-grade and large tonnage. Led by an experienced and award-winning management team, Apollo Silver is well positioned to advance the assets and deliver value through exploration and development.
Neither the TSX Venture Exchange nor its Regulation Services Provider (as that term is defined in the policies of the TSX Venture Exchange) accepts responsibility for the adequacy or accuracy of this release.
Cautionary Statement Regarding “Forward-Looking” Information
This news release includes “forward-looking statements” and “forward-looking information” within the meaning of Canadian securities legislation. All statements included in this news release, other than statements of historical fact, are forward-looking statements including, without limitation, statements relating to the anticipated advancement of the Calico Project; the completion and results of metallurgical, geotechnical and exploration programs; the interpretation of geophysical survey results; the identification of new exploration targets; and the timing and potential completion of a preliminary economic assessment (“PEA”) and subsequent pre-feasibility study (“PFS”); the potential for additional mineral discoveries at the Project; the potential recovery of minerals and development of an optimized processing flowsheet. Forward-looking statements include predictions, projections and forecasts and are often, but not always, identified by the use of words such as “anticipate”, “believe”, “plan”, “estimate”, “expect”, “potential”, “target”, “budget” and “intend” and statements that an event or result “may”, “will”, “should”, “could” or “might” occur or be achieved and other similar expressions and includes the negatives thereof. There is no certainty that the Project will advance to production or that ongoing exploration or technical studies, including the PEA, will demonstrate technical or economic viability or support future development of the Project.
Forward-looking statements are based on the reasonable assumptions, estimates, analysis, and opinions of the management of the Company made in light of its experience and its perception of trends, current conditions and expected developments, as well as other factors that management of the Company believes to be relevant and reasonable in the circumstances at the date that such statements are made. Forward-looking information is based on reasonable assumptions that have been made by the Company as at the date of such information and is subject to known and unknown risks, uncertainties and other factors that may have caused actual results, level of activity, performance or achievements of the Company to be materially different from those expressed or implied by such forward-looking information, including but not limited to: risks associated with mineral exploration and development; metal and mineral prices; availability of capital; accuracy of the Company’s projections and estimates; realization of mineral resource estimates, interest and exchange rates; competition; stock price fluctuations; availability of drilling equipment and access; actual results of current exploration activities; government regulation; political or economic developments; environmental risks; insurance risks; capital expenditures; operating or technical difficulties in connection with development activities; personnel relations; and changes in project parameters as plans continue to be refined. Forward-looking statements are based on assumptions management believes to be reasonable, including but not limited to the price of silver, gold and barite; the demand for silver, gold and barite; the ability to carry on exploration and development activities; the timely receipt of any required approvals; the ability to obtain qualified personnel, equipment and services in a timely and cost-efficient manner; the ability to operate in a safe, efficient and effective matter; and the regulatory framework regarding environmental matters, and such other assumptions and factors as set out herein. Although the Company has attempted to identify important factors that could cause actual results to differ materially from those contained in forward-looking information, there may be other factors that cause results not to be as anticipated, estimated or intended. There can be no assurance that forward-looking statements will prove to be accurate and actual results, and future events could differ materially from those anticipated in such statements. Accordingly, readers should not place undue reliance on forward looking information contained herein, except in accordance with applicable securities laws. The forward-looking information contained herein is presented for the purpose of assisting investors in understanding the Company’s expected financial and operational performance and the Company’s plans and objectives and may not be appropriate for other purposes. The Company does not undertake to update any forward-looking information, except in accordance with applicable securities laws.
1 For more information, please see the news release dated September 4 and October 16, 2025, and the N.I. 43-101 Technical Report titled “NI 43-101 Technical Report and Mineral Resource Estimate for the Calico Silver Project, San Bernardino County, California, USA,” dated October 16, 2025 (with an effective date of June 30, 2025). The Technical Report was prepared in accordance with National Instrument 43-101 (“NI 43-101”) Standards of Disclosure for Mineral Projects by Stantec Consulting Ltd. (“Stantec”) of Denver, Colorado. Mineral Resources are not mineral reserves and do not have demonstrated economic viability. There is no certainty that any mineral resource will be converted into a mineral reserve.
Edmonton, Alberta–(Newsfile Corp. – March 17, 2026) – Grizzly Discoveries Inc. (TSXV: GZD) (FSE: G6H) (OTCQB: GZDIF) (“Grizzly” or the “Company”) announces that, on March 17, 2026, it closed on the sale of 2,030,000 Units and 13,430,000 FT Units, at $0.035 per Unit and FT Unit, for gross proceeds of $541,100 as an initial tranche of a non-brokered private placement originally announced on February 27, 2026 (the “Offering”).
The Offering consists of up to 7,142,856 Units and up to 21,428,574 of any combination of Units and FT Units. Each Unit consists of one common share of the Company (“Common Share”) and one Common Share purchase warrant entitling the warrant holder to purchase an additional Common Share for $0.055 and expiring on the earlier of a) 30 days following written notice by the Company to the warrant holder that the volume-weighted average trading price of the Common Shares on the TSX Venture Exchange is at or greater than CA$0.10 per Common Share for 10 consecutive trading days; and (b) 60 months (5 years) from the date of issuance (“Unit Warrant”). Each FT Unit consists of one Common Share and one half of one Common Share purchase warrant (“FT Unit Warrant”), each of which shall be issued as a “flow through share” for the purposes of the Income Tax Act (Canada). Each whole FT Unit Warrant shall entitle the holder to purchase an additional Common Share for $0.055 and expiring on the earlier of a) 30 days following written notice by the Company to the warrant holder that the volume-weighted average trading price of the Common Shares on the TSX Venture Exchange is at or greater than CA$0.10 per Common Share for 10 consecutive trading days; and (b) 36 months (3 years) from the date of issuance.
The Offering remains open, with up to 5,112,856 Units and up to 7,998,574 of any combination of Units and FT Units, pursuant to closing of this first tranche. The Units and the FT Units are being offered at $0.035 per Unit or FT Unit. The Offering is being offered to qualified subscribers in the Provinces of Alberta, British Columbia and Ontario and in other jurisdictions as the Company may in its discretion determine, in reliance upon exemptions from the registration and prospectus requirements of applicable securities legislation.In connection with the sale of an aggregate 2,030,000 Units and 12,430,000 FT Units, the Company paid cash finder’s fees of $29,463 and issued 841,800 non-transferable finder’s warrants, with equivalent terms to the FT Unit Warrants (“Finder Warrants”) as follows:
FinderFinder WarrantsCash Finder FeeVentum Financial Corp.36,000$1,260Hampton Securities Inc.60,000$2,100GloRes Securities Inc.685,800$24,003Raymond James Limited60,000$2,100 Following closing, the Company has 221,925,956 common shares issued and outstanding. The Common Shares and any Common Shares issued on exercise of the Unit Warrants, FT Unit Warrants, and Finder Warrants are subject to restrictions on trading until July 18, 2026. The Offering is subject to final acceptance of the TSX Venture Exchange.
ABOUT GRIZZLY DISCOVERIES INC.Grizzly is a diversified Canadian mineral exploration company with its primary listing on the TSX Venture Exchange focused on developing its approximately 72,700 ha (approximately 180,000 acres) of precious and base metals properties in southeastern British Columbia. Grizzly is run by a highly experienced junior resource sector management team, who have a track record of advancing exploration projects from early exploration stage through to feasibility stage.On behalf of the Board,GRIZZLY DISCOVERIES INC.Brian Testo, CEO, PresidentSuite 363-9768 170 Street NWEdmonton, Alberta T5T 5L4Email: info@grizzlydiscoveries.comFor further information, please visit our website at www.grizzlydiscoveries.com or contact:
On behalf of the Board,GRIZZLY DISCOVERIES INC.Brian Testo, CEO, PresidentSuite 363-9768 170 Street NWEdmonton, Alberta T5T 5L4Email: info@grizzlydiscoveries.comFor further information, please visit our website at www.grizzlydiscoveries.com or contact:Nancy MassicotteCorporate DevelopmentTel: 604-507-3377Email: nancy@grizzlydiscoveries.comNeither the TSX Venture Exchange nor its Regulation Services Provider (as that term is defined in the policies of the TSX Venture Exchange) accepts responsibility for the adequacy or accuracy of this release.
risks and uncertainties which are more fully described in our annual and quarterly Management’s Discussion and Analysis and in other filings made by us with Canadian securities regulatory authorities and available at www.sedarplus.ca. Grizzly disclaims any obligation to update or revise any forward-looking information or statements except as may be required by law.
March 18, 2026 – Vancouver, BC: Riverside Resources Inc. (“Riverside” or the “Company”) (TSX-V: RRI) (OTCQB: RVSDF) (FSE: 5YY0), is pleased to announce the successful consolidation of the Famosa Area with three mineral concessions within the Union Project district in Sonora, Mexico, through the completion of the final payment and transfer of mineral title from Pacific Comox S.A. de C.V. to Riverside’s wholly owned Mexican subsidiary, RRM Exploración S.A.P.I. de C.V.. This provides the Company with clear ownership and the ability to advance exploration and, potentially, move toward mining based on future development results.
The transaction completes the acquisition of three mineral concessions: La Famosa, Dana 7, and Dana 7 which form an important portion of the southern part of the Union Project district. These concessions are mineral titles 199006, 220840, and 220841, with validity extending from 1994 through 2044 and 2003 through 2053, respectively. This long-term validity and fully titled status fit with the rest of the district mineral titles that the Company is advancing through its spring 2026 mineral exploration program.
The concessions were originally secured through an exploration agreement signed in August 2021 between RRM Exploración S.A.P.I. de C.V. and Pacific Comox S.A. de C.V., which provided Riverside with an option to purchase the claims within a five-year period (2021–2026). With the completion of the final payment of US$125,000, Riverside has now exercised the purchase option, and the titles have been formally transferred to Riverside. The total consideration for the acquisition amounts to US$175,000, and notably no net smelter royalty (“NSR”) or any other type of royalty is attached to this transaction.
“We are pleased to complete the consolidation of the Famosa area within the Union Project, securing full ownership with no royalty burden for the transaction on these key concessions,” said John-Mark Staude, President and CEO, Riverside Resources Inc. “This strengthens our district-scale land position and provides greater flexibility as we continue advancing exploration at Union with our partner Questcorp.”
The Famosa Area hosts carbonate replacement deposit (CRD) style mineralization and structurally controlled gold mineralization within dolomite and quartzite units, located in the southern portion of the broader Union Project district. The consolidation strengthens Riverside’s land position within the Union district and supports ongoing exploration efforts targeting CRD-style gold–silver–polymetallic mineralization.
This transaction represents another step in the systematic advancement of the Union Project, where Riverside has been working in partnership with Questcorp under an option agreement that provides for up to C$5.5 million in exploration expenditures funded by Questcorp while Riverside retains equity exposure and a 2.5% net smelter royalty on the project. Previous exploration programs at Union have included geological mapping, geophysics, diamond drilling, and high-grade rock chip channel sampling that have confirmed the presence of gold- and polymetallic-bearing CRD-style and sediment hosted gold-style mineralization across multiple targets within the district. By securing the Famosa concessions outright, Riverside further consolidates its district-scale land position and enhances the exploration potential across the southern portion of the Union Project. The expanded control of mineral titles provides increased flexibility for future exploration programs and supports the continued advancement of the project with partner-funded exploration.
Further technical updates related to exploration activities at the Union Project will be provided as programs progress.
About the Union Project
The Union Project is a district-scale carbonate replacement deposit (CRD) exploration project located in Sonora, Mexico. The project hosts historical mining areas and multiple exploration targets associated with gold, silver, zinc, and lead mineralization within carbonate and structurally controlled settings. Riverside operates the project through its Mexican subsidiary while advancing exploration in partnership with Questcorp.
Qualified Person
The technical content of the news release has been reviewed and approved by Freeman Smith, P.Geo. (British Columbia), a qualified person under National Instrument 43-101 who is non-independent and the Vice President Exploration for the Company.
About Riverside Resources Inc.: Riverside is a well-funded exploration company driven by value generation and discovery. The Company has a strong balance sheet with over C$5,000,000 cash, no debt and tight share structure with a strong portfolio of gold-silver, copper, and REE assets and royalties in North America. Further information about Riverside is available on the Company’s website at www.rivres.com.
ON BEHALF OF THE BOARD OF RIVERSIDE RESOURCES INC.
Eric Negraeff Investor Relations Riverside Resources Inc. Phone: (778) 327-6671 TF: (877) RIV-RES1 Web: www.rivres.com
Certain statements in this press release may be considered forward-looking information. These statements can be identified by the use of forward-looking terminology (e.g., “expect”,” estimates”, “intends”, “anticipates”, “believes”, “plans”). Such information involves known and unknown risks — including the risk that the Transaction will not be completed as contemplates, or at all, availability of funds, the results of financing and exploration activities, the interpretation of exploration results and other geological data, or unanticipated costs and expenses and other risks identified by Riverside in its public securities filings that may cause actual events to differ materially from current expectations. Readers are cautioned not to place undue reliance on these forward-looking statements, which speak only as of the date of this press release.
Neither the TSX Venture Exchange nor its Regulation Services Provider (as that term is defined in the policies of the TSX Venture Exchange) accepts responsibility for the adequacy or accuracy of this release.
This video features a deep-dive interview with Derek MacPherson, President and CEO of West Point Gold ($WPG), regarding the significant new gold discovery at the Black Dyke target within the Gold Chain Project in Arizona. Below is a detailed breakdown of the discussion with associated timestamps:
“Check out the timestamp links below to jump directly to the detailed technical analysis of the new Black Dyke discovery zone!”
0:00 – Introduction & Company Overview 1:30 – The Oatman District & Walker Lane Trend 3:15 – Black Dyke Target: 36.6m of Surface Gold Breakdown 5:45 – Validating a Potential Deeper System: Deeper Drill Hits 8:00 – 15,000m Program: Where are the Next 24 Drill Hole Assays Pending? 10:30 – Key Milestones defining a ‘Successful’ 2026 12:45 – Capital Structure & Financial Discipline 15:00 – CEO’s Closing Message & How to Invest
Vancouver, Canada – March 17, 2026 – West Point Gold Corp. (“West Point Gold” or the “Company”) (TSX.V: WPG) (OTCQB: WPGCF) (FSE: LRA0) is pleased to announce the intersection of shallow gold mineralization at the Black Dyke target located four kilometres (“km”) west of the Tyro Main Zone, at the Company’s Gold Chain Project in Arizona. The initial six reverse circulation (“RC”) drill holes at Black Dyke, suggest it is a highly prospective area where additional resources could be defined at the Gold Chain Project. Recent drilling results from the Black Dyke prospect have further prioritized the target for follow-up drilling in early 2026. To date, 10,255m of the ongoing 15,000m drill program at the Gold Chain project have been completed. Results are pending for 24 holes representing 5,361m from the Tyro Main Zone, South Tyro, Sheep Trail, and Bull 8 targets.
Highlights:
Black Dyke hosts a shallow-dipping body of quartz veinlets and breccia ranging in estimated thickness between 7.6 and 36.6m over a strike length of at least 200m and from surface to approximately 250m down-dip
The zone remains open along strike to the west and down-dip to the southwest
Alteration and textures observed in near surface drill results suggest the presence of a potentially deeper gold system associated with this shallow mineralization.
4 km west of Tyro, Black Dyke now represents a second area for potential resource development; follow-up drilling is planned to expand the limits of the shallow oxidized gold mineralization
“Black Dyke is now a potential second resource development area at Gold Chain, which is a meaningful milestone for the project. Shallow, oxidized gold from the surface, with the zone open in multiple directions, gives us a well-defined path to expand this target. Equally compelling is that West Point Gold found this by applying modern methods to a historically underexplored prospect, and the Company is taking that same approach across the property. With results pending from multiple step-out targets, it appears that the potential of the Gold Chain Project is still being defined”, stated Derek Macpherson, President and CEO.
Table 1: Drill Results
Holes
From(m)
To(m)
Width(m)
Grade(g/t Au)
GC25-095
0
36.6
36.6
1.04
GC25-097
4.6
15.2
10.6
0.80
GC26-098
21.3
42.7
21.3
0.92
GC26-099
62.5
70.1
7.6
1.56
GC26-100
No Significant Intercepts
GC26-101
114.3
126.5
12.2
1.09
Note: All widths shown are downhole; true widths are greater than 80% of downhole widths.
Figure 1: Plan view of the Gold Chain project showing geology, historical mines and/or current prospects. Note the location of the Black Dyke prospect.
Figure 2. Geologic map of the Black Dyke prospect showing drill holes and surface samples.
Drilling Summary
Holes GC26-95 and GC26-97 through GC26-101 (Table 1) confirm the presence of gold in the subsurface over meaningful grades and widths. The mineralized zone is part of the historical Black Dyke structure and confirms the presence of gold identified in previous exploration efforts. Figure 3 provides a preliminary view of this newly drilled zone and reveals that the gold-bearing holes cut the surface breccia a short distance, up to 250m, down-dip. Given that other NE-trending structures in the district have served as gold-bearing conduits, such as Tyro, Figure 2 suggests that a similar relationship exists at Black Dyke. A short distance into the hanging wall, volcanic rocks deposited upon the Precambrian granite are strongly altered (kaolinite-silica-iron oxide) and brecciated (Figure 3).
The geologic section provided in Figure 3 reveals a sub-horizontal ‘blanket’ of quartz-calcite breccia and veins at shallow depths. Hole GC26-95 contains 36.6m of 1.04 g/t Au and GC26-98 intersected 21.3m of 0.92 g/t Au. It appears that the holes closest to the intersection of the ‘Black Dyke’ breccia and the suspected NE-trending structure are thicker and point to the importance of this structural intersection. The southward continuation of this mineralized zone is likely and supported by the projection of mineralized, regional structures (Roadside Mine fault) and hydrothermal alteration in the overlying volcanics (Figure 1).
West Point Gold plans to return to the area to expand the gold zone by drilling to depth and laterally. The gold-bearing vein occurs as fragments in a calcite-cemented breccia. It is anticipated that these fragments emanated from a discrete vein or breccia body at depth.
Figure 3. Geologic section along Holes GC26-95, -98 and -101 revealing shallow gold mineralization above the water table (oxidized) extending beneath strongly altered and brecciated volcanics. Fault offsets are postulated, and irregularities in the breccia may, instead, reflect fault refractions or bends.
Project Geology
The northern limit of the Black Dyke prospect is defined by a northwest-trending low-lying ridge composed of coarsely crystalline calcite cementing up to 80+% chalcedony vein and vein (hydrothermal) breccia (Figure 4). The calcite is commonly banded and can be correlated to other calcite veins across the Gold Chain project, which are considered to have been deposited late in the gold system’s history and after the gold events.
Historical reports and mapping suggested a southward dip between 30 and 60 degrees. Drilling now indicates a shallow, southerly dip of less than 30 degrees. The western and eastern limits of the low-angle breccia are defined by north- to northeast-trending faults (Figure 2). In the surface exposures both the footwall (“FW”) and hangingwall (“HW”) rocks are composed of Precambrian granite. The FW contact is sharp with weak propylitic alteration in the underlying Precambrian rocks. The HW is strongly replaced by chlorite and invaded by abundant low-angle calcite veins (<1m) and veinlets. Surface weathering, which extends down to the footwall contact, is evidenced by strong iron and manganese oxides in the gold-bearing zones. Gold mineralization in these initial holes is associated with quartz-chalcedony-calcite veinlets, vein and vein breccia.
This entire south-dipping package passes beneath intensely altered (kaolinite-silica-iron oxides) Miocene dikes and volcanic breccias and tuffs. These rocks comprise distinct low-lying hills surrounded by alluvial deposits composed of gravel and sand. It is suspected that this high-level alteration is related to the gold events operative at Black Dyke.
Figure 4. Photograph of the Black Dyke ‘vein breccia’ showing the dark ‘desert varnish’ patina on quartz vein and vein breccia hosted in white-gray, massive to banded coarsely crystalline late-stage calcite.
Project History
The Black Dyke mine, which consists of a backfilled shaft, several small pits and dumps, and extensive roads, is located 4.8km east of the Katherine mine and 4.0km west of the Tyro Main Zone. The Katherine vein, like the Tyro vein (West Point Gold), trends northeast and consists of a broad zone of sub-parallel quartz-chalcedony-adularia-calcite veins and veinlets developed along ancestral shears and Miocene rhyolite dikes. Shortly after the discovery of the Katherine vein in 1900, prospectors discovered a broad, easterly trending gold-bearing ridge referred to as a “dyke”. It was later described as a vein breccia, up to 30 meters wide, composed of broken chalcedony vein and breccia cemented by a massive to banded, coarsely crystalline gray calcite with elevated manganese (Figure 4). Weathering of the siliceous vein fragments resulted in a dark patina (desert varnish) and, hence, the Black Dyke (dike).
There is no reported gold production from the Black Dyke mine although a two-compartment shaft was open in 1940 which was sunk to 150 feet (45.7m) in the hanging wall of the south-dipping breccia complex. Several hundred feet of drifting was conducted from the bottom of the shaft with much of it reported to be in mineralized rock. Historical assays reveal low gold grades over broad widths up to 30m. Intermittent exploration and development activities continued up through the 1930s but without recorded production.
In the 1980s, several RC/rotary drilling campaigns were conducted with up to 12 holes drilled across the prospect (see Figure 2). One hole, RSM15, drilled 20m of 0.65 g/t Au at 41m. Although the historical (pre-2020) database is considered incomplete, the holes plotted in Figure 2 appear to have been too shallow. Aside from these few holes, there does not appear to have been additional exploration until West Point Gold optioned the property in 2019.
Table 2: Drill hole locations and descriptions
Hole No.
Azimuth (degrees)
Inclination (degrees)
Easting
Northing
Length
GC25-095
0
-45
727932
3901658
62.5
GC25-097
45
-60
728006
3901621
74.7
GC26-098
0
-70
727952
3901592
86.9
GC26-099
330
-50
727838
3901632
106.7
GC26-100
50
-70
728038
3901472
144.8
GC26-101
280
-50
728033
3901471
150.9
Qualified Person
Robert Johansing, M.Sc. Econ. Geol., P. Geo., the Company’s Vice President, Exploration, is a qualified person (“QP”) as defined by NI 43-101 and has reviewed and approved the technical content of this press release. Mr. Johansing has also been responsible for overseeing all phases of the drilling program, including logging, labelling, bagging and transport from the project to American Assay Laboratories of Sparks, Nevada. Drillholes have a diameter of about 10cm, and samples have an approximate weight of 5 to 10kg. Samples were then dried, crushed and split, and pulp samples were prepared for analysis. Gold was determined by fire assay with an ICP finish, and over-limit samples were determined by fire assay and gravimetric finish. Silver plus 15 other elements were determined by Aqua Regia ICP-AES (IM-2A16), and over-limit samples were determined by fire assay and gravimetric finish. Both certified standards and blanks were inserted on site along with duplicates, standards and blanks inserted by American Assay. The results summarized above have been carefully reviewed with reference to the QA/QC results. Standard sample chain of custody procedures were employed during drilling and sampling campaigns until delivery to the analytical facility.
About West Point Gold Corp.
West Point Gold is an exploration and development company focused on unlocking value across four strategically located projects along the prolific Walker Lane Trend in Nevada and Arizona, USA, providing shareholders with exposure to multiple discovery opportunities across one of North America’s most productive gold regions. The Company’s near-term priority is advancing its flagship Gold Chain Project in Arizona.
For further information regarding this press release, please contact:
Certain statements contained in this press release constitute forward-looking information. These statements relate to future events or future performance. Forward-looking statements in this press release include statements with respect to Black Dyke representing a second area for potential resource development, that follow-up drilling is planned to expand the limits of the shallow oxidized gold mineralization, that near surface drill results suggest the presence of a potentially deeper gold system associated with this shallow mineralization and include estimates and statements that describe the Company’s future plans, objectives or goals, including words to the effect that the Company or management expects a stated condition or result to occur. The use of any of the words “could”, “intend”, “expect”, “believe”, “will”, “projected”, “estimated” and similar expressions and statements relating to matters that are not historical facts are intended to identify forward-looking information and are based on the Company’s current belief or assumptions as to the outcome and timing of such future events including, among others, assumptions about future prices of gold, silver, and other metal prices, currency exchange rates and interest rates, favourable operating conditions, political stability, obtaining government approvals and financing on time, obtaining renewals for existing licenses and permits and obtaining required licenses and permits, labour stability, stability in market conditions, availability of equipment, availability of drill rigs, and anticipated costs and expenditures. The Company cautions that all forward-looking statements are inherently uncertain, and that actual performance may be affected by a number of material factors, many of which are beyond the Company’s control. Such factors include, among other things: risks and uncertainties relating to West Point Gold’s ability to complete any payments or expenditures required under the Company’s various option agreements for its projects; and other risks and uncertainties relating to the actual results of current exploration activities, the uncertainties related to resources estimates; the uncertainty of estimates and projections in relation to production, costs and expenses; risks relating to grade and continuity of mineral deposits; the uncertainties involved in interpreting drill results and other exploration data; the potential for delays in exploration or development activities; uncertainty related to the geology, grade and continuity of mineral deposits; the possibility that future exploration, development or mining results may vary from those expected; statements about expected results of operations, royalties, cash flows, financial position may not be consistent with the Company’s expectations due to accidents, equipment breakdowns, title and permitting matters, labour disputes or other unanticipated difficulties with or interruptions in operations, fluctuating metal prices, unanticipated costs and expenses, uncertainties relating to the availability and costs of financing needed in the future and regulatory restrictions, including environmental regulatory restrictions. The possibility that future exploration, development or mining results will not be consistent with adjacent properties and the Company’s expectations; operational risks and hazards inherent with the business of mining (including environmental accidents and hazards, industrial accidents, equipment breakdown, unusual or unexpected geological or structural formations, cave-ins, flooding and severe weather); metal price fluctuations; environmental and regulatory requirements; availability of permits, failure to convert estimated mineral resources to reserves; the inability to complete a feasibility study which recommends a production decision; the preliminary nature of metallurgical test results; fluctuating gold prices; possibility of equipment breakdowns and delays, exploration cost overruns, availability of capital and financing, general economic, political risks, market or business conditions, regulatory changes, timeliness of government or regulatory approvals and other risks involved in the mineral exploration and development industry, and those risks set out in the filings on SEDAR made by the Company with securities regulators. Although the Company believes that the assumptions and factors used in preparing the forward-looking information in this corporate press release are reasonable, undue reliance should not be placed on such information, which only applies as of the date of this news release, and no assurance can be given that such events will occur in the disclosed time frames or at all. The Company expressly disclaims any intention or obligation to update or revise any forward-looking statements whether as a result of new information, future events or otherwise, other than as required by applicable securities legislation.
Neither the TSX Venture Exchange nor its Regulation Services Provider (as that term is defined in the policies of the TSX Venture Exchange) accepts responsibility for the adequacy or accuracy of this release.
Central Bank Gold Reserves: Biggest Changes (2020–2025)
See visuals like this from many other data creators on our Voronoi app. Download it for free on iOS or Android and discover incredible data-driven charts from a variety of trusted sources.
Key Takeaways
China, Poland, and Türkiye led global gold buying among central banks between 2020 and 2025.
Rising gold prices and currency risk pushed many countries to boost gold reserves, while a smaller group reduced holdings.
Gold prices soared past $5,500 an ounce in late January as weakness in the U.S. dollar continued to steer investors toward hard assets. Since 2020, gold prices have risen by more than 230%, increasing the appeal of bullion for central banks seeking stability during a volatile economic period.
This visualization highlights which central banks made the biggest changes to their gold reserves between 2020 and 2025. The data for this visualization comes from the World Gold Council.
China and Eastern Europe Lead Gold Buying
China recorded the largest increase in gold reserves over the period, adding more than 350 tonnes. This reflects a broader strategy to diversify reserves away from the U.S. dollar and strengthen financial independence. Poland followed closely, increasing its gold holdings by over 300 tonnes as part of a long-term push to bolster monetary security.
Türkiye and India also ranked among the top buyers. Both countries face persistent inflation pressures and currency volatility, making gold an attractive hedge within official reserves.
Most gold purchased
2020-2025 (tonnes)
Most gold sold
2020-2025 (tonnes)
China
357.1
Philippines
-65.2
Poland
314.6
Kazakhstan
-52.4
Türkiye
251.8
Sri Lanka
-19.1
India
245.3
Germany
-16.3
Brazil
105.1
Mongolia
-15.9
Azerbaijan
83.6
Tajikistan
-11.9
Japan
80.8
Euro Area (average)
-10.8
Thailand
80.6
Colombia
-9.2
Hungary
78.5
Finland
-5.4
Singapore
77.3
Curaçao & St. Maarten
-3.9
Iraq
74.6
Solomon Islands
-0.6
Qatar
73
Suriname
-0.4
Czech Rep.
62.8
Malta
-0.3
Russia
55.4
Ethiopia
-0.2
United Arab Emirates
51.7
Switzerland
-0.1
Emerging Markets Step Up Accumulation
Beyond the largest buyers, several emerging markets made notable additions. Brazil added more than 100 tonnes, while Azerbaijan’s increase came through its sovereign wealth fund, the State Oil Fund of the Republic of Azerbaijan.
Japan, Thailand, Hungary, and Singapore also expanded reserves, signaling broader global interest in gold as a stabilizing asset during periods of economic uncertainty.
Who Reduced Gold Holdings?
On the selling side, the Philippines recorded the largest reduction, cutting reserves by over 65 tonnes. Kazakhstan and Sri Lanka also saw significant declines, often linked to domestic liquidity needs or reserve rebalancing.
Several European countries, including Germany and Finland, posted modest reductions. Switzerland’s change was minimal, underscoring its generally stable approach to gold management compared with more active buyers elsewhere.
Forecast 240 koz deficit for 2026 follows deep 1,082 koz deficit in 2025
Depleted above ground stocks projected to remain at just over four months’ worth of global demand through 2026
Total bar and coin investment demand to jump 35% to 725 koz, with gains expected across all markets and India emerging as a new growth market
While exchange traded fund (ETF) and exchange stocks are expected to remain at elevated levels, the significant inflows seen in 2025 are not expected to repeat, resulting in total demand coming in 8% lower than in 2025 at 7,619 koz
Industrial demand to rebound, increasing 11% to 2,124 koz as glass capacity expansion resumes, helping to offset respective 3% and 12% reductions in automotive and jewellery demand
Total platinum supply to increase by 2% as recycling supply grows 10%, incentivised by higher prices, while mine supply is projected to be flat
LONDON, March 4, 2026 /PRNewswire/ — The World Platinum Investment Council – WPIC® – today publishes its PlatinumQuarterly for the fourth quarter of 2025 and full year 2025, with a revised forecast for 2026.
Trevor Raymond, CEO of the World Platinum Investment Council, comments:
“The key drivers of platinum’s price rally in 2025, namely strong supply/demand fundamentals, a depletion of above ground stocks, and macropolitical uncertainty-driven precious metals demand, are expected to persist in 2026. Consequently, market tightness is likely to continue, maintaining investor interest in platinum, and further supporting bar and coin and ETF demand throughout the year. One item not yet captured in the supply/demand balance is any exchange stocks warehoused with the Guangzhou Futures Exchange, which could potentially deepen the deficit versus current projections once these are made publicly available.”
Neither the World Platinum Investment Council nor Metals Focus is authorised by any regulatory authority to give investment advice. Nothing within this document is intended or should be construed as investment advice or offering to sell or advising to buy any securities or financial instruments and appropriate professional advice should always be sought before making any investment.

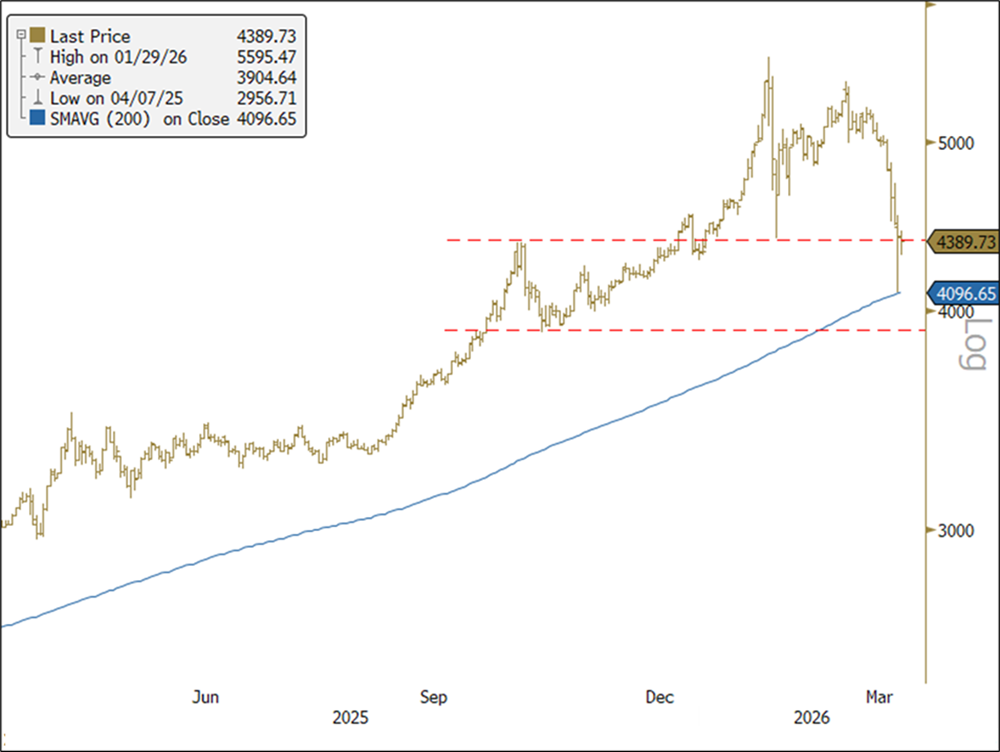
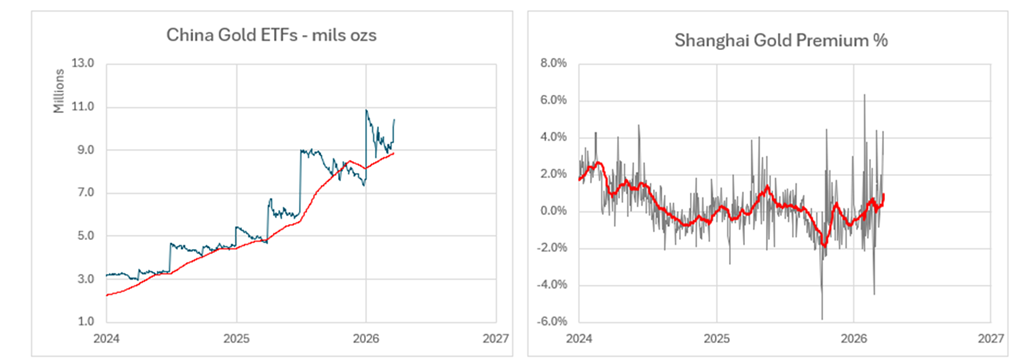
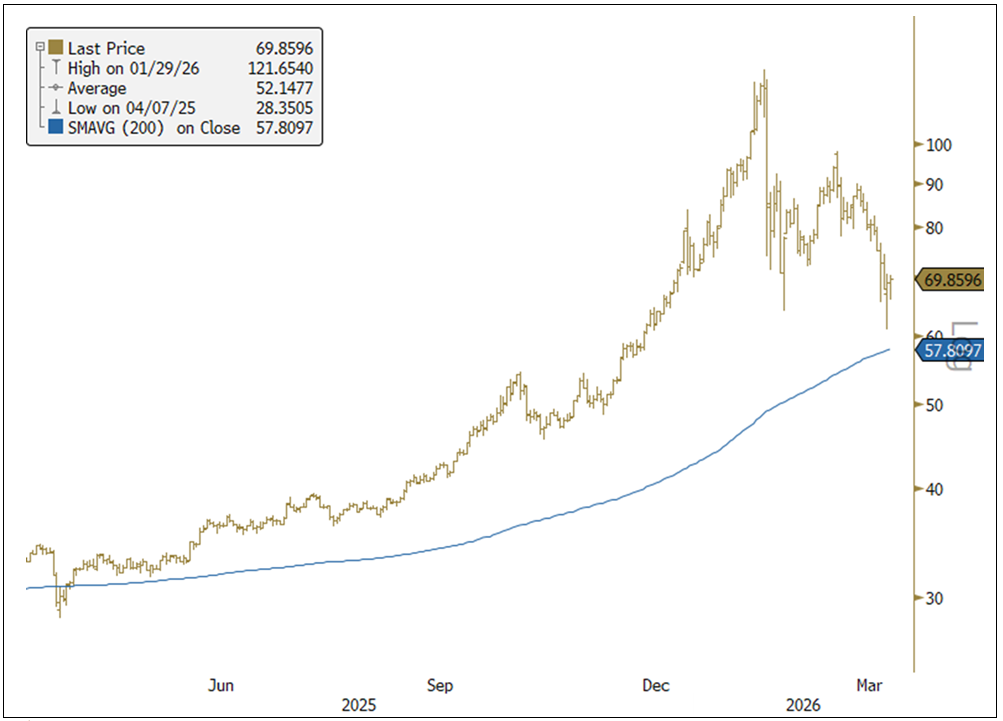


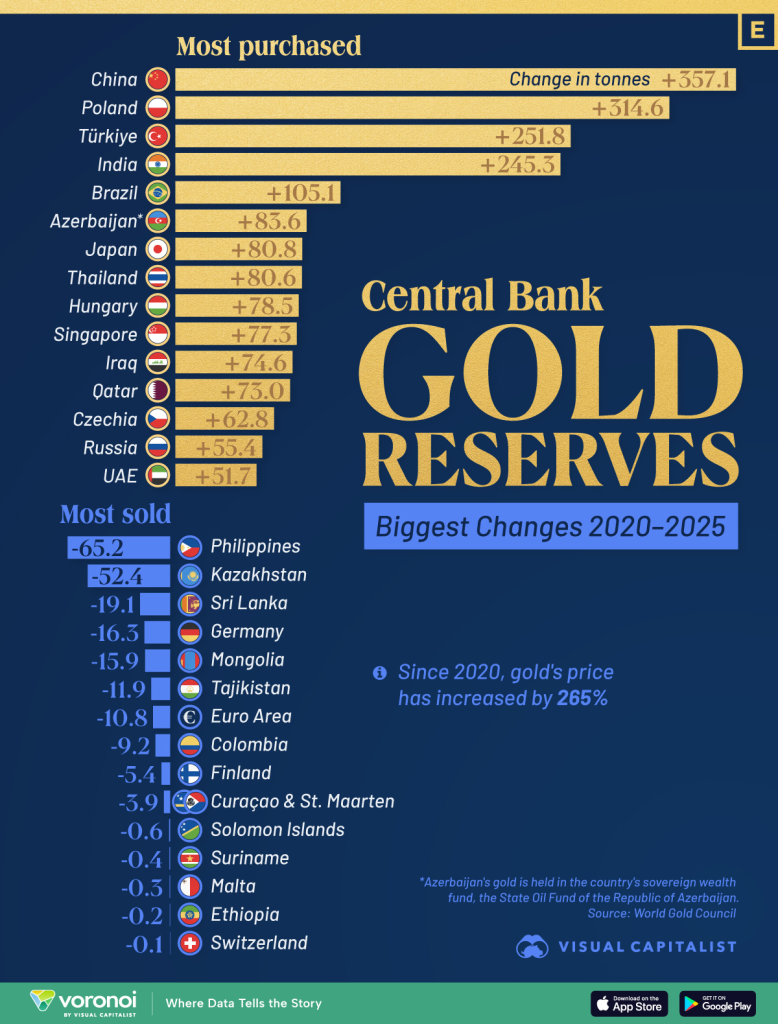
 China
China Philippines
 Poland
 Kazakhstan
 Türkiye
 Sri Lanka
 India
India Germany
 Brazil
 Mongolia
 Azerbaijan
 Tajikistan
 Japan
Japan Euro Area (average)
 Thailand
 Colombia
 Hungary
 Finland
 Singapore
 Curaçao & St. Maarten
 Iraq
Iraq Solomon Islands
 Qatar
Qatar Suriname
 Czech Rep.
 Malta
Malta Russia
 Ethiopia
 United Arab Emirates
 Switzerland
