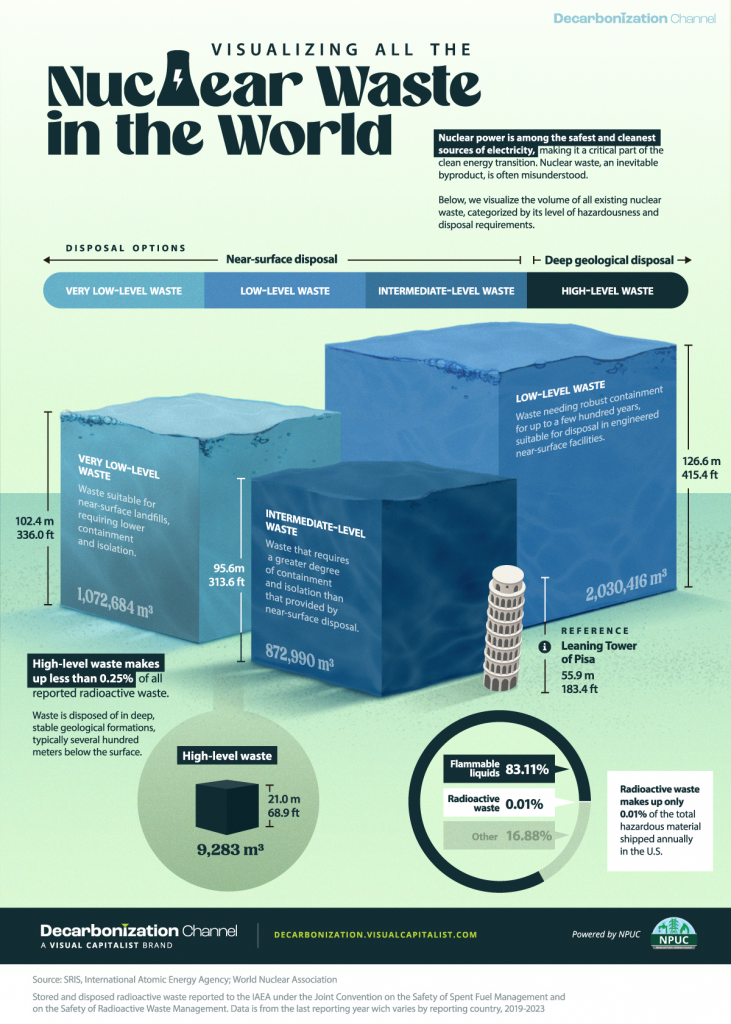
Visualizing All the Nuclear Waste in the World
Originally posted on the Decarbonization Channel. Subscribe to the free mailing list to be the first to receive decarbonization-related visualizations, with a focus on the U.S. power sector.
Nuclear power is among the safest and cleanest sources of electricity, making it a critical part of the clean energy transition.
However, nuclear waste, an inevitable byproduct, is often misunderstood.
In collaboration with the National Public Utilities Council, this graphic shows the volume of all existing nuclear waste, categorized by its level of hazardousness and disposal requirements, based on data from the International Atomic Energy Agency (IAEA).
Storage and Disposal
Nuclear provides about 10% of global electricity generation.
Nuclear waste, produced as a result of this, can be divided into four different types:
- Very low-level waste: Waste suitable for near-surface landfills, requiring lower containment and isolation.
- Low-level waste: Waste needing robust containment for up to a few hundred years, suitable for disposal in engineered near-surface facilities.
- Intermediate-level waste: Waste that requires a greater degree of containment and isolation than that provided by near-surface disposal.
- High-level waste: Waste is disposed of in deep, stable geological formations, typically several hundred meters below the surface.
Despite safety concerns, high-level radioactive waste constitutes less than 0.25% of total radioactive waste reported to the IAEA.
| Waste Class | Disposed (cubic meters) | Stored (cubic meters) | Total (cubic meters) |
|---|---|---|---|
| Very low-level waste | 758,802 | 313,882 | 1,072,684 |
| Low-level waste | 1,825,558 | 204,858 | 2,030,416 |
| Intermediate level waste | 671,097 | 201,893 | 872,990 |
| High-level waste | 3,960 | 5,323 | 9,283 |
Stored and disposed radioactive waste reported to the IAEA under the Joint Convention on the Safety of Spent Fuel Management and on the Safety of Radioactive Waste Management. Data is from the last reporting year which varies by reporting country, 2019-2023.
The amount of waste produced by the nuclear power industry is small compared to other industrial activities.
While flammable liquids comprise 82% of the hazardous materials shipped annually in the U.S., radioactive waste accounts for only 0.01%.
Original Source: https://elements.visualcapitalist.com/visualizing-all-the-nuclear-waste-in-the-world/


