Visualizing the World’s Largest Copper Producers
Man has relied on copper since prehistoric times. It is a major industrial metal with many applications due to its high ductility, malleability, and electrical conductivity.
Many new technologies critical to fighting climate change, like solar panels and wind turbines, rely on the red metal.
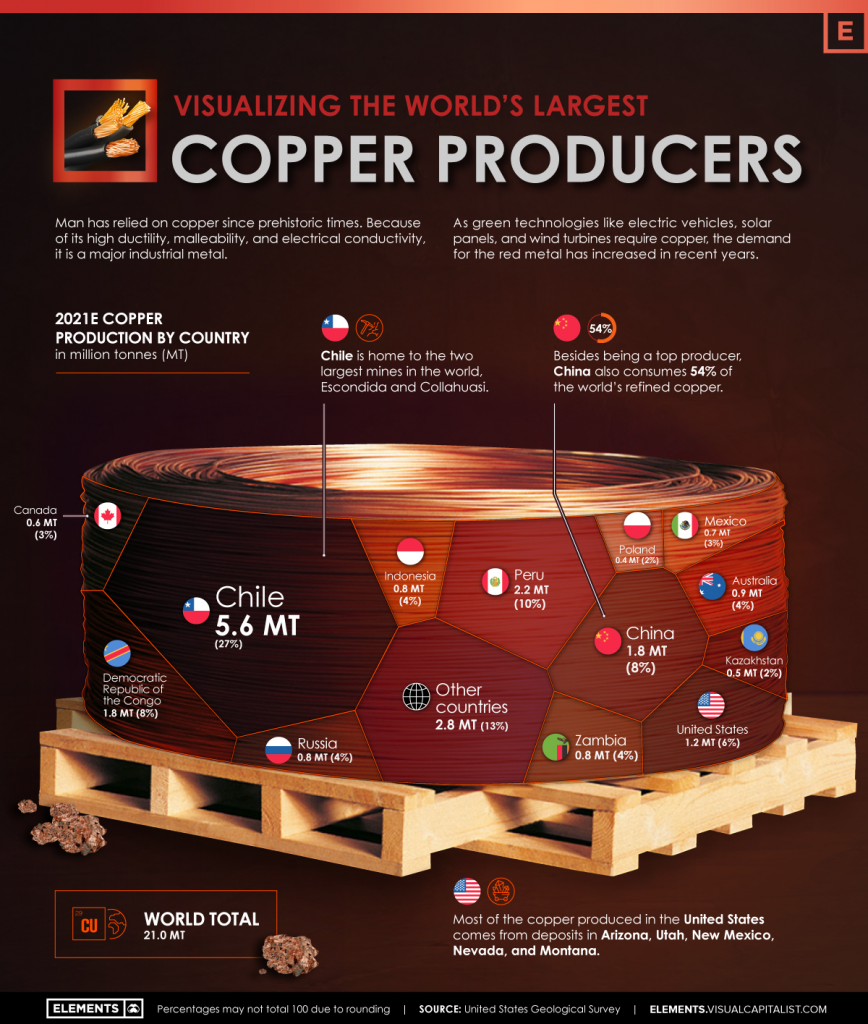
But where does the copper we use come from? Using the U.S. Geological Survey’s data, the above infographic lists the world’s largest copper producing countries in 2021.
The Countries Producing the World’s Copper
Many everyday products depend on minerals, including mobile phones, laptops, homes, and automobiles. Incredibly, every American requires 12 pounds of copper each year to maintain their standard of living.
North, South, and Central America dominate copper production, as these regions collectively host 15 of the 20 largest copper mines.
Chile is the top copper producer in the world, with 27% of global copper production. In addition, the country is home to the two largest mines in the world, Escondida and Collahuasi.
Chile is followed by another South American country, Peru, responsible for 10% of global production.
| Rank | Country | 2021E Copper Production (Million tonnes) | Share |
|---|---|---|---|
| #1 |  Chile Chile | 5.6 | 27% |
| #2 |  Peru Peru | 2.2 | 10% |
| #3 |  China China | 1.8 | 8% |
| #4 |  DRC DRC | 1.8 | 8% |
| #5 |  United States United States | 1.2 | 6% |
| #6 |  Australia Australia | 0.9 | 4% |
| #7 |  Russia Russia | 0.8 | 4% |
| #8 |  Zambia Zambia | 0.8 | 4% |
| #9 |  Indonesia Indonesia | 0.8 | 4% |
| #10 |  Mexico Mexico | 0.7 | 3% |
| #11 |  Canada Canada | 0.6 | 3% |
| #12 |  Kazakhstan Kazakhstan | 0.5 | 2% |
| #13 |  Poland Poland | 0.4 | 2% |
| 🌍 Other countries | 2.8 | 13% | |
| 🌐 World total | 21.0 | 100% |
The Democratic Republic of Congo (DRC) and China share third place, with 8% of global production each. Along with being a top producer, China also consumes 54% of the world’s refined copper.
Copper’s Role in the Green Economy
Technologies critical to the energy transition, such as EVs, batteries, solar panels, and wind turbines require much more copper than conventional fossil fuel based counterparts.
For example, copper usage in EVs is up to four times more than in conventional cars. According to the Copper Alliance, renewable energy systems can require up to 12x more copper compared to traditional energy systems.
| Technology | 2020 Installed Capacity (megawatts) | Copper Content (2020, tonnes) | 2050p Installed Capacity (megawatts) | Copper Content (2050p, tonnes) |
|---|---|---|---|---|
| Solar PV | 126,735 MW | 633,675 | 372,000 MW | 1,860,000 |
| Onshore Wind | 105,015 MW | 451,565 | 202,000 MW | 868,600 |
| Offshore Wind | 6,013 MW | 57,725 | 45,000 MW | 432,000 |
With these technologies’ rapid and large-scale deployment, copper demand from the energy transition is expected to increase by nearly 600% by 2030.
As the transition to renewable energy and electrification speeds up, so will the pressure for more copper mines to come online.
Original Source: https://elements.visualcapitalist.com/visualizing-the-worlds-largest-copper-producers/
Published 3 months ago
on December 1, 2022